by Ceres Team, Feb 22, 2022 in CeresScience
new climate science study, involving a panel of 17 experts from 13 countries, has just been published in the scientific journal, Atmosphere. The study looked at the various data adjustments that are routinely applied to the European temperature records in the widely used Global Historical Climatology Network (GHCN) dataset over the last 10 years.
by J. Marohasy, April 2023 in WUWT
In the five years following the installation of probes in automatic weather stations (AWS) as they replaced mercury thermometers across Australia, the annual frequency of extremely hot days increased by an average 18.7%.
This new analysis by Perth journalist and climate researcher Chris Gillham makes a mockery of claims by the Bureau that the transition from mercury thermometers to automatic weather stations has had no effect on temperatures, and so there is no need to transcribe or make public the parallel data.
Chris has found that a majority of these AWS stations had an average 62.8% increase in their 99th percentile observations. These are the hottest 1 per cent of days calculated since the start year of each station.
…
…
by C. Morrison, Nov 24, 2022 in ClimateChangeDispatch
The widespread use of regularly adjusted global and local surface temperature datasets showing increasingly implausible rates of warming has been dealt a further blow with new groundbreaking research that shows 50% less warming over 50 years across the eastern United States.
The research attempts to remove distortions caused by increasing urban heat and uses human-made structure density data over 50 years supplied by the Landsat satellites. [bold, links added]
The 50% reduction in the warming trend is in comparison with the official National Oceanic and Atmospheric Administration (NOAA) homogenized surface temperature dataset.
The research was compiled by two atmospheric scientists at the University of Alabama in Huntsville, Dr. Roy Spencer and Professor John Christy.
They used a dataset of urbanization changes called ‘Built-Up’ to determine the average effect that urbanization has had on surface temperatures.
Urbanization differences were compared to temperature differences from closely spaced weather stations. The temperature plotted was in the morning during the summertime.
A full methodology of the project is shown here in a posting on Dr. Spencer’s blog.
Dr. Spencer believes that the ‘Built-Up’ dataset, which extends back to the 1970s, will be useful in ‘de-urbanizing’ land-based surface temperature measurements in the U.S. as well as other countries.
All the major global datasets use temperature measurements from the Integrated Surface Database (ISD), and all have undertaken retrospective upward adjustments in the recent past.
In the U.K., the Met Office removed a ‘pause’ in global temperatures from 1998 to around 2010 by two significant adjustments to its HadCRUT database over the last 10 years.
The adjustments added about 30% warming to the recent record. Removing the recent adjustments would bring the surface datasets more in line with the accurate measurements made by satellites and meteorological balloons.
Of course, if the objective is to promote a command-and-control Net Zero project using widespread fear of rising temperatures to mandate huge societal and economic changes, a little extra warming would appear useful.
But warming on a global scale started to run out of steam over 20 years ago, and the stunt can only be pulled for so long before the disconnect with reality becomes too obvious.
There is a danger that the integrity of the surface measurements will be put on the line. Earlier this year, two top atmospheric scientists, Emeritus Professors William Happer and Richard Lindzen told a U.S. Government inquiry that “climate science is awash with manipulated data, which provides no reliable scientific evidence.”
…
by Heartland Institute, July 27, 2022
Official NOAA temperature stations produce corrupted data due to purposeful placement in man-made hot spots
Nationwide study follows up widespread corruption and heat biases found at NOAA stations in 2009, and the heat-bias distortion problem is even worse now
ARLINGTON HEIGHTS, IL (July 27, 2022) – A new study, Corrupted Climate Stations: The Official U.S. Surface Temperature Record Remains Fatally Flawed, finds approximately 96 percent of U.S. temperature stations used to measure climate change fail to meet what the National Oceanic and Atmospheric Administration (NOAA) considers to be “acceptable” and uncorrupted placement by its own published standards.
The report, published by The Heartland Institute, was compiled via satellite and in-person survey visits to NOAA weather stations that contribute to the “official” land temperature data in the United States. The research shows that 96% of these stations are corrupted by localized effects of urbanization – producing heat-bias because of their close proximity to asphalt, machinery, and other heat-producing, heat-trapping, or heat-accentuating objects. Placing temperature stations in such locations violates NOAA’s own published standards (see section 3.1 at this link), and strongly undermines the legitimacy and the magnitude of the official consensus on long-term climate warming trends in the United States.
“With a 96 percent warm-bias in U.S. temperature measurements, it is impossible to use any statistical methods to derive an accurate climate trend for the U.S.” said Heartland Institute Senior Fellow Anthony Watts, the director of the study. “Data from the stations that have not been corrupted by faulty placement show a rate of warming in the United States reduced by almost half compared to all stations.”
NOAA’s “Requirements and Standards for [National Weather Service] Climate Observations” instructs that temperature data instruments must be “over level terrain (earth or sod) typical of the area around the station and at least 100 feet from any extensive concrete or paved surface.” And that “all attempts will be made to avoid areas where rough terrain or air drainage are proven to result in non-representative temperature data.” This new report shows that instruction is regularly violated.
READ THE REPORT (PDF).
…
by P. O’Neill et al., Feb 24, 2022 in MPDI
The widely used Global Historical Climatology Network (GHCN) monthly temperature dataset is available in two formats—non-homogenized and homogenized. Since 2011, this homogenized dataset has been updated almost daily by applying the “Pairwise Homogenization Algorithm” (PHA) to the non-homogenized datasets. Previous studies found that the PHA can perform well at correcting synthetic time series when certain artificial biases are introduced. However, its performance with real world data has been less well studied. Therefore, the homogenized GHCN datasets (Version 3 and 4) were downloaded almost daily over a 10-year period (2011–2021) yielding 3689 different updates to the datasets. The different breakpoints identified were analyzed for a set of stations from 24 European countries for which station history metadata were available. A remarkable inconsistency in the identified breakpoints (and hence adjustments applied) was revealed. Of the adjustments applied for GHCN Version 4, 64% (61% for Version 3) were identified on less than 25% of runs, while only 16% of the adjustments (21% for Version 3) were identified consistently for more than 75% of the runs. The consistency of PHA adjustments improved when the breakpoints corresponded to documented station history metadata events. However, only 19% of the breakpoints (18% for Version 3) were associated with a documented event within 1 year,
and 67% (69% for Version 3) were not associated with any documented event. Therefore, while the PHA remains a useful tool in the community’s homogenization toolbox, many of the PHA adjustments applied to the homogenized GHCN dataset may have been spurious. Using station metadata to assess the reliability of PHA adjustments might potentially help to identify some of these spurious adjustments.
View Full-Text
…
by P. Homewood, Dec 16, 2020 in NotaLotofPeopleKnowThat
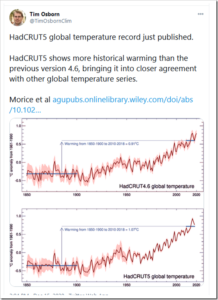
The Morice paper claims the extra warming has come from an improved representation of Arctic warming and a better understanding of evolving biases in sea‐surface temperature measurements from ships.
In fact it is not scientific to average together Arctic temperatures with the rest of the planet, as it is comparing apples with oranges. It all has to do with latent heat and water vapour, as Tony Heller brilliantly explained:
…
by K. Richard, Sep 21, 2020 in NoTricksZone
Paleoclimate reconstructions that find no unusual modern warming are nonetheless characterized as showing sharp temperature increases in recent decades anyway.
A new (Li et al., 2020) 1818-2012 temperature reconstruction determined 1955 (6.33 °C) and 2001 (7.17 °C) were the 1st and 5th coldest years in northeastern China in the last 200 years. The two warmest years were 1832 (9.63 °C) and 1900 (9.57 °C).
Further, the highest “continuous high decadal temperatures” recorded were in 1818–1844 and 1856–1873. The post-1950s temperatures were colder than nearly all of the first 100 years of the temperature record.
And yet in spite of the warmer 19th-century temperatures, the authors chracterize the slight temperature rise since the 1950s as heralding in “unprecedented” warming. They make this claim (of “unprecedented” recent warmth) in both the paper’s textual and graphical abstracts.
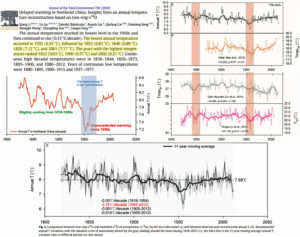
Image Source: Li et al., 2020
Forbes et al. (2020) use thermometer data from an Alaskan airport for the last ~90 years of their temperature record. The instrumentals show surface temperatures cooled -0.7°C in winter (January) and warmed 0.8°C in summer (July) from the 1950s-’80s decades to the 1990s to 2010s.
For the summer temperature record (shown in red below), nearly all the warming occurred during a step-change from the mid-1970s to mid-1980s. Since about 1985, summer temperatures seem to have been stable to slightly declining.
A lack of net overall warming in the last 50 or 60 years does not advance the anthropogenic global warming (AGW) cause, of course.
…
by Tony Heller, March 5, 2020 in RealClimateScience
Over the past 30 years, NOAA has been rapidly losing US thermometers. In 1989, 1,205 stations reported some daily temperatures, but last year only 871 stations reported some daily temperatures.
Thirty-five percent (424) of the stations in 2019 were zombie stations, meaning that NOAA estimated data for all twelve months. This is done even for some of the thermometers which reported at least a little data in 2019.
…
by Paul Matthews, June 30, 2019 in ClimateScepticism
The history of climate scientists adjusting data to try to make recent warming look greater than it really is goes back quite a long way – it’s a regular topic at Paul Homewood’s blogfor example. But climate scientists continue to do it, giving the sceptics plenty of ammunition. Here are three recent blog posts discussing how climate scientists continue to adjust data to exaggerate warming.
At Pierre Gosselin’s blog there’s a guest post by Kirje from Japan, on NASA GISS temperature adjustments. In the latest GISS version, V4, the supposedly “unadjusted” data sets are different from the unadjusted data in the previous version V3.
Tony Heller has a graph of the 2000, 2017 and 2019 version of NASA GISTEMP, showing that Gavin Schmidt and his team have managed to crank up warming, particularly in the era of the inconvenient pause. You can also see this effect in fig 2 and fig 4 of the GISS history page.
Here in the UK, the HadCRUT4 team are doing the same thing. Clive Best asks Whatever happened to the Global Warming Hiatus? The answer is that they have demolished it with a sequence of adjustments to the data. HadCRUT3, as published in 2014, shows a clear pause, with no warming from about 2001-2013, but the latest new improved data set HadCRUT4.6 cranks recent temperatures upwards. Clive thought that night be due to including different measurement stations, but checked and found that was not the case. The numbers have simply been adjusted.
….
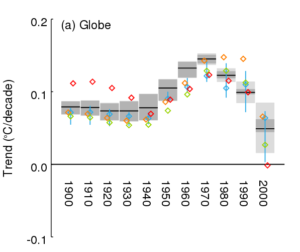
Here the red diamond is the raw data, the green diamond is HadSST3, and the new HadSST4 is shown as the black line, with grey shading representing uncertainty. In the early years of the 20th century, there was global warming that doesn’t fit with the carbon-dioxide-controlled theory of climate scientists, so that is adjusted downwards. But look at the trend over the pause era, since 2000. The raw data shows literally no trend at all. HadSST3 adjusted the trend upwards to create warming, and HadSST4 adjusts things upwards again, roughly doubling the previous adjustment. And this is in an era when the data quality should be excellent, thanks to the introduction of the ARGO float system.
…
La géologie, une science plus que passionnante … et diverse

