Archives par mot-clé : NOAA

NOAA Study: Atmosphere Warming At Half The Rate Predicted By Climate Models

by R. MCKitrick, Apr 13, 2023 in ClimateChangeDispatch


An important new study on climate change came out recently. I’m not talking about the Intergovernmental Panel on Climate Change (IPCC) Synthesis Report with its nonsensical headline, “Urgent climate action can secure a liveable future for all.”

No, that’s just meaningless sloganeering proving yet again how far the IPCC has departed from its original mission of providing objective scientific assessments. [emphasis, links added]

I’m referring instead to a new paper in the Journal of Geophysical Research-Atmospheres by a group of scientists at the U.S. National Oceanic and Atmospheric Administration (NOAA) headed by Cheng-Zhi Zou, which presents a new satellite-derived temperature record for the global troposphere (the atmospheric layer from one kilometer up to about 10 km altitude).

The troposphere climate record has been heavily debated for two reasons. First, it’s where climate models say the effect of warming due to greenhouse gases (GHGs) will be the strongest, especially in the mid-troposphere.

And since that layer is not affected by urbanization or other changes to the land surface, it’s a good place to observe a clean signal of the effect of GHGs.

Since the 1990s the records from both weather satellites and weather balloons have shown that climate models predict too much warming.

In a 2020 paper, John Christy of the University of Alabama-Huntsville (UAH) and I examined the outputs of the 38 newest climate models and compared their global tropospheric warming rates from 1979 to 2014 against observations from satellites and weather balloons.

All 38 exhibited too much warming, and in most cases, the differences were statistically significant. We argued that this points to a structural error in climate models where they respond too strongly to GHGs.

But, and this is the second point of controversy, there have also been challenges to the observational record.

NOAA’s Climate Disaster Claims Are A Sham

by C. Rotter, Feb 20, 2021 in WUWT


When a hurricane hits a populated stretch of coast, which is almost invariably, it is inevitable losses will be big. But while last year was a busy year for hurricanes, we do know that the frequency of US hurricanes has not been unusual in the last decade, and if anything the long term trend is down. (Though it is worth noting that the 1980s and 90s were below average, making the choice of 1980 as a start date statistically inappropriate):

NOAA Bureaucrats Falsely Claim ‘Extraordinary’ Sea Level Rise

by H.S. Burnett, July 18, 2020 in ClimateRealism


The National Oceanic and Atmospheric Administration, which relies on perpetuation of the Climate Delusion to maintain high funding, is falsely claiming there has been “extraordinary” sea level rise since 2000. Fox News and other media outlets are devoting substantial attention to the assertion by NOAA bureaucrats. However, there is simply nothing extraordinary about recent sea level rise.

According to Fox News, NOAA claims “Communities in coastal areas of the U.S. saw record-setting high-tide flooding last year, part of a trend of rising seas … [and an] ‘extraordinary’ rise in high-tide flooding since 2000.”

“Damaging floods that decades ago happened only during a storm now happen more regularly, even without severe weather,” Nicole LeBoeuf, acting assistant administrator for NOAA’s National Ocean Service, told reporters in a conference call.

Even if high-tide flooding has increased in recent years, natural factors are the primary cause.

As detailed in Climate at a Glance: Sea Level Rise: Data shows global sea level has been rising at a relatively steady pace of approximately one foot per century since at least the mid-1800s, which was long before coal power plants and SUVs. Moreover, the United Nations Intergovernmental Panel on Climate Change (IPCC) confirms here has been no significant recent acceleration.

Global sea level has risen approximately 400 feet since the beginning of the end of the most recent ice age—approximately 20,000 years ago. The rate of sea level rise has risen and fallen at various times since then, slowing and increasing on the order of tens, hundreds, and thousands of years over the past 20,000 years. All of that variance had  nothing to do with human activities. Indeed, as NASA reports, sea level always rises between ice ages as ice sheets retreat. During the last interglacial period between ice ages, seas were four to six meters higher than we are experiencing today….

Calculating Temperatures Without Thermometers

by Tony Heller, March 5, 2020 in RealClimateScience


Over the past 30 years, NOAA has been rapidly losing US thermometers. In 1989, 1,205 stations reported some daily temperatures, but last year only 871 stations reported some daily temperatures.

Thirty-five percent (424) of the stations in 2019 were zombie stations, meaning that NOAA estimated data for all twelve months. This is done even for some of the thermometers which reported at least a little data in 2019.


NOAA Relies on ‘Russian Collusion’ to Claim January Was Hottest Month on Record

by Anthony Watts, February 29, 2020 in WUWT


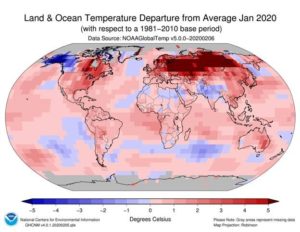
In a report generating substantial media attention this month, the National Oceanic and Atmospheric Administration (NOAA) claimed January 2020 was the hottest January on record. In reality, the claim relies on substantial speculation, dubious reporting methods, and a large, very suspicious, extremely warm reported heat patch covering most of Russia.

The January 2020 Climate Assessment Report, released by NOAA’s National Center for Environmental Information (NCEI), was accompanied by a map showing a giant red menace of extraordinary asserted warmth extending from the Russian border with Poland well into Siberia. Yet, the asserted hot spot appears nowhere else.


Figure 1: Map of temperature departure provided by NOAA/NCEII. Note the huge red spot over Russia.

Continuer la lecture de NOAA Relies on ‘Russian Collusion’ to Claim January Was Hottest Month on Record

HISTORICAL DATA DESTROYS THE GLOBAL WARMING MYTH, AND PEOPLE ARE WAKING TO IT…

by Cap Allon, January 22, 2020 in Electroverse


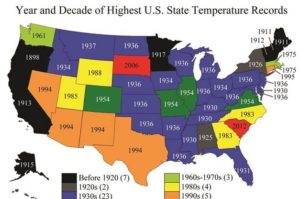
According to NOAA’s own historical data, of the 50 U.S. state all-time record high temperatures, 23 were set during the 1930s, while 36 occurred prior to 1960 — climate change proponents are feeding us a fairy tale, and I’m sick of it…

The maniacal sociopaths of the world may have won control of the narrative, but they seemingly have little sway over the will of the people. You need only browse the comment section below any “climate change” article or social media post to see the wave of folks resoundingly rejecting the scam-of-a-world-view assembled before them (one of the few positives of SM).

The man-made global warming rejection is likely down to two things: the first being that the so called “scientific consensus” has been failing for far too long — you can’t start warning people in the 1980s that we have 10 years left to save the planet, only to keep repeating that prophecy for the next 4 decades. This is probably the reason our youth have become the new target — kids don’t have this history of failure to draw-upon when browsing the bullet points of the latest IPCC report -for example- meaning they’re far easier to manipulate.


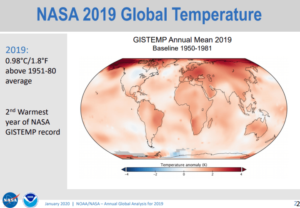
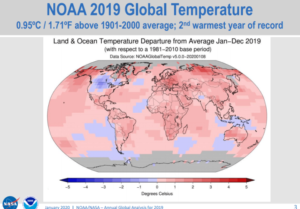
While NOAA/NASA claims 2019 as the “second warmest year ever”, other data shows 2019 cooler than 2005 for USA.

by Anthony Watts, January 15, 2020 in WUWT


Today, at the big 100 year anniversary shindig of the American Meteorological Society (AMS) there was a press release session that featured NOAA and NASA GISS talking about how their climate data says that the world in 2019 was the second warmest ever.

Here is their slideshow presentation, released today: https://www.ncdc.noaa.gov/sotc/briefings/20200115.pdf

In my opinion, the NOAA/NASA press release (and slideshow) is inconsistently presented. For example, they can’t even agree on a common base period for comparisons. Some graphs use 1951-1980 while others compare to 1981-2010 averages to create anomaly plots. NOAA and NASA owe it to the public to present climate data with a consistent climate period for comparison, otherwise it’s just sloppy science. NASA GISS has consistently resisted updating the 1951-1980 NASA GISS baseline period to the one NOAA and other datasets use, which is 1981-2010. GISS stubbornly refuses to change even though they have been repeatedly excoriated for keeping it.

That 1951-1980 period just so happens to be the coolest period in the 20th century, so by using that as a baseline, the peak amount of warming anomaly is magnified in NASA GISS plots. Most laymen will never spot this. A simple comparison of the two maps show the difference in the peak values:


Former Award-Winning NOAA scientist Dr. Rex Fleming declares his climate dissent

by Marc Morano, July 30, 2019 in Climate Depot,


Former NOAA Award-Winning Atmospheric Scientist Dr. Rex Fleming joins many former UN IPCC and U.S. government scientists publicly dissenting on man-made climate change. Fleming declares that “CO2 has no impact on climate change.”

“Past climates have been warm and cold and warm and cold with no changes in carbon dioxide. How can that be a cause when there’s no correlation.”

Fleming 8:10 on AMS, AGU, AAAS: “all 3 of those organizations will not support a “denier”..I could not get published in any of those organizations..as a denier..I had to go to Europe to publish a paper..it was peer-reviewed in Europe, it got thru, & it has been very successful”
Quote Tweet

Fleming’s work here: The Rise and Fall of the Carbon Dioxide Theory of Climate Change (2019)


‘Hidden’ NOAA temperature data reveals that 6 of the last 9 months were below normal in the USA – and NOAA can’t even get June right

by Anthony Watts, July 30, 2019 in WUWT


A review of state-of-the-art climate data tells a different story than what NOAA tells the public.

While media outlets scream “hottest ever” for the world in June and July (it’s summer) and opportunistic climate crusaders use those headlines to push the idea of a “climate crisis” the reality is for USA is that so far most of 2019 has been below normal, temperature-wise.

Little known data from the state of the art U.S. Climate Reference Network (which never seems to make it into NOAA’s monthly “state of the climate” reports) show that for the past nine months, six of them were below normal, shown in bold below.

201810 -0.18°F
201811 -2.56°F
201812 2.39°F
201901 0.63°F
201902 -3.15°F
201903 -2.81°F
201904 1.55°F
201905 -1.13°F
201906 -0.14°F

Above: Table 1, U.S. average temperature anomaly from October 2018 to June 2019. Full data file here

‘Hidden’ NOAA temperature data reveals that 6 of the last 9 months were below normal in the USA – and NOAA can’t even get June right

by Anthony Watts, July 30 2019 in WUWT


A review of state-of-the-art climate data tells a different story than what NOAA tells the public.

While media outlets scream “hottest ever” for the world in June and July (it’s summer) and opportunistic climate crusaders use those headlines to push the idea of a “climate crisis” the reality is for USA is that so far most of 2019 has been below normal, temperature-wise.

Little known data from the state of the art U.S. Climate Reference Network (which never seems to make it into NOAA’s monthly “state of the climate” reports) show that for the past nine months, six of them were below normal, shown in bold below.


201810 -0.18°F
201811 -2.56°F
201812 2.39°F
201901 0.63°F
201902 -3.15°F
201903 -2.81°F
201904 1.55°F
201905 -1.13°F
201906 -0.14°F

Above: Table 1, U.S. average temperature anomaly from October 2018 to June 2019. Full data file here

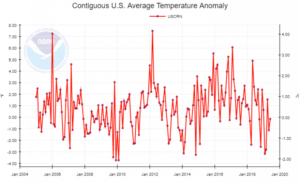
Note the below average value for June, 2019 at -0.14°F

Figure 1, U.S. average temperature anomaly from January 2005 to June 2019. Source of graph, NOAA, available here

NOAA predicts near-normal 2019 Atlantic hurricane season

by Anthony Watts, May 23, 2019 in WUWT


El Nino and warmer-than-average Atlantic help shape this season’s intensity

From NOAA press release:

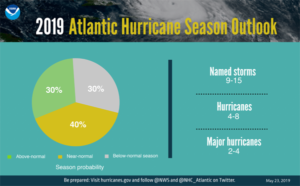
NOAA’s Climate Prediction Center is predicting that a near-normal Atlantic hurricane season is most likely this year. This outlook forecasts a 40% chance of a near-normal season, a 30% chance of an above-normal season and a 30% chance of a below-normal season. The hurricane season officially extends from June 1 to November 30.

For 2019, NOAA predicts a likely range of 9 to 15 named storms (winds of 39 mph or higher), of which 4 to 8 could become hurricanes (winds of 74 mph or higher), including 2 to 4 major hurricanes (category 3, 4 or 5; with winds of 111 mph or higher). NOAA provides these ranges with a 70% confidence. An average hurricane season produces 12 named storms, of which 6 become hurricanes, including 3 major hurricanes.

NOAA : “among the eight warmest Februarys on record”

by Tony Heller, March 19, 2019 in TheDeplorableClimSciBLog


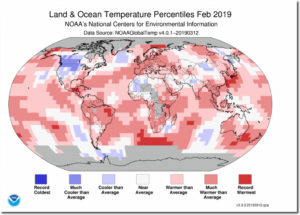
NOAA says last month was “among the eight warmest Februarys on record” in much of the Earth.

According to NCEI’s Regional Analysis, South America, Europe and Oceania had a February temperature that ranked among the eight warmest Februarys on record.

There is no such word as “Februarys” – plural for February is Februaries. But besides the fact they are illiterate, they are also lying

It looks like the world is burning up, with just a few slightly cool areas. It has an official government seal on it, so it must be accurate, right?

The map below shows where NOAA actually had surface temperatures in February.

CA sea level rise alarmist study ignores 30 years of NOAA data with no coastal sea level rise acceleration

by Larry Hamlin, March 13, 2019 in WUWT


NOAA tide gauge data measurements exist for 17 locations along the California coast with 8 of these locations having actual measured sea level rise data covering periods for more than 70 to 120 years in duration.

This measured data shows that none of these California locations are experiencing coastal sea level rise acceleration since climate alarmist first made such erroneous and flawed sea level acceleration claims before the U.S. Senate in 1988.

Climate alarmists and their supporting media conveniently conceal the fact that their flawed claims have been hyped for the last 30 years as they continue to try again and again to make the same repeated but flawed claims apparently hoping that the public will forget their long track record of failure and exaggeration.

NOAA measured tide gauge data shows that coastal sea level rise at Ca. locations varies between 3 to 12 inches per century and have remained at those levels during the long measurement periods during which actual measured data have been recorded with a sample of that measured data shown below for San Diego, La Jolla, Los Angeles and San Francisco.

NOAA: El Niño is expected to form and continue through the Northern Hemisphere winter 2018-19

by Anthony Watts, December 13, 2018 in WUWT


EL NIÑO/SOUTHERN OSCILLATION (ENSO) DIAGNOSTIC DISCUSSION
issued by CLIMATE PREDICTION CENTER/NCEP/NWS and the International Research Institute for Climate and Society 13 December 2018
ENSO Alert System Status: El Niño Watch
Synopsis: El Niño is expected to form and continue through the Northern Hemisphere winter 2018/19 (~90% chance) and through spring (~60% chance).

Heat Analysis of NOAA Data Suggests the US Is Not Seeing Increased Warming

by Leland Park, September 13, 2018 in WUWT


Given the impending global warming crisis declared by scientists, it should be easy to unambiguously demonstrate the crisis from the instrumental record. Unfortunately, when looking at the  high temperature record for the US, it does not show any warming.

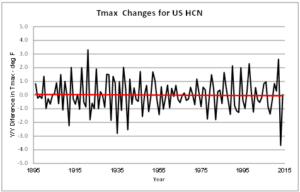
Figure 1 illustrates the incremental changes in surface air temperatures based on year to year differences in station average Tmax. The data is from all active stations in the US Historical Climatology Network (USHCN) from 1895 to 2014.

The classic heat equation defines changes in heat content as being proportional to changes in temperature (ΔQ = ƒ{ΔT} ).

Thus, Figure 1 amounts to a depiction of incremental changes in heat content, without scaling in energy units. The overall net temperature change is 0, which means the net change in heat content is also zero (ΔQ = ƒ{ΔT} = ƒ{0} = 0).

Figure 1 Year to Year Heat Changes (ΔT) for the USHCN

NOAA says La Niña in the Pacific is over

by R. Lindsey, NOAA, May 11, 2018 in WUWT


Why do U.S. climate forecasters pay so much attention to a pattern that operates in the remote tropical Pacific? Because the Pacific is the world’s biggest ocean, and disruptions to its climate have a long reach. The seesawing changes in tropical rainfall, winds, and ocean temperature that accompany La Niña and its warm-phase partner, El Niño, trigger a cascade of potentially predictable impacts on seasonal climate in the United States and beyond.


NOAA US Data Tampering Update

by Tony Heller, May 2, 2018 in TheDeplorableClimateScience


Measured US temperatures show cooling over the last 90 years.  This doesn’t suit the needs of the climate mafia, so NOAA massively alters the data to turn cooling into warming.  NOAA cools the past by more than one degree, and warms the present by nearly one degree.  Then other climate scientists use this fake data to confirm fake theories about CO2 emissions warming the planet.

Science Fact: Per NOAA, “Global Warming” Pause For U.S. Now Exceeds 22 Years (Wrong?)

by C3 Headlines, April 2018


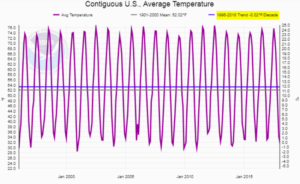
The chart above was produced by NOAA at their ‘Climate at a Glance’ web page. In the upper right corner of the chart, NOAA shows its calculated per decade trend of -0.02°F for a period that spans 1996-2018.

After posting this chart and an accompanying article, it just seemed that something was likely wrong with the trend calculation produced by NOAA’s web site.