by James Cook University and Université Catholique de Louvain, July 3, 2017, in ScienceDaily
Professor Wolanski said the study was subjective to the extent that there was a lack of oceanographic field data in the Great Barrier Reef itself for the 2016 el Nino event. By contrast, the amount of oceanographic field data in the Torres Strait and the northern Coral Sea was very good.
“What we presented is our best-informed attempt to reveal the mechanisms involved in causing the event, based on the available oceanographic data combined with the existing body of knowledge on the water circulation in and around the Torres Strait/Northern Great Barrier Reef region.”
by Ph.D. Roy Spencer, July 4, 2017 in WUWT
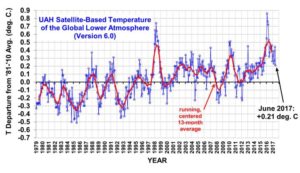
Lowest global temperature anomaly in last 2 years (since July, 2015)
The Version 6.0 global average lower tropospheric temperature (LT) anomaly for June, 2017 was +0.21 deg. C, down from the May, 2017 value of +0.44 deg. C
by Donn Dears, July 2017
Here is a summary of the graph’s salient points:
- The CO2 safe limit for US Navy submarines is 8,000 ppm (Dotted red line)
- The CO2 safe limit for the space station is 5,000 ppm (Dotted blue line)
- A line depicting the gradual doubling of CO2 is near the bottom of the graph
- The minimum atmospheric CO2 requirements to sustain plant growth is 150 ppm (Dotted green line)
In addition, atmospheric CO2 has been as high as 7,000 ppm approximately 550 million years ago, and as high as 2,000 ppm as recently as 150 million years ago. (Also here in French)
What the graph clearly shows is how close mankind came to extinction when atmospheric CO2 levels dropped to 183 ppm during the last ice age.
by Dr David Whitehouse, July 4, 2017 in GWPF
The China Meteorological Administration (CMA) has recently developed a new global monthly land-surface air temperature data set called CMA GLSAT. Using it researchers from the administration reanalysed the change in global annual mean land-surface air temperature during three time periods (1901–2014, 1979–2014 and 1998–2014) to see if there was any evidence of a hiatus or pause in recent surface global warming.
The researchers find very clear evidence for the recent warming hiatus. Their results show linear trends of 0.104 °C per decade, 0.247 °C per decade and 0.098 °C per decade for the three periods, respectively. The trends were statistically significant except for the period 1998–2014, the period that is also known as the ‘‘warming hiatus”.
by Tony Heller, July 4, 2017
Venus is hot because it has an atmospheric pressure almost 100X that of Earth. The same reason why the top of the Grand canyon is cold, and the bottom of the Grand Canyon is hot. Temperatures in Venus troposphere at the elevation where pressure is 1 bar, are similar to earth. Only a complete moron would believe that adding 0.0001 mole fraction CO2 to the atmosphere would cause that.
by David Archibald, July 3, 2017
From a post a couple of days ago: “an F10.7 flux above 100 causes warming and below that level causes cooling.” Greg asked “Can you prove that?” I already had in this WUWT post from 2012. But it is worth revisiting the subject because it answers the big question – If all the energy that stops the Earth from looking like Pluto comes from the Sun, what is the solar activity level that corresponds to our average climate? Because solar activity is falling and climate will follow.
La géologie, une science plus que passionnante … et diverse
