55 New (2019) Scientific Papers Link Solar Activity To Climate Change

by K. Richard, October 3, 2019 in NoTricksZone


In the last few years, hundreds of peer-reviewed scientific papers have been published linking changes in solar activity to Earth’s climate (2016, 2017, 2018). The evidence for a robust Sun-Climate connection continues to accumulate in 2019.

When it comes to the Sun’s influence on climate, one conclusion is certain: there is no widespread scientific agreement as to how and to what extent solar activity and its related parameters (i.e., galactic cosmic rays, geomagnetic activity, solar wind flux) impact changes in the Earth’s temperature and precipitation.

The disagreement is so chasmic and the mechanisms are so poorly understood that scientists’ estimates of the influence of direct solar irradiance forcing between the 17th century and today can range between a negligible +0.1 W m-2 to a very robust +6 W m-2 (Egorova et al., 2018Mazzarella and Scafetta, 2018).

There is no consensus on the amplitude of the historical solar forcingThe estimated magnitude of the total solar irradiance difference between Maunder minimum and present time ranges from 0.1 to 6 W/m2 making uncertain the simulation of the past and future climate.”  (Egorova et al., 2018)
“According to the IPCC (2013), solar forcing is extremely small and cannot induce the estimated 1.0–1.5 °C since the LIA. However, thesolar radiative forcing is quite uncertain because from 1700 to 2000 the proposed historical total solar irradiance reconstructions vary greatly from a minimum of 0.5 W/m2 to a maximum of about 6 W/m2 (cf..: Hoyt and Schatten 1993; Wang et al. 2005; Shapiro et al. 2011). Moreover, it is believed that the sun can influence the climate also via a magnetically induced cosmic ray flux modulation (e.g.: Kirkby 2007) or via heliospheric oscillation related to planetary resonances (e.g.: Scafetta 2013, 2014b; Scafetta et al. 2016, and others). Since solar and climate records correlate quite significantly throughout the Holocene (cf: Kerr 2001; Steinhilber et al. 2012; Scafetta 2012, 20104b), the results shown herein may be quite realistic, although the exact physical mechanisms linking astronomical forcings to climate change are still poorly understood.”  (Mazzarella and Scafetta, 2018)”

Coal to remain ‘King’ in Southeast Asia

by David Middleton, October 4, 2019 in WUWT


‘Coal is still king’ in Southeast Asia even as countries work toward cleaner energy
PUBLISHED MON, SEP 30 2019
Huileng Tan

KEY POINTS

• Not only will coal continue to be the dominant fuel source in power generation in Southeast Asia, its use will grow and peak in 2027 before slowing, according to a Wood Mackenzie study.

• The Indonesian government has targeted generating 23% of electricity from renewable sources by 2025 — almost double the 12% now, but it will be “difficult to achieve because capacity expansion plans are still dominated by coal,” Moody’s analysts say.

• Global coal demand grew for a second straight year to reach 0.7% in 2018, International Energy Agency data shows.

Coal is still a dominant fuel in the rapidly growing economies of Southeast Asia, even amid a general global move toward cleaner energy sources, data from several recent reports show.

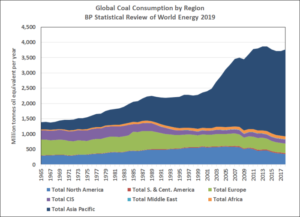
Figure 1. Global coal consumption by region (million tonnes of oil equivalent per year). BP Statistical Review of World Energy 2019.

NEW ZEALAND EXPERIENCES FOURTH COLDEST SEPTEMBER THIS CENTURY

by Cap Allon, October 4, 2019 in Electroverse


New Zealand’s average temperature last month –for the country as a whole– was below the 1981-2010 September avg., Niwa has said in its Monthly Climate Summary.

An unusual warming of the atmosphere high above Antarctica –called a Sudden Stratospheric Warming event (SSW)– assisted in making last month the fourth coldest September in New Zealand this century.

There have only ever been two SSWs recorded in the Southern Hemisphere, previous to this years — one in September 2002 (major) and another in September 2010 (minor).

The 2002 SSW event resulted in New Zealand experiencing a significant cold outbreak in October while the 2010 event was associated with record rainfall during September.

Record Antarctic Stratospheric Warming Causes Sept. 2019 Global Temperature Update Confusion

by Roy Spencer, October 4, 2019 in WUWT


While the vast majority of our monthly global temperature updates are pretty routine, September 2019 is proving to be a unique exception. The bottom line is that there is nothing wrong with the UAH temperatures we originally reported. But what I discovered about last month is pretty unusual.

It all started when our global lower tropospheric (LT) temperature came in at an unexpectedly high +0.61 deg. C above the 1981-2010 average. I say “unexpected” because, as WeatherBell’s Joe Bastardi has pointed out, the global average surface temperature from NOAA’s CFS model had been running about 0.3 C above normal, and our numbers are usually not that different from that model product.

[By way of review, the three basic layers we compute average temperatures from the satellites are, in increasing altitude, the mid-troposphere (MT), tropopause region (TP), and lower stratosphere (LS). From these three deep layer temperatures, we compute the lower tropospheric (LT) product using a linear combination of the three main channels, LT = 1.548MT – 0.538TP +0.01LS.]

Yesterday, John Christy noticed that the Southern Hemisphere was unusually warm in our lower stratosphere (LS) temperature product, while the Northern Hemisphere was unusually cool. This led me to look at the tropical results for our mid-troposphere (MT) and ‘tropopause’ (TP) products, which in the tropics usually track each other. A scatterplot of them revealed September 2019 to be a clear outlier, that is, the TP temperature anomaly was too cool for the MT temperature anomaly.

So, John put a notice on his monthly global temperature update report, and I added a notice to the top of my monthly blog post, that we suspected maybe one of the two satellites we are currently using (NOAA-19 and Metop-B) had problems.

As it turns out, there were no problems with the data. Just an unusual regional weather event that produced an unusual global response.