by Cap Allon, October 3, 2019 in Electroverse
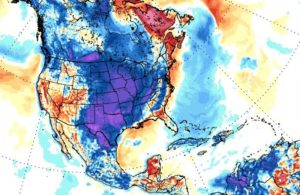
This weekend will mark the final phase of a major winter storm that ravaged the NW U.S. bringing whipping winds to the Flathead Valley, feet of snow along the Continental Divide and record-breaking/challenging temps for all.
A new all-time daily record low temperature was set in Kalispell, Montana on Wednesday, October 02 as the mercury plunged into the teens across the region.
The weather station at Glacier Park International Airport recorded a low of 19F (-7.2C) at 5 AM which busted the dates previous record low of 21F (-6.1C) set back in 1999.
Great Falls, Montana registered a record-smashing 9F (-12.8C) on Tue, Oct 01, according to the NWS, which annihilated the previous daily low of 22F (-5.6C) set back in 1959.
Additionally, areas to the northwest also saw record low daily temperatures on Tuesday as both Cut Bank and Browning comfortably surpassed their previous cold records from 1950.
And further south, crossing a few state lines into California, temperatures at Sacramento Executive Airport dropped to 42F (5.6C) early Wednesday morning, surpassing the old record of 43F (6.1C) set in 1971. Meaning that in less than a week, Sacramento has now set multiple all-time record lows; on Sunday, both downtown Sacramento and the airport set record lows of 45F (7.2C) and 46F (7.8C) respectively.
…
…
by Anthony Watts, October 3, 2019 in WUWT
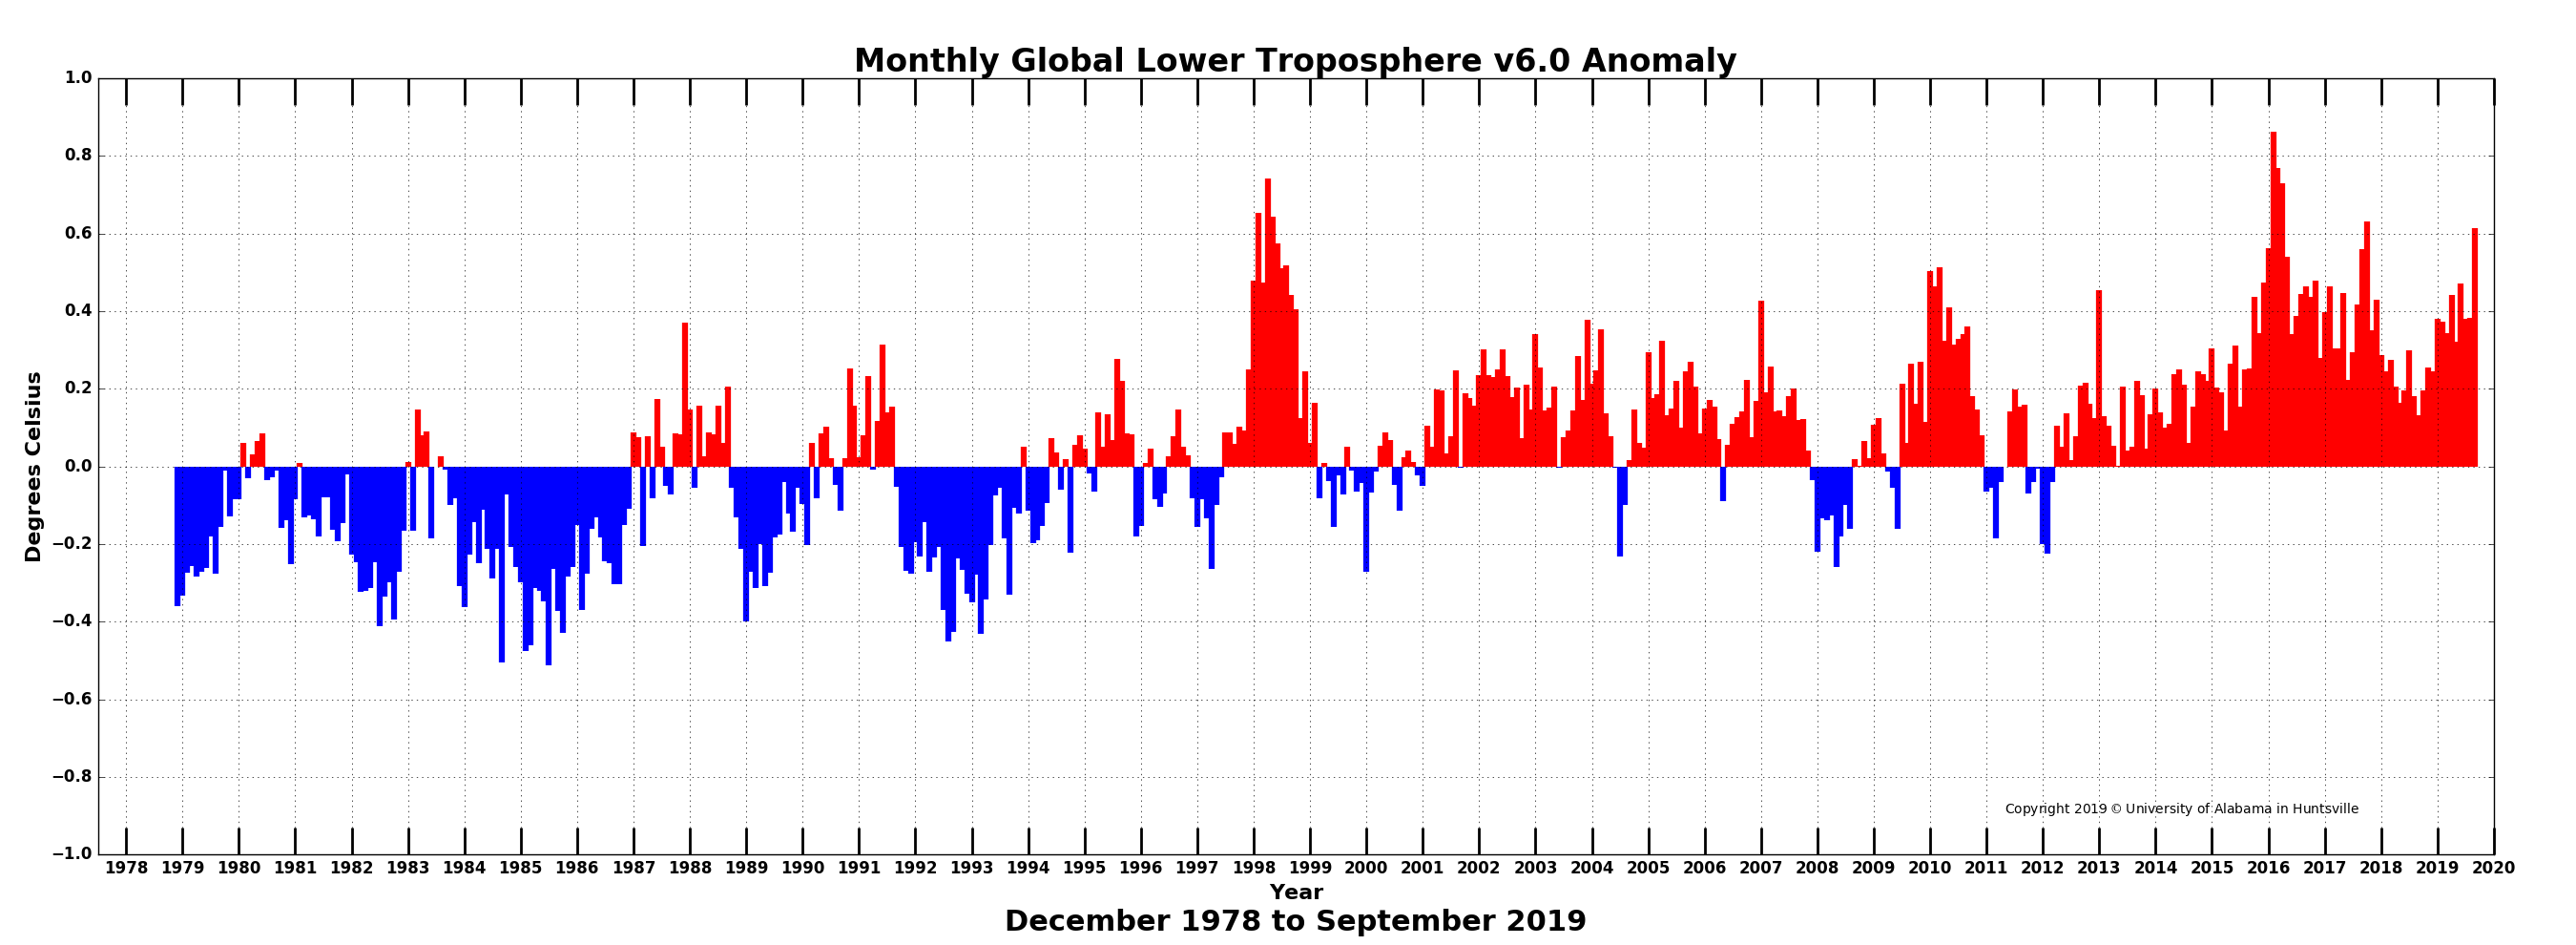
Global climate trend since Dec. 1 1978: +0.13 C per decade
September Temperatures (preliminary)
Global composite temp.: +0.61 C (+1.10 °F) above seasonal average
Northern Hemisphere.: +0.64 C (+1.15 °F) above seasonal average
Southern Hemisphere.: +0.58 C (+1.00°F) above seasonal average
Tropics.: +0.60 C (+1.08°F) above seasonal average
August Temperatures (final)
Global composite temp.: +0.38 C (+0.68 °F) above seasonal average
Northern Hemisphere.: +0.33 C (+0.59 °F) above seasonal average
Southern Hemisphere.: +0.44 C (+0.79°F) above seasonal average
Tropics.: +0.45 C (+0.81 °F) above seasonal average
Notes on data released October 3, 2019 (v6.0)
September’s globally-averaged, bulk-layer atmospheric temperature anomaly of +0.61°C (+1.10°F) represented the warmest September reading of the past 41 Septembers in our satellite record. The jump from August was substantial (+0.23°C) and ranks among the largest month-to-month changes. (Several previous jumps were greater than 0.3°C however.) The warmth was global in extent with warmest September temperatures posted for both hemispheres and the tropical belt. This month-to-month heating is possibly related, at least in part, to the tropical Pacific Ocean’s loss of heat energy to the atmosphere in the recent months as El Niño conditions declined.
…
…
by Alain Préat, 3 octobre 2019 inScienceClimatEnergie
S’il est un livre, et un des premiers, à s’être penché de manière aussi détaillée sur l’évolution (récente) du climat, c’est celui d’Emmanuel Le Roy Ladurie ‘Histoire du climat depuis l’an mil’, publié en 1967.
Rappelons cependant le livre précurseur de Joseph-Jean-Nicolas Fuster publié en 1845 et récemment analysé ici même à SCE (et toujours disponible, voir ici).
1/ Introduction
A lire ou relire ce livre de 366 pages (Figure 1), on ne peut qu’être stupéfié par l’analyse rigoureuse qui met en évidence la variabilité naturelle du climat aux échelles pluriséculaire et décennale, qui décortique et privilégie avec finesse le caractère local du climat par rapport à un climat global et fournit à partir d’indicateurs fiables des fourchettes de températures pour les variations climatiques observées à l’échelle pluriséculaire.

Figure 1. Histoire du climat depuis l’an mil, Flammarion, publié en 1967
Avant d’aborder ce sujet en détail, il semble qu’aucun modèle sorti des ‘computers’ (GIEC) n’ait été jusqu’à présent capable de rendre compte des évolutions rapportées dans le livre d’ Emmanuel Le Roy Ladurie, ces modèles se prétendent ‘globaux’, contrairement à la conclusion du livre en question qui insiste particulièrement sur le caractère local des climats. Enfin il s’agit d’un livre de 366 pages bien illustré (photographies, cartes et graphiques) dans lequel il n’est pas mentionné une seule fois ‘le poison’ des temps modernes, à savoir le CO2. L’auteur, en 1967 (faut-il le rappeler …), propose ou explore quand même des pistes pour rendre compte de la succession d’épisodes ‘froids’ et ‘chauds’, tout au long de ces 1000 années d’histoire, qui en fait débutent il y a 3500 ans (mais pour ces temps historiques plus reculés, les données fiables sont moins nombreuses).
2/ Alors que dit Emmanuel Le Roy Ladurie ?
…
by Roger Pielke, Sep. 30, 2019 in WUWT
I research and write about science, policy and politics.
More than a decade ago, Gwyn Prins and Steve Rayner characterized climate policy as an “auction of promises” in which politicians “vied to outbid each other with proposed emissions targets that were simply not achievable.” For instance, among Democrats competing for the presidency in 2020, several, including Joe Biden, have committed to achieving net-zero carbon dioxide emissions by 2050. Candidate Andrew Yang bid 2049, and Cory Booker topped that by offering 2045. Bernie Sanders has offered a 71% reduction by 2030.
One reason that we see this “auction of promises” is that the targets and timetables for emissions reductions are easy to state but difficult to comprehend. Here I’ll present what net-zero carbon dioxide emissions for 2050 actually means in terms of the rate of deployment of carbon-free energy and the coincident decommissioning of fossil fuel infrastructure.
To conduct this analysis I use the BP Statistical Review of World Energy, which presents data on global and national fossil fuel consumption in units called “million tons of oil equivalent” or mtoe. In 2018 the world consumed 11,743 mtoe in the form of coal, natural gas and petroleum. The combustion of these fossil fuels resulted in 33.7 billion tonnes of carbon dioxide emissions. In order for those emissions to reach net-zero, we will have to replace about 12,000 mtoe of energy consumption expected for 2019. (I ignore so-called negative emissions technologies, which do not presently exist at scale.)
Another useful number to know is that there are 11,051 days left until January 1, 2050. To achieve net-zero carbon dioxide emissions globally by 2050 thus requires the deployment of >1 mtoe of carbon-free energy consumption (~12,000 mtoe/11,051 days) every day, starting tomorrow and continuing for the next 30+ years. Achieving net-zero also requires the corresponding equivalent decommissioning of more than 1 mtoe of energy consumption from fossil fuels every single day.
Another important number to consider is the expected increase in energy consumption in coming decades. The International Energy Agency currently projects that global energy consumption will increase by about 1.25% per year to 2040. That rate of increase in energy consumption would mean that the world will require another ~5,800 mtoe of energy consumption by 2050, or about another 0.5 of an mtoe per day to 2050. That brings the total needed deployment level to achieve net-zero emissions to about 1.6 mtoe per day to 2050.
…
The scale of the challenge to achieve net-zero carbon dioxide emissions in 2050. Roger Pielke Jr., BP 2018
…
La géologie, une science plus que passionnante … et diverse
