by D. Archibald, Feb 2, 2022 in WentwothReport
Reports from the current Northern Hemisphere winter include plenty of low temperature records broken, frozen seas off Greece, etc., suggesting that the world is cooling. A correspondent in Missouri writes:
Nearly 800 chill hours here so far … cold forecast for the next 2 weeks. Will hit 1000 easily. The average when we moved here not quite 20 years ago was 5-600 … for the entire winter. (Chill hours refer to the total amount of time a fruit tree needs to be exposed to cold winter temperatures to allow them break dormancy so they will flower and set fruit normally.)
So that is good news for Missouri — they will now be able to grow things like peaches with a high chill hour requirement for fruiting. Confirmation of colder Northern Hemisphere winters is provided by the snow mass trend by the Finnish Meteorlogical Institute:
…
…
by Gavin, Feb 2, 2020 in RealClimate
We have now updated the model-observations comparison page for the 2021 SAT and MSU TMT datasets. Mostly this is just ‘another dot on the graphs’ but we have made a couple of updates of note. First, we have updated the observational products to their latest versions (i.e. HadCRUT5, NOAA-STAR 4.1 etc.), though we are still using NOAA’s GlobalTemp v5 – the Interim version will be available later this year. Secondly, we have added a comparison of the observations to the new CMIP6 model ensemble.
As we’ve discussed previously, the CMIP6 ensemble contains a dozen models (out of ~50) with climate sensitivities that are outside the CMIP5 range, and beyond the very likely constraints from the observations. This suggests that comparisons to the observations should be weighted in some way. One reasonable option is to follow the work of Tokarska et al (2020) and others, and restrict the comparison to those models that have a transient climate response (TCR) that is consistent with observations. The likely range of TCR is 1.4ºC to 2.2ºC according to IPCC AR6, and so we plot both the mean and 95% spread over all all models (1 ensemble member per model) (grey) and the TCR-screened subset (pink).
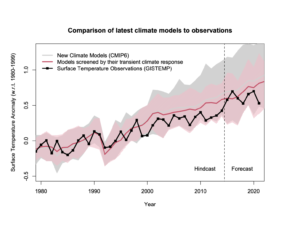
CMIP6 model means and spreads since 1979 (reader friendly version).
….
…
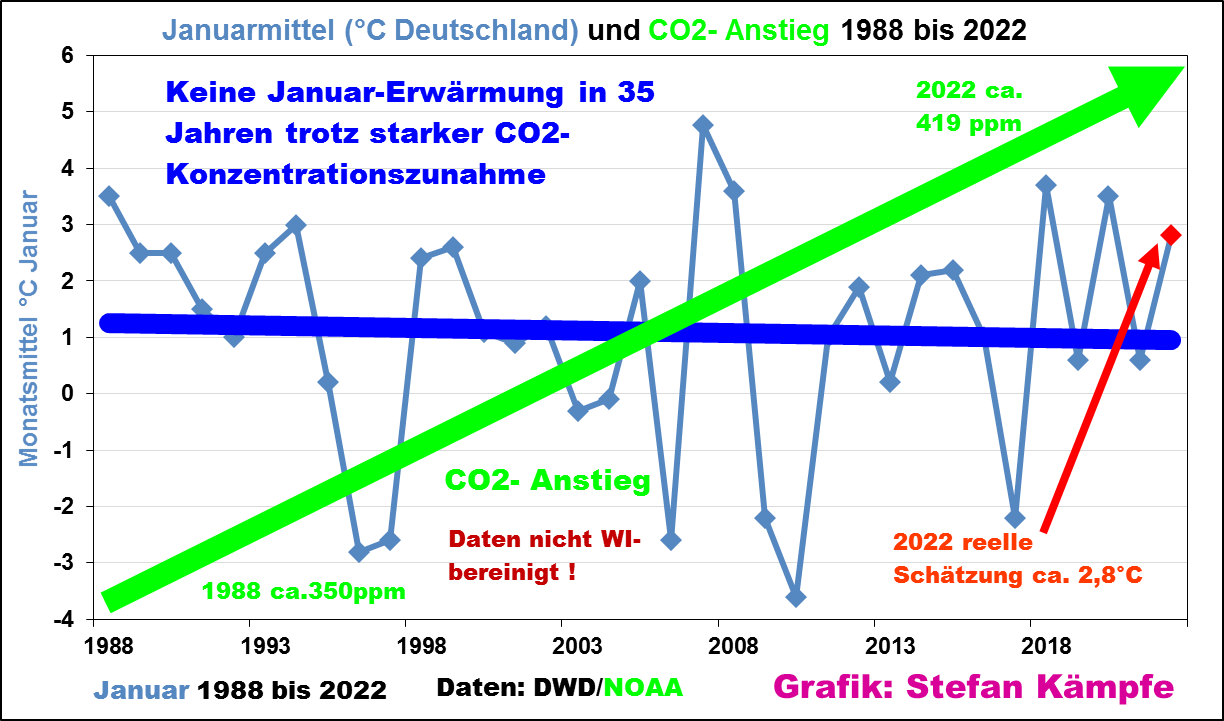
by NoTricksZone, Feb 2, 2022 in WUWT
According to the media and climate alarmists, winters like we used to have in the global cooling days of the 1970s were supposed to be disappearing due to increasing warming from rising CO2.
But that hasn’t really been happening. For example, Stefan Kämpfe at the European Institute for Climate and Energy (EIKE) plotted Germany’s mean January temperature going back to 1988:
…
by Mining.com Staff Writer, Jan 28, 2022, in TheNorthernMinerMaps
In a paper published in the journal Geology, the scientists explain that over geological times, variations in atmospheric CO2 depended mainly on volcanic emissions, which are difficult to estimate because they are not directly related to the volume of the magmas that erupted. Indeed, some volcanoes show exceptionally large emissions of CO2 when compared to the amount that can be dissolved in their magmas. Etna is perhaps the most striking example, contributing to 10% (9000 tons/day) of the present global volcanic CO2 emission. That is three times more CO2 than a volcano like Kilauea in Hawaii emits, which erupts four times more magma.
But ratios of Nb/Ta are very constant in many rocks and are only modified by few geological processes—like the infiltration of carbonate-rich melts in earth’s mantle.
…
La géologie, une science plus que passionnante … et diverse
