No, Met Office–A Dry July Does Not Mean Climate Change.

by P. Homewood, July 30, 2022 in NotaLotofPeopleKnowThat


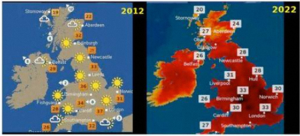
So far July 2022 has been the driest July in England since 1911. Up to 26 July there has been only 15.8mm of rain averaged across England; this is only 24% of the amount we would expect in an average July.

At this stage in the month we would expect to have seen well over three-quarters of the month’s rain to have already fallen in an average July.

The situation for the UK is a little better. As it stands, July 2022 is still the eighth driest July since 1836. With only 37.7mm of rain having fallen so far it is the driest July since 1984. Scotland has been closer to average in the north and west, but drier conditions have prevailed for south and east Scotland. Overall Scotland (71%), Wales (39%) and Northern Ireland (43%) have been dry, but the most extreme conditions are in East Anglia and southeast England.

Mark McCarthy, Head of the Met Office National Climate Information Centre, said: “It is not just July that has been dry. Since the start of the year, all months apart from February have been drier than average in the UK too. The result of this is that the winter, spring and summer of 2022 have all seen less than the UK average seasonal rainfall. 

“England has seen the lowest levels during these periods and, rainfall totals for the first six months of the year are around 25% below their long-term average, with the driest regions in the east and southeast.

Germany’s Alfred Wegener Institute Sees No Extreme Situation With Arctic Sea Ice

by P. Gosselin, July 22, 2022 in NoTricksZone


The Alfred Wegner Institute does not see an extreme situation with sea ice in the Arctic (June 2022). The institute’s page states:

The Alfred Wegener Institute Helmholtz Centre for Polar and Marine Research (AWI) is participating again this year with the AWI Consortium Model, a dynamic coupled sea ice ocean model, and calculated a September sea ice extent of 4.75 million square kilometers in its June forecast. This value is about 4% above the median value of all submitted models but in the middle of the predictions given for dynamic models.

Dr. Frank Kauker, a physicist in the Sea Ice Physics Section at AWI, assesses the first prediction as follows: “The first forecast of a year from the beginning of June is usually still characterized by a rather large uncertainty (this year 0.43 million square kilometers). Nevertheless, at the moment there is nothing to indicate an extreme situation in September.

The ice cover in September will be with a great probability in the range of the last years, i.e. between 4 and 5 million square kilometers. The next forecast in early July will reduce the uncertainty somewhat, as it will become clear in June how many melt ponds will have formed, which will then decisively determine the melt rates of the ice during the rest of the year due to their lower solar irradiance return.”

New Study: 96% Of U.S. Climate Data Is Corrupted

by Heartland Institute, July 28, 2022  in ClimaterChangeDispatch


A new study, Corrupted Climate Stations: The Official U.S. Surface Temperature Record Remains Fatally Flawed, finds approximately 96 percent of U.S. temperature stations used to measure climate change fail to meet what the National Oceanic and Atmospheric Administration (NOAA) considers to be “acceptable” and uncorrupted placement by its own published standards. [bold, links added]

The report, published by The Heartland Institute, was compiled via satellite and in-person survey visits to NOAA weather stations that contribute to the “official” land temperature data in the United States.

The research shows that 96% of these stations are corrupted by localized effects of urbanization – producing heat bias because of their close proximity to asphalt, machinery, and other heat-producing, heat-trapping, or heat-accentuating objects.

Placing temperature stations in such locations violates NOAA’s own published standards (see section 3.1 at this link) and strongly undermines the legitimacy and the magnitude of the official consensus on long-term climate warming trends in the United States.

“With a 96 percent warm bias in U.S. temperature measurements, it is impossible to use any statistical methods to derive an accurate climate trend for the U.S.,” said Heartland Institute Senior Fellow Anthony Watts, the director of the study.

How Eco-Activists And Lawsuits Are Worsening Wildfires

by J. Wood, July 27, 2022 in Climate ChangeDispatch


With more than three million acres already burned or burning, 2022 is shaping up to be another devastating year for wildfires in the U.S.

America’s forests need to be managed more actively, a task the Biden administration took up earlier this year when it announced a 10-year strategy to reduce excess fire fuels, like downed trees and underbrush, on up to 20 million acres of national forest and 30 million acres of other lands. [bold, links added]

This plan is a step in the right direction, but it’s unlikely to come to fruition if the administration doesn’t first tackle two major obstacles to forest restoration: environmental red tape and litigation.

Projects to clear out fire fuel often face substantial delays. New research from the think tank where I work, the Property and Environment Research Center, found that it takes an average of 3.6 years for efforts to clear downed, unhealthy, and too densely grown trees to move from the required environmental review to on-the-ground work.

For prescribed burns, the delay is even longer, 4.7 years. And these are the averages. Many urgently needed projects take much longer.

While many bureaucratic, technical, and fiscal obstacles affect these delays, red tape and lawsuits are substantial contributors.

Little evidence of changes in extreme weather trends

by P. Homewood, July 27, 2022 in NotaLotofPeopleKnowThat


New IPCC attribution statistics are distorting observational evidence

London, 27 July – A new paper from the Global Warming Policy Foundation finds that the IPCC’s recent shift in methodology has led to misleading claims about changes in weather extremes.

The review, from physicist Dr Ralph Alexander, finds that IPCC claims that many of these weather extremes are increasing significantly are largely unsupported by observational evidence.

Ralph Alexander: Extreme Weather: The IPCC’s Changing Tune (pdf)

According to Dr Alexander:
“On almost every kind of extreme weather, with the possible exemption of heatwaves, the evidence for significant changes is scant. But the latest IPCC report has introduced novel ‘attribution’ statistics and now insists that things are getting worse. It’s yet another case of scientists trying to scare the public into compliance.”

Dr Alexander’s paper looks at:
– droughts
– floods
– hurricanes
– tornadoes
– wildfires
– hot and cold extremes
– coral bleaching.

He concludes that:
“The mistaken belief that weather extremes are worsening because of climate change is more a perception, fostered by media coverage, than reality. The IPCC’s new statistical method is playing an unworthy part in bringing this sorry state of affairs to pass.”

GWPF invited the Royal Society and the Met Office to review this paper, and to submit a response to be published as an appendix to it. No reply was received.

BBC Exaggerate Drought Claims

by P. Homewood, July 27, 2022 in NotaLotofPeopleKnowThat


To compare this year with 1976 is really quite mendacious, as the latter was much, much drier. And as the BBC’s own chart shows, there have been eight other years since then with similar rainfall levels to this year. Indeed, in England, as opposed to England & Wales, both 1996 and 2010 had drier starts to the year).

In other words, this year is not an exceptional event, merely something you expect to see every few years or so.

And if you go back through the full Met Office record to 1836, we can see again that there is nothing at all unusual about this year.( Indeed, all of the really dry years occurred in 1976 and before:


See also : Driest Start Since 1976? No, 2010 Was Drier

Climatologists Embarrassed: Increase In Global CO2 Levels Accompanied By Arctic Sea Ice Growth!

by P. Gosselin, July 26, 2022 in NoTricksZone


Today we look at the polar ice caps, which the global warming wingnuts claim is the canary in the coal mine and predicted earlier they’d melt and collapse. For example, Al Gore warned the Arctic ice would disappear by 2014.

While CO2 has gone up, Arctic sea ice has RISEN over past decade

But we have a big surprise. First we examine the Arctic sea ice extent so far this summer. Has it melted away like Al Gore said it would?

Antarctica continues long-term upward sea ice trend

Looking at Antarctica sea ice, we also see a zero-crisis trend when plotting the data from the Japan Meteorological Agency (JMA):

David Attenborough gets a namesake: the oldest known relative of living animals

by T. Joose,  July 25, 2022, in Science


If you visited the oceans more than 500 million years ago, you’d find yourself in an alien world. Beings with quilted folds of soft tissue sat on the seabed like rugs, and life forms that looked like fronded plants but were actually animals made anchor on the ocean floor. But one organism might be somewhat familiar: a stalked, cuplike creature with waving tentacles resembling those of a jellyfish. The newly described fossil of this organism, named Auroralumina attenboroughiiafter naturalist and broadcaster David Attenborough, is between 556 million and 562 million years old and may be the oldest example of an evolutionary group still living today.

When co-author and University of Oxford paleobiologist Frances Dunn saw a cast of the fossil, she says, “It was instantly clear that this was really special and really rare.” With other fossils from the Ediacaran period, between 635 million and 541 million years ago, her first impression often is “What is this? How can I relate this to anything that’s alive today?” But with this specimen, she thought, “I know what this is.”

Classical scientific wisdom places the origin of modern animals about 539 million years ago during what’s called the Cambrian explosion. At this time, creatures with specialized tissues, organs, guts, and symmetrical left and right sides—all traits we recognize in the animals of today—began popping up.

Get Ready For The 100 Year Long Climate “Emergency”

by F. Menton, July 22, 2022 in MahattanContrarian


Here’s the problem. There is no sense in which the climate is an “emergency” within the ordinary meaning of that word in the English language. Predictions by climate models of a few degrees of temperature rise over the next century are the opposite of an “emergency.” Indeed, the statutes granting various “emergency” powers to the Executive all deal with the question of time periods too short to give the Congress time to enact legislation appropriate to the situation at hand. That circumstance is the opposite of what we have with the climate.

But if you are on the left, or a climate activist, this situation is just too important to wait for Congressional action that may never come. An “emergency” must be declared, to last for — how long? A hundred years? During which time, the bureaucrats can issue whatever orders they want, and spend whatever funds they want, all in the name of saving the planet. None of which will or can have any effect on the 85% (and growing) of world carbon emissions that come from outside the U.S. and which the U.S. government cannot affect in any way.

It’s all a huge insult to the intelligence of the American people. I doubt that the courts will be fooled, most particularly the Supreme Court.

A Tropical Plant’s Warmth Threshold Affirms Mid-Holocene Temps Were ‘7.7°C Higher Than Today’

by K. Richard, July 25, 2022 in NoTricksZone


A warmth-demanding plant can provide us with solid evidence of a much warmer than today Mid-Holocene climate.

Growth of the tropical aquatic plant ceases when air temperatures fall below 10°C.

A new study says that from about 8000 to 5000 years ago it was warm enough in winter that could grow at the 40°N latitude in northern China. Today its warmth threshold growth limit is ~34°N.

Scientists can therefore deduce the Mid-Holocene winter temperatures needed to have been “7.7°C higher than today” at that time.

….

The IPCC And The Infamous Hockey Stick Graph

by CCD Editor, July 25,2022 in ClimateChangeDispatch


Ron Barmby, author of  “Sunlight on Climate Change: A Heretic’s Guide to Global Climate Hysteria” (AmazonBarnes & Noble) spoke with Mike Ryan of TNT Radio (TNT Radio (podbean.com) about what he uncovered in the recent IPCC report, Climate Change 2021: The Physical Sciences Basis.

Ron’s findings: after being made famous by Al Gore and adopted by the IPCC, then being made infamous by its historical and statistical failings and subsequently dropped by the IPCC, the hockey stick temperature graph is back!

And a new narrative is being introduced that carbon dioxide has been demoted to causing only half of human global warming to date.

Mike discusses with Ron the four things wrong, and often in conflict with, the report itself with the latest doomsday science from the IPCC. LISTEN:

LARGEST SUMMER SEA ICE EXTENT SINCE 2008 TRAPS ARCTIC SHIPS; + COLDEST JULY AIRMASS IN 70 YEARS BLOWS THROUGH THE BERING STRAIT

by Cap Allon, July 19, 2022 in Electroverse


The mainstream are heat-chasers. They report only on stories that fit the AGW Party agenda. This cherry-picking leads to a painfully misinformed public when it comes to the climate–which is exactly where they want us.

It usually stands, however, that if the MSM goes silent on a particular locale then it’s probably because that particular locale isn’t ‘behaving’ as they would like.

ase in point today: we have the Arctic and Greenland refusing to play ball.

Earth’s most-northern reaches are actually experiencing persistent and long-lasting COOLING, which is far more telling than a brief burst of heat in, for example, Western Europe, which, 1) is forecast to be over before it’s even really begun, and 2) can be tied to entirely natural forcings–namely low solar activity and a violently ‘buckling’ jet stream flow (more on that below).

UK heatwave: How do temperatures compare with 1976?

by P. Homewood, July 24, 2022 in NotaLotofPeopleKnowThat


People on social media have been comparing the high temperatures in much of the UK with the heatwave of 1976, suggesting that the severity of the current hot weather is being exaggerated.

So, what does the evidence show?

How hot was the summer of 1976?

The peak that year was 35.9C. That has been beaten by the current temperatures, with 40.3C recorded so far.

The heatwave of 1976 started in June and lasted for two months. There was a lack of rainfall and a significant drought, with the government enforcing water rationing.

The heatwave was rare for that decade. The average maximum temperature in July in the 1970s was 18.7C. In the 2010s, it was more than 20C.

The European Heat Wave and Global Warming

by Guest Blogger, July 21, 2022 in WUWT


From the Cliff Mass Weather Blog

There is a lot of talk about the short-term European heatwave with some suggesting that the record-breaking warmth is the result of climate change/global warming.

Some of the media and climate advocates have been over the top in their claims (see below), stating that this event was the result of human-caused global warming.

Global Warming Has Stalled Over Much Of The Last 10 Years, Arctic Never Melted Away

by P. Gosselin, July, 22, 2022 in NoTrickZone


The globe hasn’t been warming and the Arctic hasn’t been melting much for almost a decade now.

Recall the climate crisis loonies warned us some 20 years ago the Arctic sea ice would disappear by the summer of 2014. Well it’s still very much there, as Joe Bastardi reminds us at his most recent Saturday Summary:

No warming in 8 years

Moreover, UAH global mean temperature anomaly hasn’t risen in eight years as well, Hat-tip Snowfan here:

….

Was It Hotter In 1911?

by P. Homewood, July 23, 2022 in NotaLotofPeopleKnowThat


There has inevitably been a lot of apoplectic reporting about this week’s heatwave in Britain. Everybody from the BBC to the Met Office have been blaming it on climate change, with suitably scary colours to ram the message home:

Comparison of TV weather Maps from the BBC in summer 2012, left, and summer 2022 right. Source: BBC

Courtesy of Climate Realism

But so far I have not seen an objective analysis.

So let’s start with a few simple facts:

1) It was extremely hot for a couple of days this week.

2) The heat was the result of an extremely unlikely set of meteorological conditions – a perfect storm, if you like.

We know this because the Met Office told us so. On July 8th, they announced the possibility of a heatwave a week later. The weather model runs produced a wide band of possibilities, with most predicting similar temperatures to the weekend before, and some even forecasting no heatwave at all. At that stage on a couple of models out of the hundreds run predicted 40C temperatures, which were described by the BBC as “a very tiny possibility”.


Climate Monitoring Since The Little Ice Age

by P. Homewood, July 19, 2022 in NotaLotofPeopleKnowThat


Meanwhile the jokers at the Met Office don’t seem to have realised that their temperature records begin at the depth of the Little Ice Age, or appear to have heard about Urban Heat Islands

It is mid July 2022. We are currently experiencing a significant – at the time of writing provisionally record-breaking – heatwave for the UK. Red weather warnings for extreme heat are in force for large parts of England and forecasts indicated a real possibility of temperatures reaching up to 40°C in some areas. Indeed, this temperature has already been exceeded. Whether or not records are broken, a key part of the work that we do at the Met Office is climate monitoring, an important aspect of which is the ability to put current weather into historical context. Climate monitoring serves many functions: It can effectively communicate the relative severity of an event; it can indicate how frequently such extremes are likely to occur; and it can monitor how the character or frequency of extremes are changing over time. In order to properly understand the risks from climate change, a key research question climate monitoring can help us to answer is, ‘What are the current weather and climate hazards, risks and impacts that should be expected in the UK and globally?’. To address this question, we must look to the past, and the scientific effort goes back further than you might think.

Making history

In 1663, Robert Hooke stood before the relatively newly formed Royal Society and proposed ‘A method for making the history of the weather’. Hooke and other notable scientists of the time were actively developing instruments capable of making meteorological measurements of wind, rain, air pressure, humidity and temperature. These were the early anemometers, rain gauges, barometers and thermometers of the time1. In his paper, Hooke recommended what should be measured and how it should be recorded, including ‘a scheme at one view representing to the eye the observations of the weather for a month’ and implored his colleagues to undertake such measurements. From a modern climatologist’s point of view, arguably one of the most important advances by Hooke was his recognition that if systematic and consistent measurements were made across the country, or even across the world, then an international perspective on the weather could be obtained, for the benefit of humankind. 

The Two Degree Limit

by Andy May, July 19, 2022 in WUWT


For decades We have been told that we must not let global warming exceed two degrees Celsius above the “pre-industrial” global average temperature. Recently the IPCC lowered this limit to 1.5°C. In the latest IPCC report, called AR6, pre-industrial is defined as before 1750, but they use global temperatures from 1850-1900 as representative of the period because global average surface temperatures are not available for 1750.[1] The U.S., Europe, and much of Asia were industrialized by 1900, so their numbers are clearly not representative of the period of interest, unless temperatures remained constant from 1750 to 1900, which is unlikely.

Why the focus on 2°? In a 2014 comment in Nature, David Victor and Charles Kennel tell us that there is little scientific basis for the 2°C figure, but it was a simple focal point and it “sounded bold and perhaps feasible.” (Victor & Kennel, 2014). Then they admit the goal is “effectively unachievable.”

What is the “pre-industrial?” Did it have an ideal climate that we wish to return to? The year 1750 was in the coldest and most miserable part of the Little Ice Age (LIA). The LIA was the coldest period in the Holocene Epoch, or since the last glacial period ended about 12,000 years ago, at least in much of the Northern Hemisphere.

The heatwave green hysteria is out of control

by P. Homewood, July 18, 2022 in NotaLotofPdeopleKnowThat


If you find yourself wondering over the next few days why it is so swelteringly hot, I have an answer for you. It’s because of rich people. It’s because of those wealthy elites with all their gas-guzzling vehicles and reckless holidaymaking. It’s their fault you’re sweating on the Tube.
This infantile claim really is being made, and by supposedly serious politicians. Labour’s Richard Burgon, over on his Instagram account, is wringing his no doubt sweaty hands over the filthy rich folk who apparently landed us in this weather apocalypse.
‘As we face 40C temperatures and the first ever Red Extreme Heat Warning, remember this climate crisis is driven by the wealthy’, he cries. His stern words are accompanied, naturally, by that Met Office map showing half of Britain coloured dark red – the hellish hue that has been chosen to illustrate how dire our predicament has allegedly become.
Is anyone else tiring of all this green hysteria over the heatwave? There is something medieval about it. There is something creepily pre-modern in the idea that sinful mankind has brought heat and fire and floods upon himself with his wicked, hubristic behaviour. What next – plagues of locusts as a punishment for our failure to recycle?

Updated Atmospheric CO2 Concentration Forecast Through 2050 and Beyond

by R. Spencer, July 18, 2022 in WUWT


Summary

The simple CO2 budget model I introduced in 2019 is updated with the latest Mauna Loa measurements of atmospheric CO2 and with new Energy Information Administration estimates of global CO2 emissions through 2050. The model suggests that atmospheric CO2 will barely double pre-industrial levels by 2100, with a total radiative forcing of the climate system well below the most extreme scenario (RCP8.5) used in alarmist literature (and the U.S. national climate assessment), with the closest match to RCP4.5. The model also clearly show the CO2 reducing effect of the Mt. Pinatubo eruption of 1991.

Greenhouse gas CO2 , should not be feared.

by Dr ir. F. van den Beemt, March 15, 2022 in ScienceTalks


The 2021 UN Climate Change Conference, COP 26, resulted in several countries making statements that they would aim to reduce their emissions of greenhouse gases, particularly CO2, based on the fear that these gases are warming the Earth dangerously by what they call the greenhouse effect. But fear is a bad counselor. Understanding the matter reduces anxiety. The purpose of this article is to inform a broad audience about the greenhouse gas CO2 without going into scientific detail, for the latter see [1].

The Earth Thermostat: ensuring a livable temperature on Earth.

The sun heats the Earth with mostly visible light. Our water planet, the Earth, cools down by invisible heat radiation to space. The Earth’s surface, the oceans, and the atmosphere store heat to varying degrees. Wind- and water flows distribute heat all over the Earth. The evaporation process of water transmits energy from the surface into the air. Warm air rises until it cools and forms clouds. Clouds reflect incoming sunlight back to space that otherwise would have warmed the Earth’s surface. Clouds emit heat radiation to space and also some back to the Earth’s surface. These and many more heat transport processes act together as a planet-wide thermostat to create the livable temperature on Earth that we enjoy today.

The terrestrial thermostat knows no rest.

If the Earth’s surface warms up for any reason, this thermostat acts until a new equilibrium is reached. This equilibrium is never static, however, it fluctuates because the wind, convection, precipitation, and all the other dynamic natural processes continually adjust. The atmosphere shows dynamic, cyclic and chaotic characteristics.


Figure 1 ( copied from Figure 10 in [2]): Effects of changing concentrations of  CO2 on the filtered spectral flux at the mesopause altitude of 86 km. The smooth blue line is the spectral flux, from a surface at the temperature of 288.7 K for a transparent atmosphere with no greenhouse gases. The green line is with the CO2 removed but with all the other greenhouse gases at their standard concentrations. The black line is with all greenhouse gases at their standard concentrations. The red line is for twice the standard concentration of CO2 but with all the other greenhouse gases at their standard concentrations. Doubling the standard concentration of CO2 (from 400 to 800 ppm) would only cause a forcing increase (the area between the black and red lines) of 3.0 W m−2.

Above clouds, the water vapor concentration decreases where CO2 concentration stays nearly constant. Within the upper troposphere and the stratosphere, the CO2-specific part of the emission by clouds and water vapor will be again absorbed but now mainly by CO2. Within the thin stratosphere, CO2 emits to space as our satellites detect.

Heat emission to space at top of the atmosphere

Think it’s hot now? How Britain roasted in TEN-WEEK heatwave during summer of ’76

by P. Homewood, Jul 15, 2022 in NotaLotofPeopleKnowThat


Wildfires have raged, speed restrictions have been imposed on some railway lines and hospitals have already declared ‘critical incidents’.

The hot weather in Britain this summer is set to peak next week, when the mercury could top 39C (102F) in London.

The current non-stop sunshine has evoked memories of the summer of 1976, when there were 15 consecutive days that saw temperatures of 89.6F (32C) somewhere in the UK.

Overall, there were ten weeks of blazing heat that saw widespread drought, mass standpipe use, and even the pausing of the murder trial of the notorious ‘Black Panther’, after a woman suffering from ‘heat exhaustion’ collapsed.

During a First Division football match between Manchester City and Aston Villa, City player collectively lost four stone in weight, prompting the team’s captain to call for an end to ‘summer soccer’.

At that year’s Wimbledon tennis championships, umpires were allowed to remove their jackets for the first time in living memory, whilst major roads were littered with broken-down cars that had overheated.

The extreme weather also caused an increase in the number of 999 callouts to domestic disturbances, as tempers buckled due to the heat.

The summer of 1976 was caused in part by very hot air that had originated in the Mediterranean. The warm weather and lack of rain began on June 23 and did not abate for more than a month.

The highest temperature recorded in the summer was on July 3, when the mercury hit 96.6F (35.9C) in Cheltenham. The average maximum daily temperature was 67.8F (19.9C).

“97% Consensus” — What Consensus?

by G. Wrightstone, Oct 28, 2021 in CO2Coalition


You have likely heard that 97% of scientists agree on human-driven climate change. You may also have heard that those who don’t buy into the climate-apocalypse mantra are science-deniers. The truth is that a whole lot more than 3% of scientists are skeptical of the party line on climate. A whole lot more.

The many scientists, engineers and energy experts that comprise the CO2 Coalition are often asked something along the lines of: “So you believe in climate change, then?” Our answer? “Yes, of course we do: it has been happening for hundreds of millions of years.” It is important to ask the right questions. The question is not, “Is climate change happening?” The real question of serious importance is, “Is climate change now driven primarily by human actions? That question should be followed up by “is our changing climate beneficial or harmful to ecosystems and humanity?”

There are some scientific truths that are quantifiable and easily proven, and with which, I am confident, at least 97% of scientists agree. Here are two:

  1. Carbon dioxide concentration has been increasing in recent years.

  2. Temperatures, as measured by thermometers and satellites, have been generally increasing in fits and starts for more than 150 years.

What is impossible to quantify is the actual percentage of warming that is attributable to increased anthropogenic (human-caused) CO2. There is no scientific evidence or method that can determine how much of the warming we’ve had since 1900 that was directly caused by us.

We know that temperature has varied greatly over the millennia. We also know that for virtually all of that time, global warming and cooling were driven entirely by natural forces, which did not cease to operate at the beginning of the 20th century.

The claim that most modern warming is attributable to human activities is scientifically insupportable. The truth is that we do not know. We need to be able to separate what we do know from that which is only conjecture.

What is the basis for the “97% consensus” notion? Is it true? 

Hint: You can’t spell consensus without “con.”

If, indeed, 97% of all scientists truly believed that human activities were causing the moderate warming that we have seen in the last 150 years, it would be reasonable for one to consider this when determining what to believe. One would be wrong, however.

Science, unlike religion, is not a belief system. Scientists, just like anyone else, will say that they believe things (whether they believe them or not) for social convenience, political expediency or financial profit. For this and other good reasons, science is not founded upon the beliefs of scientists. It is a disciplined method of inquiry, by which scientists apply pre-existing theory to observation and measurement, so as to develop or to reject a theory, so that they can unravel as clearly and as certainly as possible the distinction between what the Greek philosopher Anaximander called “that which is and that which is not.”

Declining tropical cyclone frequency under global warming

by S. Chand et al., Jun 27, 2022 in Nature


Abstract

Assessing the role of anthropogenic warming from temporally inhomogeneous historical data in the presence of large natural variability is difficult and has caused conflicting conclusions on detection and attribution of tropical cyclone (TC) trends. Here, using a reconstructed long-term proxy of annual TC numbers together with high-resolution climate model experiments, we show robust declining trends in the annual number of TCs at global and regional scales during the twentieth century. The Twentieth Century Reanalysis (20CR) dataset is used for reconstruction because, compared with other reanalyses, it assimilates only sea-level pressure fields rather than utilize all available observations in the troposphere, making it less sensitive to temporal inhomogeneities in the observations. It can also capture TC signatures from the pre-satellite era reasonably well. The declining trends found are consistent with the twentieth century weakening of the Hadley and Walker circulations, which make conditions for TC formation less favourable.