Scientists announced today that a core drilled in Antarctica has yielded 2.7-million-year-old ice, an astonishing find 1.7 million years older than the previous record-holder
(…)
If the new result holds up, says Yige Zhang, a paleoclimatologist at Texas A&M University in College Station, the proxies will need to be recalibrated. “We have some work to do.”
Future Global Warming Scenarios ‘Potentially Beneficial’, Cooling May Cause Ecological ‘Declines’ / Human Health Risks ‘Extremely Sensitive’ To Temperature, With Cold Temperatures More Dangerous/Mass Extinctions Caused By Cold Temperatures (Ice Ages), Not Global Warming/ …
by Paul Matthews, August 13, 2017 in CimateScepticism
In many ways, the climate debate has hardly changed since I got interested in it about ten years ago. Public opinion wobbles up and down with hardly any real change. The same tired arguments and claims come round again: every climate conference is the last chance to save the planet; the Arctic ice is always about to vanish in one or two years, or ten years; climate scientists continue to be accused of selecting data sets to create hockeysticks and manipulating data; and teams of climate scientists keep producing reports saying almost exactly the same thing as the previous reports, which then get misrepresented and hyped by the media.
In this study we investigate statistical link between external climate forcings and modes of ocean variability on inter-annual (3-year) to centennial (100-year) timescales using de-trended semi-partial-cross-correlation analysis technique. To investigate this link we employ observations (AD 1854–1999), climate proxies (AD 1600–1999), and coupled Atmosphere-Ocean-Chemistry Climate Model simulations with SOCOL-MPIOM (AD 1600–1999). We find robust statistical evidence that Atlantic multi-decadal oscillation (AMO) has intrinsic positive correlation with solar activity in all datasets employed. The strength of the relationship between AMO and solar activity is modulated by volcanic eruptions and complex interaction among modes of ocean variability.
Agricultural and wetland emissions” from the planet’s tropical areas, not oil and gas activities in the United States, are more than likely responsible for a post-2007 global increase in methane levels, according to the National Oceanic and Atmospheric Administration’s Climate.gov.
“Deficiencies in the accuracy, quality and continuity of the records,” that “place serious limitations on the confidence that can be placed in the research results.”
The people who reached these conclusions and their affiliations at the time follows.
by Kenneth Richard, August 7, 2017 in NoTricksZone reposted Paul Homewood
In recent months, two new papers published in The Cryosphere have provided a condensed summary of the ice-melt and sea-level-rise consequences of global warming for the Arctic region.
1. Between 1900 and 2010, the Greenland Ice Sheet (GIS) has melted so extensively and so rapidly that the GIS ice-melt contribution to global sea level rise has amounted to 1.5 centimeters for the entire 110-year period. One-and-a-half centimeters. That’s 0.59 of an inch!
2. It gets worse. Between 1993 and 2010, the contribution to global sea level rise has been a disturbing 0.39 of a centimeter. Almost 4/10ths of a centimeter. That’s 0.15 of an inch!
The world is presently in an era of unusually low weather disasters. This holds for the weather phenomena that have historically caused the most damage: tropical cyclones, floods, tornadoes and drought. Given how weather events have become politicized in debates over climate change, some find this hard to believe. Fortunately, government and IPCC (Intergovernmental Panel on Climate Change) analyses allow such claims to be adjudicated based on science, and not politics. Here I briefly summarize recent relevant data.
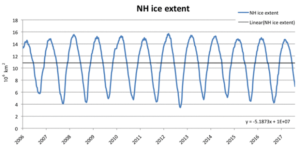
In sharp contrast with previous decades, the past 10 years have seen no change in Northern Hemisphere average sea ice extent, according to MASIE (may-zee, Multi-sensor Analyzed Sea Ice Extent) database from the National Sea & Ice Data Center (NSIDC; see figure 1).
I mentioned in my previous post that the latest draft climate report, published in June, had seemingly left out a rather embarrassing table from the Executive Summary, one that had previously been written into the Third Draft, published last December.
As the link to the Third Draft had disappeared from the NYT, I could not show it.
However, Michael Bastasch, writing over at WUWT, did have the link, so we can now compare the relevant sections.
The report was completed this year and is a special science section of the National Climate Assessment, which is congressionally mandated every four years. The National Academy of Sciences has signed off on the draft report, and the authors are awaiting permission from the Trump administration to release it.
NYT Admits Its Front Page Climate Change Article Was Wrong, seehere
‘Pre-determined science’ Morano reacts to NYT’s ‘leaked’ federal climate doom report: ‘Political report masquerading as science’, see here
The Bray cycle is about 2450 years from beginning to end and the Bray Lows, which are the coldest portion of the cycle, are the most important events.
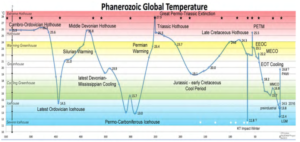
The world is currently within the Quaternary Ice Age and nearly as cold as it has ever been. The normal average temperature of the world is around 20°C, some 5°C warmer than today. To keep recent warming in perspective, it is important to understand that even if the worse predictions of the IPCC were to occur, we would only be returning to the average temperature of the last 560 million years
Prof. Quansheng Ge and his group from the Institute of Geographic Sciences and Natural Resources Research, Chinese Academy of Sciences, collected a large number of proxies and reconstructed a 2000-year temperature series in China with a 10-year resolution, enabling them to quantitatively reveal the characteristics of temperature change in China over a common era.
So… If climate change caused the Vikings to turn their plowshares into swords, abandoning their farms to become terrorists… the climate change would have been of the warming variety. I’m not a farmer, but it seems to me that global warming would have actually enhanced the Vikings’ ability to farm up around the Arctic Circle.
by JoNova, August 7, 2017 in ClimateChangeDispatch
In the mid-1990s thermometers changed right across Australia — new electronic sensors were installed nearly everywhere. Known as automatic weather sensors (AWS) these are quite different to the old “liquid in glass” type.
The electronic ones can pick up very short bursts of heat—so they can measure extremes of temperatures that the old mercury or liquid thermometers would not pick up unless the spike of heat lasted for a few minutes.
It is difficult (impossible) to believe that across the whole temperature range that these two different instruments would always behave in the exact same way.
Finally, we’ve been told for years that volcanic eruptions cause COOLING … although what cooling is visible in the historical record is generally local, small, and short-lasting. But now, they say eruptions cause Northern Hemisphere winter warming? What’s up with that?
by Graham Lloyd, August 4, 2017 in Marc Morano,ClimateDepot
Recorded temperatures at the Bureau of Meteorology’s Thredbo Top automatic weather station have dropped below -10C in the past week, after action was taken to make the facility “fit for purpose”.
A record of the Thredbo Top station for 3am on Wednesday shows a temperature reading of -10.6C. This compares with the BoM’s monthly highlights for June and July, both showing a low of -9.6C.
The BoM said it had taken immediate action to replace the Thredbo station after concerns were raised that very low temperatures were not making it onto the official record.
“Settled” Climate Science apparently needs a lot more hands on deck to help explain to us how doomed we are if we don’t spend taxpayer’s money on climate stuff.
We provide a new confirmation for the link between solar activity and climate cycles by wavelet analysis showing a remarkably good agreement of the power of the ~190 – year period for temperatures and solar activity over 9000 years (see Fig.4. lower panel). As (Fig.2 and Table 2 ) show, the periods of ~1000 and ~460 years are also apparently common in records of temperatures and cosmogenic nuclides.
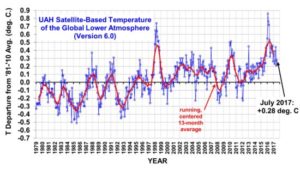
The Version 6.0 global average lower tropospheric temperature (LT) anomaly for July, 2017 was +0.28 deg. C, up a little from the June, 2017 value of +0.21 deg. C
J’ai eu l’immense honneur et le plaisir de côtoyer à de multiples reprises le Professeur Istvàn Marko.
C’était vraiment une personnalité exceptionnelle, tant sur le plan humain que scientifique. Sa disparition inopinée laisse un vide profond, et un grand désarroi parmi ceux qui l’ont connu
L’hommage de Drieu Godefridi à István Markó, esprit libre et grand scientifique qui s’est attaché à donner ses titres de noblesse à la science du climat.
Today ‘warm’ is strongly connected with ‘climate change’, if not with ‘dangerous climate change’. In the minds of people ‘cold’ should be more stable. But, paleo data show that it is‘cold’ that is unstable. While ‘warm’ always shows a high stability in climatic conditions.
The purpose of this study is to present robust evidence that the sun is working with water vapour to control the Earth’s climate and to show that the influence of CO2 on atmospheric temperature is so small as to be negligible.
The chart below is taken directly from figures provided by the U.S. government’s Carbon Dioxide Information Analysis Center (CDIAC) website, specifically its 2016 Global Carbon Project spreadsheet on the Historical Budget tab. In terms of gigatons of carbon, and from 1770 to 2004, it itemizes the growth rate of radiative forcing by atmospheric CO2 and the growth rate of oceanic absorption, what is known as a “carbon sink.”
La géologie, une science plus que passionnante … et diverse