by Wallace Manheimer, December 5, 2019 in WUWT
The industrial age, namely using coal, oil and gas to generate power instead of human and animal muscle, and wind and solar have lifted billions out of poverty. Before the industrial age, civilization was a thin veneer on top of a vast mound of human misery, that civilization maintained by such things as slavery, colonies, and tyranny. The recent calls to reject fossil fuel and go back to the former ways motivates one to see in a quantitative way just how important fossil fuel is and how we rely on it. It takes some numbers, which generally bore people as compared to generalities and preposterous claims, but numbers are important, and in fact are simpler to understand than the vague generalities.
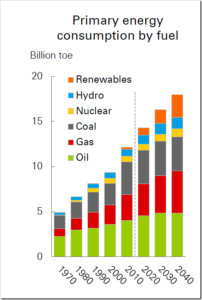
First let us look at the power that the world uses. BP is one of many organizations that publishes this data. Below is their graph of the power used by different parts of the world at various years and with projections for the future. The unit on the vertical axis is billions of tons per year of oil equivalent. Since this is not the usual units we think of, just think of a billion tons of oil per year as approximately equal to a trillion Watts, or a terawatt (TW). These Watts are the same units we are all use to, for instance we know what a 100-Watt light bulb is. Keep it on for 10 hours and you have used a kilowatt hour of energy and added about a dime to your electric bill. Here we will reduce all units of power to Watts, so everything will be in the same units and we can compare the power usage of one aspect of our lives to another.
…
…
by Prof. Samuel Furfari, 16 mai 2019, in ScienceClimatEnergie
La Commission européenne a publié dès le début de l’année 2019 son rapport sur l’évolution des prix et coûts de l’énergie en Europe. On peut y lire que l’étude de ces coûts devrait conduire à « veiller à̀ ce que les entreprises ne soient pas désavantagées ni écartées » et que « les prix de détail (réels) dans l’Union sont plus élevés qu’aux États-Unis, au Canada, en Russie, en Chine et en Turquie, mais inférieurs à̀ ceux observés au Japon et au Brésil. » Le graphique suivant (Figure 1) illustre bien le fait que les industries européennes sont pénalisées par rapport aux entreprises d’autres pays qui sont des concurrents directs sur les marchés internationaux, y compris pour nos importations. Le rapport ajoute pudiquement, sans y insister que « l’évolution des prix de l’électricité est dominée par les taxes et prélèvements ».
…
by Bigelow Laboratory for Ocean Sciences, January 8, 2019 in ScicneDaily
Microscopic marine plants flourish beneath the ice that covers the Greenland Sea, according to a new study. These phytoplankton create the energy that fuels ocean ecosystems, and the study found that half of this energy is produced under the sea ice in late winter and early spring, and the other half at the edge of the ice in spring.
…
by International Energy Agency, June 22, 2018 in IEA
Energy access is the “golden thread” that weaves together economic growth, human development and environmental sustainability. The adoption of the Sustainable Development Goals in 2015, and the adoption of SDG 7.1 specifically – the goal to ensure access to affordable, reliable, and modern energy for all by 2030 – established a new level of political recognition for energy’s central role in development.
Improvements in technologies are offering new opportunities for making significant progress on the SDG goal on electricity access. The combination of declining costs for solar and decentralised solutions, cheaper and more efficient lighting and appliances, and new business models making use of digital, mobile-enabled platforms has increased the number of available solutions to cater to those currently without electricity access. But many challenges remain, particularly for clean cooking.
by A. Watts, March 15, 2018 in WUWT
This paper deals with the central argument that skeptics bring up about claims of global warming: How do you separate the temperature signal from the base components like natural variation, human land-use influence, micro-site bias, measurement errors and biases, and other factors to get the “true” global warming signal?
The answer is that you can’t, at least not easily.
With the surface temperature record, it’s somewhat easier since you can observe some of those elements directly and separate them (such as we’ve done in our surfacestations project for land-use microsite biases), but in the ocean, everything is homogenized by the ocean itself. All you can look for is patterns, and try to disentangle based on pattern recognition. That’s what they are trying to do here.
Disentangling Global Warming, Multidecadal Variability, and El Niño in Pacific Temperatures
Authors
Robert C. Wills, Tapio Schneider, John M. Wallace, David S. Battisti, Dennis L. Hartmann
(…)
by Paul Driessen, February 26, 2018 in WUWT
America has had its share of oil-centered energy problems and disruptions. Now it faces potential renewable energy and high technology crises, because of its heavy reliance on imports of the rare earth and other strategic minerals that are the essential building blocks for wind turbines, solar panels, computers, smart phones, medical diagnostic devices, night vision goggles, GPS and communication systems, long-life batteries and countless other applications.
(…)
by P. Homewood, February 22, 2018 in NotaLotofPeopleKnowThat
These are the highlights:
The speed of the energy transition is uncertain and the new Outlook considers a range of scenarios. Its evolving transition (ET) scenario, which assumes that government policies, technologies and societal preferences evolve in a manner and speed similar to the recent past, expects
(…)
by Bjorn Lomborg, February 20, 2018 in ClimateChangeDispatch
The world is mostly run on fossil fuels (81%). Nuclear makes up 5%, with 14% from renewables. Solar panels and wind turbines contribute 0.8%.
When you hear 14% renewables, you will likely think ‘wow, things are going pretty well with the switch to renewables’. But these renewables are not the ones you hear about. The biggest contributor is humanity’s oldest fuel: wood (…)
by Clifford Krauss, January 28, 2018 in TheNewYorkTimes
HOUSTON — A substantial rise in oil prices in recent months has led to a resurgence in American oil production, enabling the country to challenge the dominance of Saudi Arabia and dampen price pressures at the pump.
The success has come in the face of efforts by Saudi Arabia and its oil allies to undercut the shale drilling spree in the United States. Those strategies backfired and ultimately ended up benefiting the oil industry.
Overcoming three years of slumping prices proved the resiliency of the shale boom. Energy companies and their financial backers were able to weather market turmoil — and the maneuvers of the global oil cartel — by adjusting exploration and extraction techniques.
by Samuel Furfari, December 13, 2017 in Eco-Business
The world has nothing to worry about reserves. After 40 years of fearing energy shortages, we now live with abundance. Guard against false narratives, not scarce resources says Samuele Furfari, Professor at Université libre de Bruxelles.
by Connaissances des Energies, 28 juillet 2017
La Banque mondiale a présenté le 18 juillet une étude soulignant les énormes besoins de minerais et de métaux associés à la transition « bas carbone » dans le monde. Un aspect souvent ignoré de cette transition.
Voir également ici
by Connaissance des Energies, 15 septembre 2017
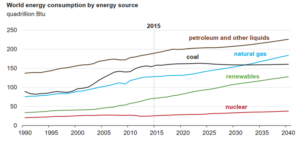
La consommation mondiale d’énergie pourrait augmenter de 28% entre 2015 et 2040 selon les dernières prévisions de l’EIA (agence américaine d’information sur l’énergie) présentées hier. Le mix énergétique mondial devrait pour sa part rester très largement dominé par les énergies fossiles dans les décennies à venir.
by Oil&Gas Journal Editors, September 14, 2017
World energy consumption is projected to rise to 736 quadrillion btu (quads) in 2040 from 575 quads in 2015, an increase of 28%, according to the latest International Energy Outlook 2017 (IEO2017) from the US Energy Information Administration.
Most of this growth is expected to come from countries that are not in the Organization for Economic Cooperation and Development and especially in countries where demand is driven by strong economic growth, particularly in Asia. Non-OECD Asia, which includes China and India, accounts for more than 60% of the world’s total increase in energy consumption from 2015 through 2040.
by International Energy Agency (iea), July 11, 2017
Global energy investment fell by 12% in 2016, the second consecutive year of decline, as increased spending on energy efficiency and electricity networks was more than offset by a continued drop in upstream oil and gas spending, according to the International Energy Agency’s annual World Energy Investment report.
Global energy investment amounted to USD 1.7 trillion in 2016, or 2.2% of global GDP. For the first time, spending on the electricity sector around the world exceeded the combined spending on oil, gas and coal supply. The share of clean-energy spending reached 43% of total supply investment, a record high.
by Bloomberg News, July 4, 2017
China has promised to make its skies blue again, but having some of the world’s most-expensive natural gas isn’t helping.
by U.S. Energy Information Administration, June 2017
Petroleum, natural gas, coal, renewable energy, and nuclear electric power are primary energy sources. Electricity is a secondary energy source that is generated from primary energy sources.
by Jean-Louis Schilansky, Président du Centre Hydrocarbures Non Conventionnels, 3 Avril 2017
Le début du XXIe siècle connaît une période inédite d’abondance et de diversité énergétique, marquée par d’importantes avancées technologiques dans la production d’énergie. Les développements les plus notables concernent l’essor des énergies renouvelables et des ressources d’hydrocarbures non conventionnels, en particulier de pétrole et de gaz de schiste en Amérique du Nord
par Prof. Samuel Furfari, 23 Mars 2017
Expert européen auprès de la DG Énergie de la Commission européenne
Maître de conférences à l’Université Libre de Bruxelles
2050, c’est dans 33 ans. Il y a 33 ans, nous étions en 1984, en plein contre-choc pétrolier. Après le tremblement du monde suite aux deux chocs pétroliers consécutifs provoqués par l’OPEP, le prix du pétrole était tombé si bas qu’aujourd’hui encore, tout nouveau contre-choc pétrolier constitue un épouvantail pour l’Arabie saoudite. Qu’est-ce qui avait permis cette contre-révolution et mis en échec la stratégie de l’OPEP ? Tout d’abord, l’abandon de la consommation de produits pétroliers dans les centrales électriques (à l’époque, le prix du brut était si bas que l’on pouvait se permettre le luxe de l’utiliser pour produire de l’électricité). La maturation de la technologie nucléaire et le développement de technologies modernes de combustion de charbon ont changé la donne. Ensuite, la mise en œuvre de technologies plus efficientes, notamment dans le secteur de l’automobile, avait donné lieu à des économies d’énergie qui ont permis de réduire la consommation de pétrole. Cela se résumait à l’époque par un slogan lancé par la Commission européenne : COCONUC pour « COal, COnservation and NUClear ». Les résultats ont été au rendez-vous et ont suscité un retour à la sérénité énergétique.
World Energy Outlook 2016 IEA, March 16, 2017
Executive summary
In our main scenario, a 30% rise in global energy demand to 2040 means an increase in consump on for all modern fuels, but the global aggregates mask a mul tude of diverse trends and signi cant switching between fuels. Moreover, hundreds of millions of people are s ll le in 2040 without basic energy services. Globally, renewable energy – the subject of an in-depth focus in WEO-2016 – sees by far the fastest growth. Natural gas fares best among the fossil fuels, with consump on rising by 50%. Growth in oil demand slows over the projec on period, but tops 103 million barrels per day (mb/d) by 2040. Coal use is hit hard by environmental concerns and, a er the rapid expansion of recent years, growth essen ally grinds to a halt. The increase in nuclear output is spurred mainly by deployment in China.
by U.S. Energy Information Administration, update March 7, 2017
Australia, rich in hydrocarbons and uranium resources, was the world’s largest coal exporter in 2015 and the second-largest liquefied natural gas (LNG) exporter in 2015.
Australia is rich in commodities, including fossil fuel and uranium reserves, and is one of the few countries belonging to the Organization for Economic Cooperation and Development (OECD) that is a significant net energy exporter. Australia sent about 68% of its total energy production (includes uranium exports and excludes total energy imports) overseas in fiscal year 2015 (July 2014—June 2015), according to data from the Australian government
L’énergie s’est encore trouvée au cœur de l’actualité de 2016. Connaissance des Énergies vous propose de revenir sur cette année à travers plusieurs grands temps forts.
Production de pétrole : des accords OPEP et « hors OPEP » (novembre/décembre 2016)
Après plusieurs réunions durant l’année 2016, onze pays membres de l’OPEP ont conclu le 30 novembre un accord visant à réduire leur production globale de pétrole brut d’environ 1,2 million de barils par jour (Mb/j) à partir du 1er janvier 2017(1) (ramenant la production de l’OPEP à un niveau de 32,5 Mb/j). L’effort le plus important de réduction provient de l’Arabie Saoudite (- 0,5 Mb/j) qui avait déclaré dès le début de l’année ne pas vouloir être le seul grand producteur à réduire sa production pour faire remonter les cours.
Le 10 décembre, onze autres pays n’appartenant pas à l’OPEP ont convenu de contribuer à cet effort en réduisant leur production cumulée de 558 000 barils par jour. Plus de la moitié de cette baisse est censée être assurée par la Russie (- 0,3 Mb/j).
Suite sur connaissance des énergies
Les ressources naturelles [1] peuvent-elles satisfaire sans fins nos exigences de bien être ? À long terme surement pas, les gisements (métaux -uranium, thorium, or … et pierres précieuses –diamants, saphirs, topazes…), les hydrocarbures (gazeux, liquides, solides) et les géomatériaux (roches, sables, granulats…) ne sont pas renouvelables. L’économie internationale étant contrainte en premier lieu par la géologie, il en résulte une distribution inégale des richesses de la Terre et une lutte pour se les approprier, nécessitant un développement technologique pour accroître les volumes récupérables. Certains vont même jusqu’à parier que les futures ressources seront à prendre sur d’autres planètes, sur des astéroïdes ; des équipes y travaillent déjà. En attendant, tentons un bilan de la situation actuelle : reste-t-il assez de ressources sur notre planète? Pour combien de temps ? Estimer leur volume ultime[2] est assez facile grâce à l’exploration de plus en plus efficace, mais prédire leur durée d’exploitation est une autre paire de manches car elle dépend de facteurs économiques et politiques aléatoires aussi bien dans les court et moyen termes. Les réserves ne peuvent qu’évoluer au cours du temps en fonction des moyens et les déclarer est un acte politique et économique de grande importance.
La géologie, une science plus que passionnante … et diverse
