Archives de catégorie : climate-debate

Sea ice average for March is the metric used to compare to previous winters

by S. Crockford, Apr 5, 2022 in PolarBearScience


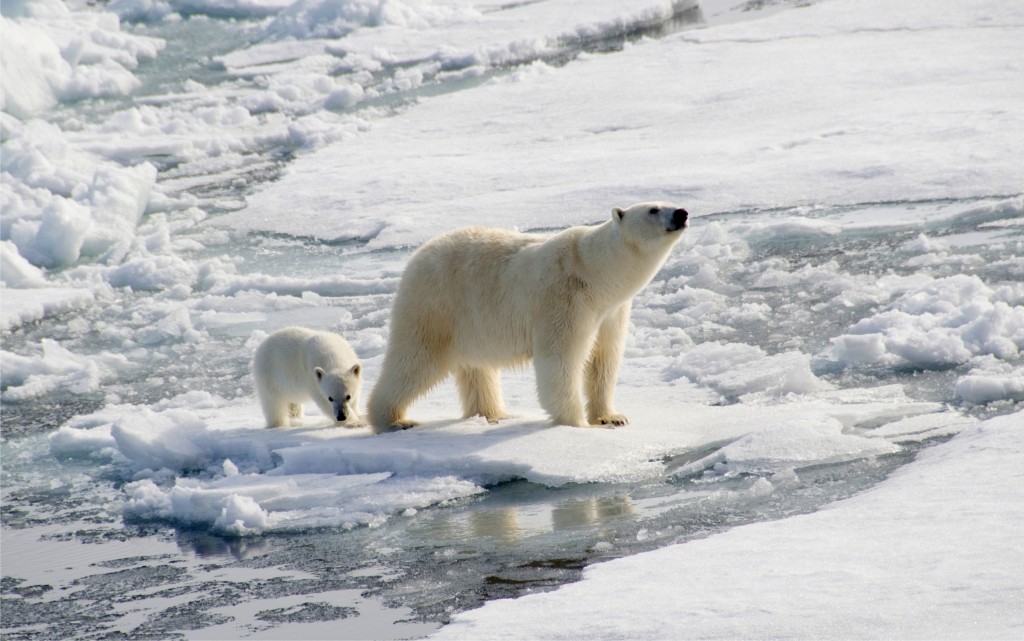
The average sea ice cover at the end of March is the metric used to compare ‘winter’ ice to previous years or decades, not the single-day date of ‘most’ ice. This year, March ended with 14.6 mkm2 of sea ice, most of which (but not all) is critical polar bear habitat. Ice charts showing this are below.

But note that ice over Hudson Bay, which is an almost-enclosed sea used by thousands of polar bears at this time of year, tends to continue to thicken from March into May: these two charts for 2020 show medium green becoming dark green, indicating ice >1.2 m thick, even as some areas of open water appear.

Climate-Change ‘Solutions’ That Are Worse Than The Problem

by J. Trennert, Apr 8, 2022 in ClimateChangeDispatch


If you can afford a Tesla, you probably find it hard to imagine that there are some 3.5 billion people on Earth who have no reasonably reliable access to electricity.

Even less obvious may be the way rich countries’ pursuit of carbon neutrality at almost any cost limits economic opportunities for the world’s poor and poses serious geopolitical risks to the West. [bold, links added]

Anyone on an investment committee has likely spent untold amounts of time discussing ways to mitigate the impact of climate change, but they’ve likely never heard anyone state one simple and incontrovertible fact: The widespread exploration and production of fossil fuels that started in Titusville, Pa., not quite 170 years ago has done more to benefit the lives of ordinary people than any other technological advance in history.

Before fossil fuels, people relied on burning biomass, such as timber or manure, which was a far dirtier and much less efficient source of energy.

Fossil fuels let people heat their homes in the winter, reducing the risk of death from exposure. Fossil-fuel-based fertilizers greatly increased crop yields, reducing starvation and malnutrition.

Before the advent of the automobile, the ability for many people to venture far from their hometown was an unfathomable dream.

Oil- and coal-burning transportation opened up access to education, commerce, professional opportunities, and vital services such as medicine.

There has been, and remains, a strong correlation between the use of fossil fuels and life expectancy.

How is the invasion of Ukraine related to carbon dioxide?

by D. Nerbert, Apr 2, 2022 in CO2Coalition


America’s Executive and Legislative Branches are full of ignorant politicians who need help from a 5th-grader. By the 5th grade, students have already learned that all animals and fungi consume oxygen (O2) and release carbon dioxide (CO2);conversely, all plants consume CO2 and expel O2. This is the Circle of Life; without it, our planet would be only a rock in this solar system.

 In 2019 and 2020, America became energy-independent — for the first time since the mid-1950s. This meant greater amounts of crude oil and petroleum products were exported than imported. Our economy was growing beautifully, and unemployment rates were the lowest in more than 50 years. On 20 January 2021, this was abruptly reversed with the stroke of Biden’s pen (executive order 13807 revoked, plus EO13990, EO14008 and EO14030) — which incomprehensibly made America energy-dependent once again, and has also caused this unwanted inflation.

 Biden’s “climate plan” includes goals to transition from fossil fuels to “clean energy,” cut emissions from electric power to zero by 2035, and reach “net-zero CO2 emissions” by 2050. However, “clean energy” (solar and wind) is unreliable and does not even provide 10% of America’s energy needs. Biden’s entire house-of-cards is based on becoming “carbon-neutral” — because CO2 is viewed as “the cause of global warming,” which is claimed to be the “greatest existential threat to mankind.”

 How silly is this? CO2 — along with O2, nitrogen (N2) and water vapor (H2O) — is necessary for all Life on Earth. Geological studies indicate that CO2 levels have been as high as ~10,000-15,000 parts-per-million (ppm). This was during the Cambrian Period (~541 to 485 million years ago), long before mammals existed; at that time, plant life flourished.

 Ice-core data (during the past 800,000 years) have shown cycles of CO2 ranging between ~150-180 ppm during Glacial Periods, and ~280-310 ppm during Inter-Glacial Periods. Earth ascended from its last Glacial Period ~11,500 years ago.

 Warming and cooling oceans are the likely reason for these CO2 oscillations. Atmospheric CO2 has risen from ~280 ppm in 1850 (end of the Little Ice Age) to ~410 ppm today. Thus, current levels of ~410 ppm (i.e., 100 ppm more than 310 ppm) most likely reflect the burning of fossil fuels. However, rising CO2 levels in this last century have substantially improved crop growth.

The new Pause lengthens: now 7 years 6 months

by C. Monckton of Brenchley, Apr 3, 2022, in WUWT


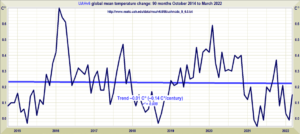
The new Pause has lengthened by another month. On the UAH satellite monthly global mean lower-troposphere temperature dataset, seven and a half years have passed since there was any trend in global warming at all. As always, if anyone has seen this surely not uninteresting fact mentioned in the Marxstream news media, let us know in comments. One of the best-kept secrets in what passes for “journalism” these days is that global temperature has not been rising steadily (or, since October 2014, at all). It has been rising in occasional spurts in response to natural events such as the great Pacific shift of 1976 and the subsequent strong el Niño events, rather than at the somewhat steadier rate that one might expect if our continuing – and continuous – sins of emission were the primary culprit.


UAH Global Temperature Update for March, 2022: +0.15 deg. C

by Dr R. Spencer, Apr 4, 2022 in WUWT


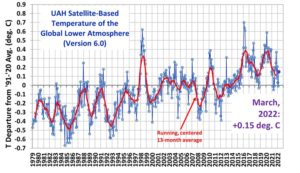
The Version 6.0 global average lower tropospheric temperature (LT) anomaly for March, 2022 was +0.15 deg. C, up from the February, 2022 value of -0.01 deg. C.

The linear warming trend since January, 1979 still stands at +0.13 C/decade (+0.12 C/decade over the global-averaged oceans, and +0.18 C/decade over global-averaged land).

Various regional LT departures from the 30-year (1991-2020) average for the last 15 months are:

YEAR MO GLOBE NHEM. SHEM. TROPIC USA48 ARCTIC AUST 
2021 01  0.12  0.34 -0.09 -0.08  0.36  0.49 -0.52
2021 02  0.20  0.32  0.08 -0.14 -0.66  0.07 -0.27
2021 03 -0.01  0.12 -0.14 -0.29  0.59 -0.78 -0.79
2021 04 -0.05  0.05 -0.15 -0.29 -0.02  0.02  0.29
2021 05  0.08  0.14  0.03  0.06 -0.41 -0.04  0.02
2021 06 -0.01  0.30 -0.32 -0.14  1.44  0.63 -0.76
2021 07  0.20  0.33  0.07  0.13  0.58  0.43  0.80
2021 08  0.17  0.26  0.08  0.07  0.32  0.83 -0.02
2021 09  0.25  0.18  0.33  0.09  0.67  0.02  0.37
2021 10  0.37  0.46  0.27  0.33  0.84  0.63  0.06
2021 11  0.08  0.11  0.06  0.14  0.50 -0.43 -0.29
2021 12  0.21  0.27  0.15  0.03  1.62  0.01 -0.06
2022 01  0.03  0.06  0.00 -0.24 -0.13  0.68  0.09
2022 02 -0.01  0.01 -0.02 -0.24 -0.05 -0.31 -0.50
2022 03  0.15  0.27  0.02 -0.08  0.21  0.74  0.02

The full UAH Global Temperature Report, along with the LT global gridpoint anomaly image for March, 2022 should be available within the next several days here.


Claims on the Antarctic Ice Breakup Suffer from Limited History

by A. Watts, Mar 30, 2022 in ClimateRealism


The media was full of disaster headlines this week over an observed breakup of a minor and little-known Antarctic ice shelf. Yahoo News and the New York Times, among others, lamented the “unprecedented” event. The problem is, we don’t really have any knowledge of previous events, making the present day claims false by omission.


During that period the Antarctic sea ice will in fact refreeze just like it does every year. You can be almost certain that if the Glenzer-Conger ice shelf forms again from the fragments and new ice, we won’t see MSM headlines about it because it goes against the “climate change” narrative.

A new volcanic province: an inventory of subglacial volcanoes in West Antarctica

by M. van Wyk et al., May 29, 2017 in LyellSpecPublications


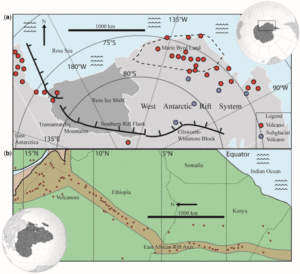
(a) Location of the main components of the West Antarctic Rift System and confirmed volcanoes (red circles: after LeMasurier et al. 1990; Smellie & Edwards 2016). (b) Location of Holocene volcanoes (red circles) in the Ethiopia/Kenya branch of the East African Rift (red shaded area). The majority of this activity is aligned along the rift axis with occasional flank volcanism. Data from Siebert & Simkin (2002) and Global Volcanism Program (2013).

 Abstract

The West Antarctic Ice Sheet overlies the West Antarctic Rift System about which, due to the comprehensive ice cover, we have only limited and sporadic knowledge of volcanic activity and its extent. Improving our understanding of subglacial volcanic activity across the province is important both for helping to constrain how volcanism and rifting may have influenced ice-sheet growth and decay over previous glacial cycles, and in light of concerns over whether enhanced geothermal heat fluxes and subglacial melting may contribute to instability of the West Antarctic Ice Sheet. Here, we use ice-sheet bed-elevation data to locate individual conical edifices protruding upwards into the ice across West Antarctica, and we propose that these edifices represent subglacial volcanoes. We used aeromagnetic, aerogravity, satellite imagery and databases of confirmed volcanoes to support this interpretation. The overall result presented here constitutes a first inventory of West Antarctica’s subglacial volcanism. We identified 138 volcanoes, 91 of which have not previously been identified, and which are widely distributed throughout the deep basins of West Antarctica, but are especially concentrated and orientated along the >3000 km central axis of the West Antarctic Rift System.

Climate Past Far From Settled: 7 Major Temperature Reconstructions Find No Agreement

by P. Gosselin, Mar 29, 2022 in WUWT    


new paper published in open access publishing MDPI looks at seven prominent hemispheric and global temperature reconstructions for the past 2000 years (T2k).

The analysis conducted by the authors found that some reconstructions “differed from each other in some segments by more than 0.5 °C” whilst some show negligible pre-industrial climate variability (“hockey sticks”).

Those showing variability would suggest natural factors playing a greater role than those that claim climate had been rather constant over the past 2000 years.

Abstract: Global mean annual temperature has increased by more than 1 °C during the past 150 years, as documented by thermometer measurements. Such observational data are, unfortunately, not available for the pre-industrial period of the Common Era (CE), for which the climate development is reconstructed using various types of palaeoclimatological proxies. In this analysis, we compared seven prominent hemispheric and global temperature reconstructions for the past 2000 years (T2k) which differed from each other in some segments by more than 0.5 °C. Whilst some T2k show negligible pre-industrial climate variability (“hockey sticks”), others suggest significant temperature fluctuations. We discuss possible sources of error and highlight three criteria that need to be considered to increase the quality and stability of future T2k reconstructions. Temperature proxy series are to be thoroughly validated with regards to (1) reproducibility, (2) seasonal stability, and (3) areal representativeness. The T2k represents key calibration data for climate models. The models need to first reproduce the reconstructed pre-industrial climate history before being validated and cleared for climate projections of the future. Precise attribution of modern warming to anthropogenic and natural causes will not be possible until T2k composites stabilize and are truly representative for a well-defined region and season. The discrepancies between the different T2k reconstructions directly translate into a major challenge with regards to the political interpretation of the climate change risk profile. As a rule of thumb, the larger/smaller the pre-industrial temperature changes, the higher/lower the natural contribution to the current warm period (CWP) will likely be, thus, reducing/increasing the CO2 climate sensitivity and the expected warming until 2100.

Fossil Fuels v Renewable Energy

by P. Homewood, Mar 31, 2022 in NotaLotofPeopleKnowThat


solutions and products automatically come to the fore, without the need for subsidies, regulations and mandates.

If renewable energy is all that is promised, it will do the same.

There is of course no doubt that the cheap, abundant and reliable energy provided by fossil fuels has transformed society and made all of us better off than ever before in so many ways.

We get rid of them at our peril!

So far, our transition to renewable energy in the UK has been painfully slow and extremely expensive. Wind and solar power still supply only 3% of the UK’s total energy consumption after two decades of trying. Meanwhile, according to the Office for Budget Responsibility, subsidies for renewables were expected to cost £12 billion in 2021/22. This actually understates the reality because it does not include all of the indirect costs involved in grid balancing and so on, meaning the true cost is probably over £15 billion.

It is of course true that the recent rocketing of gas prices has reset the agenda. But it is important to note that the current price does not reflect the cost of extracting gas. It is the result of an imbalance in supply and demand. Such imbalances have occurred before, and a normally functioning market would quickly increase gas production, driving prices back down to historic levels.

But even before those price rises, it was being claimed that wind and solar power were cheaper than fossil fuel. However such claims fail to take into account the additional system costs imposed by their intermittency.

Moreover, claims that offshore wind costs are now down to around £40/MWh simply are not supported by the evidence. The claims are derived from the prices agreed for Contracts for Difference, the government subsidy mechanism. However, wind farms are under no legal obligation to actually take up these contracts; they are effectively only options.

34 Years of Flawed, Failed & Grossly Misrepresented Global Sea Level Rise Speculation

by L. Hamlin, Mar 30, 2022 in WUWT


For decades climate alarmists in the UK, EU and U.S. have been making flawed and failed exaggerated claims regarding accelerating global level sea level rise being caused by increasing man made CO2 emissions as one means of politically bullying the world’s nations into mandating immensely costly, bureaucratically onerous and completely ineffective global CO2 reductions from these nations.

The flawed CO2 reduction schemes in the EU and UK have created significant declines in energy availability and reliability because of these nations excessive reliance on unreliable, nondispatchable, backup power reliant and costly renewable energy. These politically contrived emissions and energy incompetent policies have resulted in greatly increasing energy costs for EU and UK nations that negatively impacted their economies while significantly increasing their dependence on energy from other nations.

This energy dependence includes greatly increased needs for natural gas, petroleum and coal supplies obtained through other nations and especially from Russia which (before sanctions) provided about 40% of the EU’s natural gas energy as well as being the EUs main supplier of crude oil (27%) and hard coal (49%). This data and other information concerning the EU and UK self-inflicted climate alarmist driven energy and economic debacle is addressed herehere and here.

The EUs efforts to build additional liquified natural gas terminals to wean itself off Russian gas is estimated to take at least three years with existing available import shipping facilities already maxed out. Renewables would take even longer. Any new LNG cargoes will have higher costs than the existing Russian pipelines. EU policy makers are stuck with politically damaging options including rationing energy and using more coal which means dumping climate goals. When push comes to shove emission reductions will take second place to economic survival with this huge energy and emissions policy turnaround already underway and being led by Germany.

A Brief Summary Of How ‘Global Warming’ Science Has Changed Since 1998

by K. Richard, Mar 31, 2022 in NoTricksZone


Two weeks before Dr. Michael E. Mann and colleagues published their 23 April 1998 “hockey stick” chart in Nature, a peer-reviewed journal published a paper asserting “an overwhelming majority of climate scientists” (50 out of 60) view catastrophic human-caused global warming – and even global warming itself – as an “unsupported assumption”.

At the time, satellite data indicated the lower troposphere had cooled by 0.13°C between 1979 and 1994. The Arctic had cooled by -0.88°C since the 1940s.

It was thought the IPCC had just (1995) perpetrated a “disturbing corruption of the peer-review process” in manipulating the conclusions of scientists to support favored government policies.

AR6 and Sea Level Rise, Part 1

by Andy May, Mar 19, 2022 in WUWT


This is the first of a three-part series on the IPCC’s discussion of sea level rise in their latest report, AR6 (IPCC, 2021). The report claims that the rate of sea level rise is accelerating. It is fair to ask why they think this, what evidence do they offer?

We find the following in the AR6 Summary for Policymakers:

“Global mean sea level increased by 0.20 [0.15 to 0.25] m between 1901 and 2018. The average rate of sea level rise was 1.3 [0.6 to 2.1] mm yr–1 between 1901 and 1971, increasing to 1.9 [0.8 to 2.9] mm yr–1 between 1971 and 2006, and further increasing to 3.7 [3.2 to 4.2] mm yr–1 between 2006 and 2018 (high confidence). Human influence was very likely the main driver of these increases since at least 1971.” [Bold added]

AR6 Summary for Policymakers, page SPM-6 (IPCC, 2021)

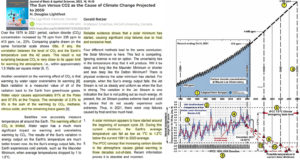
New Study: The CO2-Drives-Global-Warming ‘Concept’ Is ‘Obsolete And Incorrect’

by Lightfoot & Ratzer,  Mar 14, 2022 in NoTricksZone/JBasicApplSci


In analyzing UAH global temperature and Mauna Loa CO2 records from 1979 to 2021, climate researchers Lightfoot and Ratzer (2022) report there has been “little, if any” correlation between these two variables during this period.

They assert that between 91 and 98% of Earth’s greenhouse gas effect is from water vapor, as CO2 and other trace gases contribute less than 5% to greenhouse gas forcing.

A solar minimum has just began in the current solar cycle 25. The declining solar output is projected to eventually lead to a ~1 to 1.2°C cooling over the next 30 to 40 years. Solar minimum periods are also accompanied by crop failures due to frost and weather extremes delivering excessive heat.

The authors conclude by suggesting the popularized conceptualization of CO2 as a driver of global warming has proven to be “obsolete and incorrect”.

Al Gore’s 2009 Warning on Vanishing Polar Ice and the Perils of Censoring ‘Misinformation’

by J. Miltimore, Mar 17, 2022 in FEEStories


While speaking at a climate change summit in Denmark in 2009, former Vice President Al Gore made an alarming statement.

Citing research from Dr. Wieslaw Maslowski, a professor of oceanography at the Naval Postgraduate School in California, Mr. Gore said it was likely that the north polar ice caps would soon be completely melted.

“These figures are fresh,” Mr. Gore said. “Some of the models suggest to Dr. Maslowski that there is a 75 percent chance that the entire north polar ice cap, during the summer months, could be completely ice-free within five to seven years.”

New Analysis Of Greenland’s GISP2 Temperatures Expose Selection Bias In Paleo Reconstructions

by K. Richard, Mar 17, 2022 in NoTricksZone


Scientists admit that 3 different Greenland Summit (GISP2) temperature reconstruction “strategies” produce 3 different paleoclimate temperature results. The reconstructions chosen as the most “robust” are therefore the ones that align best with the authors’ presuppositions.

In a new study published in Quaternary Science Reviews scientists (Döring and Luenberger, 2022) report they reject a reconstruction of Greenland Summit temperatures that shows it has cooled ~4°C since Roman times (shown below as the red trend line, extended to 2000 C.E.).

Northern and Southern Hemisphere Warming

by A. May, Mar 18, 2022 in WUWT


As shown in Figure 1, the Hadley Climatic Research Unit HadCRUT5 temperature dataset suggests the Northern Hemisphere warmed 0.74°C (1.3° F) more than the Southern Hemisphere from 1979 through 2021. The UAH satellite temperature lower troposphere record is directionally similar but the difference between the hemispheres is much less, as shown in Figure 2. Both figures have identical vertical scales of 1.4°C. The UAH global satellite warming difference, from 1979 to 2021, between the hemispheres is about 0.2°C (0.4° F), less by more than a factor of 3.

Conclusions

The UAH and HadCRUT5 records both show the Northern Hemisphere warming more rapidly than the Southern, but the amount of extra warming in the HadCRUT5 record is anomalous. While the Southern Hemisphere satellite and surface rates are similar, the Northern Hemisphere rates are very different.

The global UAH lower troposphere and HadSST4 warming rates are both 0.14°C/decade from 1979 to 2020, the same to two decimals, as shown in my previous post. The oceans cover 70% of Earth’s surface and the HadSST4 dataset is used in combination with the CRUTEM5 land-surface temperature record to produce the curves in Figure 1. Given this, the large difference in Northern Hemisphere warming rates between Figures 1 and 2 is very hard to explain. Frankly, it suggests there is a problem with CRUTEM5. Figure 3 suggests the problem is getting worse in recent years, not better. This topic is discussed in more detail in my latest book: The Great Climate Change Debate: Karoly v Happer.

Ancient El Niños reveal limits to future climate projections

by University of Texas at Austin, Mar 15, 2022 in ScienceDaily


The climate pattern El Niño varies over time to such a degree that scientists will have difficulty detecting signs that it is getting stronger with global warming.

That’s the conclusion of a study led by scientists at The University of Texas at Austin that analyzed 9,000 years of Earth’s history. The scientists drew on climate data contained within ancient corals and used one of the world’s most powerful supercomputers to conduct their research.

The study of the past, which was recently published in Science Advances, was motivated by the need to get a clearer picture of how climate change may affect El Niño in the future.

El Niño is the warm phase of the El Niño Southern Oscillation, a climate phenomenon that sets the stage every few years for weather patterns worldwide. Strong El Niño events, such as the ones in 1997 and 2015 that brought wildfires to the rainforests of Borneo in Asia and caused widespread bleaching to the world’s coral reefs, happened about once a decade.

Computer models, however, are unclear about whether El Niño events will become weaker or stronger as the world warms due to climate change.

Green Fuel Folly: Forest Thinning (For Wood Pellet Production) Has A Profound Surface Warming Impact

by P. Gosselin, Mar 15, 2022 in NoTricksZone


4 recent studies tell us that forest thinning for the production of wood pellets and clear cutting for wind parks are really dumb ideas. 

Reforestation and afforestation (R&A) are among the most prominent ideas for the sequestration of CO2 and thus viewed by alarmists as a climate solution. But others doubt forests play much of a role.

Wood pellets mean double barrel warming

Another solution proposed for climate protection is to burn wood pellets instead of oil and natural gas for heating buildings. Wood pellets are viewed as renewable and thus are supposed to be brakes on climate change. But now recent studies suggest that burning wood pellets coming from harvested trees in forest thinning operations may instead be accelerating warming.

HAT-TIP: Die kalte Sonne here.

Cloud–albedo effects due to land–atmosphere interactions

In their study, “Cloud cooling effects of afforestation and reforestation at midlatitudes” the team of authors led by Sara Cerasoli carefully analyzed R&A at midlatitudes. Using both satellite data and atmospheric boundary-layer models, they show that by including cloud–albedo effects due to land–atmosphere interactions, the R&A cooling at midlatitudes becomes prevalent.

This means that scientists earlier had not adequately taken the clouds that formed due to forests into account. These high albedo clouds play a major role in terms of having a cooling effect. Clouds tend to form more over intact forests than they do over forest-free areas.

Forests along with the clouds they help create, act to cool surface temperatures. Thus efforts to keep forests intact at midlatitudes would help cool the earth’s surface.

Satellite and Surface Temperatures

by A. May, Mar 15, 2022 in WUWT


In the Great Climate Change Debate between Professor David Karoly and Professor Will Happer, Glenn Tamblyn was called upon to finish the consensus side of the debate after Karoly backed out. The details are described in my latest book. The debate contained an illuminating exchange of opinions on satellite versus surface temperature measurements. This is Glenn Tamblyn’s opinion:

“Stitching together raw data from multiple satellites is very complex. Thus, the satellite datasets are much less accurate than the surface temperature datasets.

Professor Happer’s stronger emphasis on satellite temperature measurements does not agree with the experts on the subject.”

(Tamblyn, 2021b, pp. 7-8)

Satellites measure microwave radiation emitted from oxygen atoms in the atmosphere to estimate the “brightness” temperature, which can then be converted to an actual atmospheric temperature. No correlation to any other measurements is required. The measured brightness is compared to the brightness temperature of deep space (-455°F) and a target of known temperature within the satellite to compute the actual temperature in the atmosphere.[1]

Due to interference and clouds, this technique does not work close to the surface, so satellite atmospheric temperatures cannot be directly compared to surface measurements. The satellite measurements are best for measuring air temperatures in the mid-troposphere and the lower stratosphere.

The Hadley Centre has estimated that their best current estimate of global monthly average SST accuracy(sea surface temperature average uncertainty from 2000 to 2021) is about ±0.033°C and David Karoly supplied an estimate of ±0.1°C. This is a bit less accurate than the accuracy Roy Spencer and John Christy estimate for their satellite measurements of ±0.011°C for a monthly average.[1]

Ancient El Niños reveal limits to future climate projections

by University of Texas at Austin, Mar 15, 2022 in ScienceDaily


The climate pattern El Niño varies over time to such a degree that scientists will have difficulty detecting signs that it is getting stronger with global warming.

That’s the conclusion of a study led by scientists at The University of Texas at Austin that analyzed 9,000 years of Earth’s history. The scientists drew on climate data contained within ancient corals and used one of the world’s most powerful supercomputers to conduct their research.

The study of the past, which was recently published in Science Advances, was motivated by the need to get a clearer picture of how climate change may affect El Niño in the future.

El Niño is the warm phase of the El Niño Southern Oscillation, a climate phenomenon that sets the stage every few years for weather patterns worldwide. Strong El Niño events, such as the ones in 1997 and 2015 that brought wildfires to the rainforests of Borneo in Asia and caused widespread bleaching to the world’s coral reefs, happened about once a decade.

Computer models, however, are unclear about whether El Niño events will become weaker or stronger as the world warms due to climate change.

“Much of the world’s temperature and rainfall are influenced by what happens in the tropical Pacific Ocean where El Niño starts,” said the study’s lead author, Allison Lawman, who began the research as a Ph.D. project at the UT Jackson School of Geosciences and is now a postdoctoral researcher at the University of Colorado Boulder. “The difference in rainfall between greater or fewer strong El Niño events is going to be a critical question for infrastructure and resource planners.”

New Study: The CO2-Drives-Global-Warming ‘Concept’ Is ‘Obsolete And Incorrect’

by K. Richard, Mar 14, 2022 in NoTricksZone


“The IPCC concept that increasing carbon dioxide in the atmosphere causes global warming is three decades out-of-date.”  − Lightfoot and Ratzer (2022), Journal of Basic & Applied Sciences

In analyzing UAH global temperature and Mauna Loa CO2 records from 1979 to 2021, climate researchers Lightfoot and Ratzer (2022) report there has been “little, if any” correlation between these two variables during this period.

They assert that between 91 and 98% of Earth’s greenhouse gas effect is from water vapor, as CO2 and other trace gases contribute less than 5% to greenhouse gas forcing.

A solar minimum has just began in the current solar cycle 25. The declining solar output is projected to eventually lead to a ~1 to 1.2°C cooling over the next 30 to 40 years. Solar minimum periods are also accompanied by crop failures due to frost and weather extremes delivering excessive heat.

The authors conclude by suggesting the popularized conceptualization of CO2 as a driver of global warming has proven to be “obsolete and incorrect”.

Image Source: Lightfoot and Ratzer, 2022

Past global photosynthesis reacted quickly to more carbon in the air

by University of Copenhagen, Mar 10, 2022 in ScienceDaily


Ice cores allow climate researchers to look 800,000 years back in time: atmospheric carbon acts as fertilizer, increasing biological production. The mechanism removes carbon from the air and thereby dampens the acceleration in global warming.

Even under ice age conditions will plants, plankton, and other life forms be able to increase production whenever atmospheric carbon concentrations rise. The mechanism will not prevent an ongoing trend of global warming, but at least dampen the acceleration. This conclusion stems from an international collaboration involving the Physics of Ice Climate Earth (PICE) center of Niels Bohr Institute, University of Copenhagen.

“Global biosphere production through photosynthesis is the strongest absorbing flux of atmospheric carbon dioxide. It is therefore essential to understand its natural variability for a better projection of the future carbon cycle,” says Postdoc researcher Ji-Woong Yang, PICE, continuing:

“Nowadays, as we have Earth observation satellites and other advanced equipment, the mechanism of carbon fertilization is well established. However, we were not sure that the same mechanism existed in past periods where the climate was very different and atmospheric carbon concentrations much lower. The new results confirm the existence of the strong correlation and allow us to model future developments with more confidence.”

Eight glacial cycles are covered

In collaboration with Laboratoire des Science du Climat et de l’Environnement, France, the PICE team has studied the ancient air trapped inside tiny air bubbles in an Antarctic ice core. The ice core represents the last 800,000 years of climatic development.

The scientists take advantage of the fact that the oxygen atom does not only exist in the most common form 16O with 8 protons and 8 neutrons but also as the isotopes 17O and 18O. The isotopic composition is a tracer for biosphere productivity. Uniquely, the method will show the global level of biological production in contrast to other methods which give more localized results.

Combining the air bubble measurements with modeling of oxygen behavior in both the biosphere and the stratosphere, the researchers were able to quantify the biosphere productivity evolution under both glacial periods (ice ages) and interglacial periods. In total, eight glacial cycles were covered.

“The results clearly demonstrate that productivity drops during glacial periods and increases during interglacial periods. Further, a strong correlation exists with past atmospheric carbon dioxide concentrations measured from multiple ice cores. In addition, the effect is more prominent during glacial periods where the level of carbon dioxide and the global biosphere productivity start to increase several thousand years before the ice caps begin to melt. This correlation is explained by the strong fertilization effect by atmospheric carbon dioxide,” says Ji-Woong Yang.

There is no climate crisis

by R. Darwall, Mar 7, 2022 in TheSpectator


“No climate crisis” is, of course, not the spin the Intergovernmental Panel on Climate Change (IPCC) is putting on its new 3,676-page report released last month. “The choices we make in the next decade will determine our future,” the IPCC says. “Any further delay in concerted global action will miss a brief and rapidly closing window to secure a liveable future.”

It could hardly be plainer. The report is political advocacy barely masquerading as science.

The IPCC Working Group II report is not meant to be about policy; that’s the job of Working Group III, which has yet to produce its contribution to the sixth assessment report. “The focus of our new report is on solutions,” the IPCC says of the Working Group II report. “It highlights the importance of fundamental changes in society.” The solution to climate change, the IPCC claims, is renewable energy, circular economies, healthy diets, universal health coverage and social protection. The only surprise is that the IPCC didn’t include abolishing the Second Amendment in its climate catechism.

“Scientific evidence shows that addressing the risks and impacts of climate change successfully involves a more a diverse set of actors than previously thought” and involvespartnerships with “traditionally marginalized groups, including women, youth, Indigenous Peoples, local communities and ethnic minorities (high confidence).” How on earth did the IPCC exclude the LBGTQ+ community? “Different interests, values and worldviews can be reconciled if everyone works together,” the IPCC says. This isn’t science. It’s climate kumbaya.

Small islands were the poster child of net zero as they claimed they risked sinking beneath the waves thanks to rising sea levels. They successfully lobbied for the adoption of the target in the Paris climate agreement to limit the increase in global temperature to 1.5 degrees Celsius above pre-industrial levels. The IPCC therefore includes them in a list of global hotspots of high human vulnerability, asserting that their vulnerability will increase in the context of sea level rise. Yet only four years ago, the IPCC in its 1.5 degree Celsius special report stated that “observations, models and other evidence” indicate that unconstrained Pacific atolls have kept pace with sea level rises and that there had been “little reduction in size or net gain in land.”

In a blog post, Roger Pielke Jr. of the department of environmental studies at the University of Colorado Boulder notes that the IPCC lifts projections of future climate damages from studies that eliminate the choice of adapting to climate change, a practice Pielke calls “misleading at best.” Yet buried in the report is a study showing that adequate flood protection, i.e. adaptation, could avoid 95 percent of projected flood damages.

Thawing Permafrost Could Leach Microbes, Chemicals Into Environment

by C. Rotter, Mar 10, 2022 in WUWT


Scientists are turning to a combination of data collected from the air, land, and space to get a more complete picture of how climate change is affecting the planet’s frozen regions.

Trapped within Earth’s permafrost – ground that remains frozen for a minimum of two years – are untold quantities of greenhouse gases, microbes, and chemicals, including the now-banned pesticide DDT. As the planet warms, permafrost is thawing at an increasing rate, and scientists face a host of uncertainties when trying to determine the potential effects of the thaw.

paper published earlier this year in the journal Nature Reviews Earth & Environment looked at the current state of permafrost research. Along with highlighting conclusions about permafrost thaw, the paper focuses on how researchers are seeking to address the questions surrounding it.

Infrastructure is already affected: Thawing permafrost has led to giant sinkholes, slumping telephone poles, damaged roads and runways, and toppled trees. More difficult to see is what has been trapped in permafrost’s mix of soil, ice, and dead organic matter. Research has looked at how chemicals like DDT and microbes – some of which have been frozen for thousands, if not millions, of years – could be released from thawing permafrost.

Then there is thawing permafrost’s effect on the planet’s carbon: Arctic permafrost alone holds an estimated 1,700 billion metric tons of carbon, including methane and carbon dioxide. That’s roughly 51 times the amount of carbon the world released as fossil fuel emissions in 2019. Plant matter frozen in permafrost doesn’t decay, but when permafrost thaws, microbes within the dead plant material start to break the matter down, releasing carbon into the atmosphere.