Archives de catégorie : climate-debate

Sceptical covid-19 research and sceptical polar bear science: is there a difference?

by Polar Bear Science, September 6, 2020


This essay about medical researchers having trouble getting their papers published because the results don’t support the official pandemic narrative has disturbing parallels with my experience trying to inject some balance into the official polar bear conservation narrative.1 Especially poignant is the mention of models built on assumptions sold as ‘facts’ that fail once data (i.e. evidence) become available – which of course is the entire point of my latest book, The Polar Bear Catastrophe That Never Happened.

Read the commentary below, copied from Lockdownsceptics.org (6 September 2020). Bold in original, link added to the story to which this is a response, and brief notes and links added as footnotes for parallels with polar bear conservation science.

Challenging IChemE climate scaremongering

by D.  Wojick, September 2, 2020 in WUWT


The Institution for Chemical Engineers (IChemE) is a prestigious international group of scientists and professionals with over 35,000 members in about 100 countries. IChemE has been conducting what it calls a consultation on its draft Position Statement on Climate Change. This basically means that the members are invited to submit comments. Given that many engineers are skeptical of the climate scare, it will be interesting to see if all of these comments are made public.

The draft statement itself is pure alarmism. They say the science is settled, per the IPCC, and catastrophe looms. Here is the opening paragraph:

“Climate science is established – global climate change is upon us, exacerbated by human activities. IChemE accepts the veracity of the science and its conclusions published by the Intergovernmental Panel on Climate Change (IPCC). To avoid irreparable social, economic and environmental damage, it is essential that we accelerate our efforts to decarbonize our economic systems and stabilize the levels of greenhouse gases in the earth’s atmosphere, if we are to have any chance of limiting the global average temperature rise to 1.5 degrees C, beyond which catastrophic consequences are more likely. Action needs to be global and fair, recognizing the relative differences between regions, both in terms of historic contributions to emissions and vulnerability to the consequences of a warming planet.

Chemical engineers are uniquely placed to take action in the industries that contribute to greenhouse gas emissions to arrest and reverse the damage we humans are doing to the life support systems of our single, shared planet .” (Emphasis added).

Not only do they simply sing the IPCC song, they even get it wrong. Nowhere does the IPCC suggest that 1.5 degrees of warming (with one degree already on their books) is a threshold to catastrophe. In fact the Paris Accord target is still 2.0 degrees. The last sentence may explain IChemE’s fervent catastrophism. Its members are positioned to make huge sums of money doing the engineering to decarbonize the world. After all, CO2 emissions are typically the product of chemical reactions (including combustion).

An Unremarkable Summer

by P. Homewood, September 3, 2020 in NotaLotofPeopleKnowThat


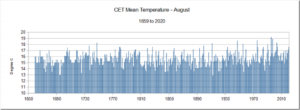
Despite a few warm days in early August, the month as a whole was not unusually hot, a full 1.6C cooler than August 1995, according to the Central England Temperature series. Other hotter Augusts include 1911, 1947 and 1975.

It was even colder than 1736 and 1899.

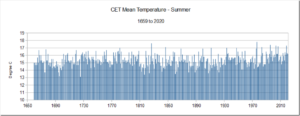
Summer as whole was even less remarkable, ranking 51st, tied with years such as 1701, 1731 and 1780.

The summers of 1976 and 1826 remain the two hottest on record, well above anything seen since.

https://www.metoffice.gov.uk/hadobs/hadcet/data/download.html

Que nous apprend l’Optimum Climatique Romain?

by A. Préat, 4 septembre 2020 in ScienceClimatEnergie


SCE a plusieurs fois rapporté que la période actuelle de réchauffement n’est pas exceptionnelle, qu’elle fait partie de cycles décennaux à pluriséculaires de refroidissement et réchauffement qui ont lieu dans des fourchettes de température fort modestes, de l’ordre de 0,15°C par 10 ans. SCE a aussi montré que le CO2 tant incriminé dans ces changements, et surtout l’actuel, n’avait pas de raison d’être, ce gaz venant après l’augmentation de température. Le ‘bouton CO2 ‘ à même d’expliquer ou de ‘justifier’ le battage médiatique quasi-quotidien est donc à ‘la remorque’ de la température et, l’hypothèse de l’effet de serre reste avant tout une hypothèse (exemple ici).

Enfin SCE a souvent rappelé (ici et ici) que la concentration atmosphérique de CO2 n’a jamais été aussi basse dans l’histoire géologique de notre planète, qui a connu la plupart du temps des  concentrations jusqu’à 25 fois supérieures au cours du Phanérozoïque (à partir du Cambrien, il y a 541 millions d’années), et même encore bien plus élevées au cours du Précambrien. Nous partirons de ce dernier point, puisque les médias et scientifiques sont toujours  à nous rappeler, de manière assez dramatique, que la teneur actuelle est plus élevée que celle des ‘derniers’ millions d’années (articles médiatiques presque quotidiens, exemple ici parmi une pléthore d’articles). Est-ce bien le cas? et si oui –et toujours pour ces ‘derniers’ millions d’années– quid de la température ?

About That Sharp Rise in Climate Concern

by Donna Laframboise, September 2, 2020 in BigPicturesNews


Poll sponsors say climate attitudes have been ‘remarkably consistent’ over two decades.

A few days ago, Scientific American reprinted an article straight from Climatewire. Titled Republican Convention Ignored Climate Threat, But Americans’ Attitudes Are Shifting, it says “Polling shows that voter concern about climate change has been growing for years and that it has not diminished as a result of the coronavirus pandemic.” We’re then told about a recent public opinion survey affiliated with Stanford University.

Debunking Popular Climate Myths About CO2

by N. Thorner, October 25, 2019 in ClimateChangeDispatch


If you believe the debate over global warming has ever been about science—or for that matter climate—you have been conditioned, through formal education or through reports warning of doom and gloom, to believe what others rightly describe as a world-wide hoax concocted to unite the world under a single socialistic government where there is no capitalism, no democracy, and no freedom.

Why is exposing the truth so important? Because it has everything to do with the redistribution of wealth and the establishment of political agendas aimed at destroying the foundation of eastern democracies and free markets.

Accordingly, it is therefore critical for everyone to become informed so free and open debate can exist, rather than the suppression and falsification of actual scientific climate data.

This article will expose some of the popular climate myths about CO2, so the reader will be equipped with ammunition to spread the truth to those who are willing to listen and have not yet become environmental extremists.

Links are included after each myth to substantiate information and to provide reference material for further interest and clarification.

The article was written using individual articles, with permission from my friend Jay Lehr, Ph.D., in which he exposed popular climate myths related to CO2. Jay Lehr is a Senior Policy Analyst for The International Climate Science Coalition.

Myth #1:  Carbon dioxide emissions cause catastrophic global warming.

Claim: Sea level rise from ice sheets track worst-case climate change scenario

by University of Leeds, September 1, 2020 in WUWT/Nature


Ice sheets in Greenland and Antarctica whose melting rates are rapidly increasing have raised the global sea level by 1.8cm since the 1990s, and are matching the Intergovernmental Panel on Climate Change’s worst-case climate warming scenarios.

So far, global sea levels have increased in the most part through a mechanism called thermal expansion, which means that volume of seawater expands as it gets warmer. But in the last five years, ice melt from the ice sheets and mountain glaciers has overtaken global warming as the main cause of rising sea levels.

Dr Ruth Mottram, study co-author and climate researcher at the Danish Meteorological Institute, said: “It is not only Antarctica and Greenland that are causing the water to rise. In recent years, thousands of smaller glaciers have begun to melt or disappear altogether, as we saw with the glacier Ok in Iceland, which was declared “dead” in 2014. This means that melting of ice has now taken over as the main contributor of sea level rise. “

###

Further information

The study, “Ice-sheet losses track high-end sea-level rise projections,” is published today (31 August) in Nature Climate Change.

View towards Icefjord in Ilulissat. Easy hiking route to the famous Kangia glacier in Greenland. The Ilulissat Icefjord seen from the viewpoint. Declared a UNESCO World Heritage Site in 2004. Photo taken in Greenland.

FRANCE BREAKS MONTHLY COLD RECORD

by Cap Allon, September 1, 2020 in Electoverse


Europe’s punishing late-summer cold front has been busy taking names across the western half of the continent.

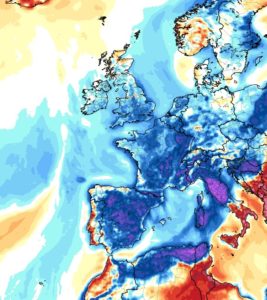
The UK has just suffered-through one of it coldest August Bank Holiday weekends ever recorded, the Alps and Pyrenees have recently received heavy summer snow, and now the French are reporting all-time record August lows:

As reported by meteo.bzh, a monthly cold record has just been broken at the Brest-Guipavas airport –located in NW France– where a minimum temperature of 5.8C (42.4F)was registered.

A plunging Arctic air mass was responsible — a phenomenon on the increase due to the historically low solar activity we’re receiving (see meridional jet stream flow). A lack of wind and the absence of cloud cover at night also contributed to the plummeting temps, according to meteo.bzh.

GFS 2m Temp Anomalies from Aug 31 [tropicaltidbits.com].

ANTARCTIC SEA ICE EXTENT IS CURRENTLY EXCEEDING THE 1981-2010 AVERAGE BY 233,000 KM2, AND GROWING!

by Cap Allon, August 30, 2020 in Electroverse


Climate alarmists take note: the ice locked within Antarctica is far more important to your hokey climate change theories than that which is contained in its northern cousin, the Arctic; the southern pole contains 90% of Earth’s ice.

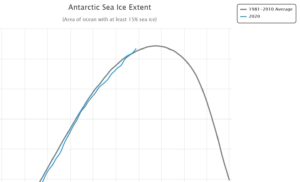
According to official government data from the National Snow & Ice Data Center (NSIDC), 2020’s Antarctic Sea Ice Extent has been increasing rapidly this month, to levels rarely seen since record-keeping began 4+ decades ago.

The latest data-point –from day 241 (or Aug 28)– reveals extent is currently standing at 18.354 million km2, compared with the 1981-2010 ‘day 241’ average of 18.131 million km2 — and by my crude calculations, that’s an AGW-destroying 233,000 km2 more:

[nsidc.org/arcticseaicenews/charctic-interactive-sea-ice-graph]

PROFESSOR VALENTINA ZHARKOVA: “WE ENTERED THE ‘MODERN’ GRAND SOLAR MINIMUM ON JUNE 8, 2020”

by Cap Allon, August 20, 2020 in Electroverse


A new editorial paper has landed from professor Valentina Zharkova, entitled: “Modern Grand Solar Minimum will Lead to Terrestrial Cooling“. Published on August 4, 2020, Zharkova’s latest analysis suggests that June 8, 2020 was the date on which we entered the Modern (Eddy) Grand Solar Minimum.

The opening paragraph reads:

“In this editorial I will demonstrate with newly discovered solar activity proxy-magnetic field that the Sun has entered into the modern Grand Solar Minimum (2020–2053) that will lead to a significant reduction of solar magnetic field and activity like during Maunder minimum leading to noticeable reduction of terrestrial temperature.”

Another passage states:

“Currently, the Sun has completed solar cycle 24 – the weakest cycle of the past 100+ years – and in 2020, has started cycle 25. During the periods of low solar activity, such as the modern grand solar minimum, the Sun will often be devoid of sunspots. This is what is observed now at the start of this minimum, because in 2020 the Sun has seen, in total, 115 spotless days (or 78%), meaning 2020 is on track to surpass the space-age record of 281 spotless days (or 77%) observed in 2019. However, the cycle 25 start is still slow in firing active regions and flares, so with every extra day/week/month that passes, the null in solar activity is extended marking a start of grand solar minimum.”

What are the consequences for Earth of this decrease of solar activity?

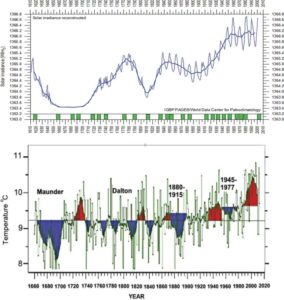
“From 1645 to 1710, the temperatures across much of the Northern Hemisphere of the Earth plunged when the Sun entered a quiet phase now called the Maunder Minimum. This likely occurred because the total solar irradiance was reduced by 0.22%,” shown below (top graph); “that led to a decrease of the average terrestrial temperature measured mainly in the Northern hemisphere in Europe by 1.0–1.5°C,” also below (bottom graph):

..

GRAND SOLAR MINIMUM INCOMING

by Cap Allon, August 27, 2020 in Electroverse


Solar Cycle 25 may be spluttering into life, but all is once-again quiet on the earth-facing solar disc: there are no sunspots — in fact, there haven’t been any for the past 6 days (as of Aug 27, 2020).

Solar activity is the driving force of Earth’s climate. This definition of obvious is only disputed by the misinformed, and by those with a financial or political motive.

High solar activity — as we’ve enjoyed for the past 100-or-so years — has delivered our planet a stable, predictable climate under-which we modern humans have had the opportunity to thrive and successfully advance our technological society.

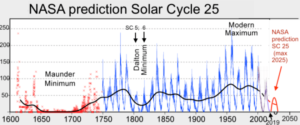
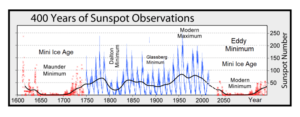
However, and as with all good things, these predictable days are ending: the Sun’s output is waning to levels not seen for the past 200 years, to a reduction in activity not experienced since the Dalton Minimum(1790-1830). And as with every great and advancing civilization of the past, a time comes when the consequences of a solar shutdown need to be contended. We need to prepare for the wild swings-between-extremes brought about by an increasingly weak & wavy (meridional) jet stream, we need to be aware of a powerful volcanic uptick witnessed during times of low solar activity, as well as cloud-nucleating Cosmic Rays, and, perhaps most crucially, an overall cooling of the planet.

Crops are always the first to go. And our modern delicately-balanced, chemical-dependent, monocropping-ways simply aren’t prepared for a violent shift in the climate — as Robert Felix has long been warning, “I fear that we will be fighting in the streets for food long before we’re covered by ice.”


When will Temperatures start to fall? Part1

by Tony Brown, August 28, 2020 in WUWT


“If Europeans truly mobilize around the delivery of the 2050 goal, every business decision, lifestyle choice, political swing, every hallmark of European culture — from annual ski trips, to Champions League Football matches, to French cheese — will need to be tested against its contribution to climate change.” European Commission ‘Green Deal’ March 2020

This is an article with a simple proposition.  Science tells us that rapidly rising Co2 in turn causes rising temperatures, which has become a very serious problem for humanity.

The three questions I ask, in the expectation that the answer can be provided from main stream published science is;

“Assuming we reach zero carbon emissions by 2030-Extinction Rebellion (XR) requirement,  or 2050 -the aim of most governments under the Paris Accord- 1) how long would it take for Co2 levels to naturally fall below the’ safe upper limits’ of 350ppm espoused by such as James Hansen; 2) for it to fall further to 280ppm -the previous pre industrial level -AND 3) when will temperatures start to fall in turn, to achieve pre industrial levels, said to be 1 to 2 degrees Centigrade below present, according to the IPCC.”

There are all sorts of caveats of course, with methane, water vapour, clouds, feedbacks, ocean response, natural variations etc but having scoured various ‘official’ web sites I can find no definitive estimate. An examination of the Extinction Rebellion web site demonstrates they are anarchists, rather than a serious green organisation. A couple of more reasoned attempts to track the consequences of zero carbon emissions are given in Note 3below the graphic-Figure 1 together with a variety of other useful background information.

Whether the reader personally believes excess Co2 to be a problem is not a matter this article is concerned with.  Let’s take science at face value –our respective Governments  have overwhelmingly agreed that humanity has added some 140ppm of Co2 to the pre industrial 280ppm and that, as a result, temperatures have risen substantially and are at a dangerous level and causing extremes of weather.

Le 20ème siècle a été anormalement chaud mais le 21èmesiècle revient à la normale (2/2)

by Jean Van Vliet, 22 août 2020 in ScienceClimatEnergie


Cet article fait suite à la première partie (1/2) publiée par SCE le 14 août 2020.

5. La longueur des cycles solaires

Le passage d’un cycle solaire au cycle suivant est défini en principe par le changement de signe du champ magnétique autour des taches solaires. Le moment de ce passage est difficile à déterminer dans le cas des cycles longs, parce qu’on peut avoir pendant plusieurs années cohabitation, dans le même hémisphère solaire, de taches solaires d’orientations magnétiques différentes. Ainsi, à l’heure d’écriture de cet article (juillet 2020), la fin du cycle solaire 24 se rapproche, mais les premières taches avec l’orientation magnétique du cycle 25 ont fait leur apparition dès 2019; si  le cycle 24 n’était pas terminé avant la fin de cette année, la transition du cycle 24 au cycle 25 serait étalée sur 3 années.

De manière à tirer profit de la richesse des données disponibles sur le site (ici)  la longueur des cycles solaires est déterminée comme suit: pour les cycles allant de 1700 à 1755, seules les moyennes annuelles du nombre de taches solaires sont disponibles et le début de cycle correspond à l’année suivant le minimum de cette moyenne. Pour les cycles allant de 1755 à nos jours, la longueur est déterminée en utilisant les moyennes mensuelles: le début de cycle correspond au mois à partir duquel s’amorce la montée du nombre de taches. Cette méthode diffère de celle utilisée par Friis-Christensen et Lassen [29] et Butler et Johnston [30] qui ont travaillé par interpolation au départ des valeurs mensuelles lissées sur 13 mois.

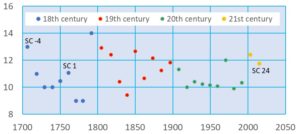
Comme nous allons le voir, la longueur des cycles solaires varie de 9 ans minimum (cycles 2, 3 et 8) à 14 ans (cycle 4 marquant le début du Minimum de Dalton et la Révolution française). La Figure 5 fournit les longueurs des 29 cycles solaires observés depuis le début du 18ème siècle, chaque valeur étant positionnée au milieu du cycle correspondant.  La figure suggère que la dispersion des cycles solaires va diminuant du 18ème au 20èmesiècle: de manière à préciser cette impression, on calcule dans le tableau suivant, pour chacun des siècles considérés, les longueurs moyennes des cycles solaires (en années) et leurs déviations standard.

Figure 5 : Longueur des 29 cycles solaires observés du 18ème au 21ème siècle.

Le résultat le plus frappant de ce tableau est que les cycles solaires du  20ème siècle sont en moyenne un an plus courts que ceux du 19ème siècle, la tendance s’inversant avec les 2 premiers cycles du 21ème siècle. En appliquant la corrélation de Butler et Johnston [24], ceci rendrait le 20ème siècle plus chaud de 0,5°C en moyenne que le 19ème siècle.

New confirmation that climate models overstate atmospheric warming

by Dr. Judith Curry, August 27, 2020 in WUWT


Reposted from Dr. Judith Curry’s Climate Etc.

Posted on August 25, 2020

by Ross McKitrick

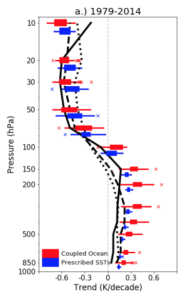
Two new peer-reviewed papers from independent teams confirm that climate models overstate atmospheric warming and the problem has gotten worse over time, not better.

The papers are Mitchell et al. (2020) “The vertical profile of recent tropical temperature trends: Persistent model biases in the context of internal variability” Environmental Research Letters, and McKitrick and Christy (2020) “Pervasive warming bias in CMIP6 tropospheric layers” Earth and Space Science. John and I didn’t know about the Mitchell team’s work until after their paper came out, and they likewise didn’t know about ours.

Mitchell et al. look at the surface, troposphere and stratosphere over the tropics (20N to 20S). John and I look at the tropical and global lower- and mid- troposphere. Both papers test large samples of the latest generation (“Coupled Model Intercomparison Project version 6” or CMIP6) climate models, i.e. the ones being used for the next IPCC report, and compare model outputs to post-1979 observations. John and I were able to examine 38 models while Mitchell et al. looked at 48 models. The sheer number makes one wonder why so many are needed, if the science is settled. Both papers looked at “hindcasts,” which are reconstructions of recent historical temperatures in response to observed greenhouse gas emissions and other changes (e.g. aerosols and solar forcing). Across the two papers it emerges that the models overshoot historical warming from the near-surface through the upper troposphere, in the tropics and globally.

Mitchell et al. 2020

Mitchell et al. had, in an earlier study, examined whether the problem is that the models amplify surface warming too much as you go up in altitude, or whether they get the vertical amplification right but start with too much surface warming. The short answer is both.

Astrophysicist Asserts The Globe Will Cool ~1°C During 2020-2053 Due To An Oncoming Grand Solar Minimum

by K. Richard, August 27, 2020 in NoTricksZone


During the last Grand Solar Minimum (17th century), global surface temperatures dipped to the coldest of the last 10,000 years – about 1.4°C colder than today. Dr. Zharkova, an astrophysicist, has determined another imminent drop in solar activity will lead to a 1°C cooling in the coming decades.

From 1645 to 1710, the Sun went into a quiet phase referred to as the Maunder Minimum. During this period, the “surface temperature of the Earth was reduced all over the Globe” (Zharkova, 2020). Cold summers and winters ensued, with glaciers extending onto farmland, sea ice expanding beyond the Arctic, and “frost fairs” on frozen rivers in Europe.
                                                                                                                                                       .
The coldest temperatures and most expansive ice extent (glaciers,  permafrost, sea ice) of the last 10,000 years occurred during both this period and the surrounding centuries – often referred to as the Little Ice Age (LIA) (Glazer et al., 2020Geirsdottir et al., 2019).

In a new paper, Dr. Valentina Zharkova asserts that during solar cycles 25-27, the Sun may return to a modern Maunder-like Grand Solar Minimum. This solar quiet phase is expected to substantially reduce the Earth’s solar magnetic field, which will, in turn, lead to an increase in cosmic rays extending into Earth’s atmosphere and thus an increase in high clouds reflecting the Sun’s radiation back to space.

The consequence? A reduction in global temperatures to just 0.4°C above what they were in 1710.

The role of atmospheric CO2 as a temperature-driving mechanism is not mentioned in the paper.

PBS Blames Hurricanes, Wildfires On Climate Change, Defying UN ‘Consensus’

by H.S. Burnett, August 20, 2020 in ClimateChangeDispatch


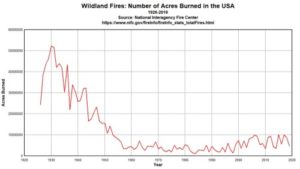
PBS News Hour attacked climate science this weekend, publishing alarmist claims about hurricanes and wildfires that defy findings of the United Nations Intergovernmental Panel on Climate Change (IPCC).

In an interview between PBS reporter Hari Sreenivasan and Andrew Freedman, editor of Washington Post’s Capital Weather Gang, the two journalists blamed global warming for severe wildfires and hurricanes.

According to the IPCC, however, there is little or no evidence indicating global warming is impacting hurricanes or drought.

Figure 1: Total wildfire acreage burned by year in the United States, 1926 to 2019. Data from NIFC. Graph by meteorologist Anthony Watts

Stop Blaming Climate Change For California’s Fires–Michael Schellenberger

by P. Homewood, August 26, 2020 in NotaLotofPeopleKnowThat


It’s Not About The Climate

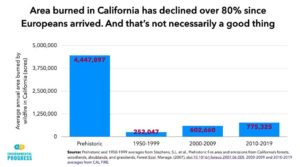
Nobody denies climate change is occurring and playing a role in warmer temperatures and heatwaves. Keeley notes that, since 1960, the variation in spring and summer temperatures explain 50% of the variation in fire frequency and intensity from one year to the next.

But the half-century since 1960 is the same period in which the U.S. government promoted, mostly out of ignorance, the suppression of regular fires which most forests need to allow for new growth.

For much of the 20th Century, U.S. agencies and private landowners suppressed fires as a matter of policy. The results were disastrous: the accumulation of wood fuel resulting in fires that burn so hot they sometimes kill the forest, turning it into shrubland.

The US government started to allow forests in national parks to burn more in the 1960s, and allowed a wider set of forests on public lands to burn starting in the 1990s.

“When I hear climate change discussed it’s suggested that it’s a major reason and it’s not,” Scott Stevens of the University of California, Berkeley, told me.

Redwood forests before Europeans arrived burned every 6 to 25 years. The evidence comes from fire scars on barks and the bases of massive ancient trees, hollowed out by fire, like the one depicted in The New York Times photograph.

“There was severe heat before the lightning that dried-out [wood] fuel,” noted Stevens. “But in Big Basin [redwood park], where fire burned every seven to ten years, there is a high-density of fuel build-up, especially in the forests.”

AUSTRALIA RECORDS ITS MOST SNOWFALL EVER OUTSIDE OF AN ALPINE AREA

by Cap Allon, August 25, 2020 in Electroverse


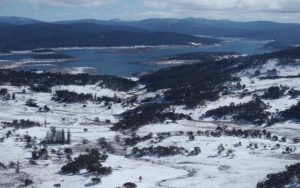
Antarctic air reaching Australia’s south east triggered snowfall down to low-lying regions across several states over the weekend and into Monday, with many people temporarily escaping house-arrest to enjoy the “once-in-a-15-year” event.

Heavy snow made for treacherous driving conditions near Old Adaminaby [Aug 23, 2020].


The town of Oberon received a record-breaking 20 cm (8 inches) of global warming goodness, the highest 24-hour snow total ever recorded outside of an Aussie alpine region. Traffic, predictably, was soon bumper-to-bumper through Hampton as tourists descended on Oberon to enjoy the snow–much to the chagrin of the local sheep. One Oberon resident reportedly bleated: “Let’s all go mingle with people from hot spots then risk taking something home. It will be so worth it.” And another jumbuck added: “I wonder what part of STAY AT HOME do all those idiots not understand.”

Scientists: It’s ‘Impossible’ To Measure Critical Cloud Processes…Observations 1/50th As Accurate As They Must Be

by K. Richard, August 20, 2020 in NoTricksZone


Clouds dominate as the driver of changes in the Earth’s radiation budget and climate. A comprehensive new analysis suggests we’re so uncertain about cloud processes and how they affect climate we can’t even quantify our uncertainty. 

According to scientists (Song et al., 2016), the total net forcing for Earth’s oceanic atmospheric greenhouse effect (Gaa) during 1992-2014 amounted to -0.04 W/m² per year. In other words, the trend in total longwave forcing had a net negative (cooling) influence during those 22 years despite a 42 ppm increase in CO2. This was primarily due to the downward trend in cloud cover that overwhelmed or “offset” the longwave influence from CO2.

Cloud impacts on climate are profound – but so are uncertainties

The influence of clouds profoundly affects Earth’s radiation budget, easily overwhelming CO2’s impact within the greeenhouse effect. This has been acknowledged by scientists for decades.

Despite the magnitude of clouds’ radiative impact on climate, scientists have also pointed out that our limited capacity to observe or measure cloud effects necessarily results in massive uncertainties.

For example, Stephens et al. (2012) estimated the uncertainty in Earth’s annual longwave surface fluxes is ±9 W/m² (~18 W/m²) primarily due to the uncertainties associated with cloud longwave radiation impacts.

Why Earth Overshoot Day And The Ecological Footprint Are Pseudoscientific Nonsense

by M. Schellenberger, August 23, 2020 in Forbes


Pour lire cet article en français, cliquez ici

Starting today through the end of the year, humankind will start consuming more resources than our planet can sustainably produce, according to the Global Footprint Network (GFN), which has been organizing such days since 1986.

“Humanity is using nature 1.75 times faster than our planet’s ecosystems can regenerate,” says the group. “This is akin to using 1.75 Earths.”

Rich nations “overshoot” their resources before poorer ones, according to GFN. The US, Australia, Denmark and Canada overshoot before the end of March, while Cuba, Nicaragua, Iraq, and Ecuador don’t overshoot until December.

“Earth Overshoot Day” is based on something called the “Ecological Footprint,” which is used by the World Wildlife Fund, the United Nations Environment Program, the United Nations Development Program’s Human Development Report, and the International Union for Conservation of Nature.

The Ecological Footprint has as much scientific merit as astrology, phrenology, and flat-earth theories. It’s time to treat the Ecological Footprint as the pseudoscientific theory it is.

An Industry Out of Control: 13 Major Climate Reports in 2020, and 42 Minor Reports

by E. Worrall, August 21, 2020 in WUWT


Yale Climate Connections has listed 13 major climate reports published this year, like it is a good thing. But at least 6 of the major reports received funding from US taxpayers.

The reports listed by Yale:

State of the Climate 2019: Special Supplement to the Bulletin of the American Meteorological Society, edited by J. Blunden and D.S. Arndt (BAMS 2020, 435 pages, free download available here; a 10-page executive summary is also available) – paid for by taxpayers via NOAA

The First National Flood Risk Assessment: Defining America’s Growing Risk, by Flood Modelers (First Street Foundation 2020, 163 pages, free download available here) – not sure who pays for First Street Foundation

World Water Development Report 2020: Water and Climate Change, by UN Water (UN Educational, Scientific, and Cultural Organization 2020, 235 pages, free download available here) – paid for by taxpayers via the United Nations.

The State of Food Security and Nutrition in the World 2020: Transforming Food Systems for Affordable Healthy Diets, by FAO, IFAD, UNICEF, WFP and WHO (United Nations 2020, 320 pages, free download available here) – paid for by taxpayers via United Nations.

WHO Global Strategy on Health, Environment, and Climate Change: The Transformation Need to Improve Lives and Wellbeing through Healthy Environments, by WHO (UN-WHO 2020, 36 pages, free download available here) – paid for by taxpayers via United Nations

Cooling Emissions and Policy Synthesis Report: Benefits of Cooling Efficiency and the Kigali Amendment, by UNEP-IEA (UNEP and IEA 2020, 50 pages, free download available here) – paid for by taxpayers via the United Nations

The 2035 Report: Plummeting Solar, Wind, and Battery Costs Can Accelerate Our Clean Electricity Future, by Sonia Aggarwal and Mike O’Boyle (Goldman School of Public Policy 2020, 37 pages, free download available here) – Goldman school was started by a charitable donation, so may still be privately funded.

Addressing Climate as a Systemic Risk: A Call to Action for U.S. Financial Regulators, by Veena Ramani (Ceres 2020, 68 pages, free download available here, registration required). Not sure who paid. Ceres Foundation is a tax exempt group based in Switzerland, who appear to function as a meta charity – they provide a vehicle for people who want to create a charitable fund without having to set everything up themselves.

Gender, Climate & Security: Sustaining Inclusive Peace on the Frontlines of Climate Change, by UN Women (UN Environment & Development Programs 2020, 52 pages, free download available here) – paid for by taxpayers via the United Nations.

Evicted by Climate Change: Confronting the Gendered Impacts of Climate-Induced Displacement, by Care International (Care International 2020, 33 pages, free download available here) – Care International receives a lot of funding from taxpayers via the EU and the United Nations.

Wildfires, Blackouts And High Gas Prices: Californians Fight Familiar Foes Amid Pandemic

by C. Rotter, August 20, 2020 in TheDailyCaller/WUWT


  • Wildfires are scorching California amid a massive heatwave, which is prompting citizens to consume more energy in hopes of staying cool. The increase in consumption resulted in rolling blackouts, as energy regulators managed an over-taxed energy grid. 
  • The wildfires and blackouts are also coming amid a severe economic downturn caused in part by government-imposed lockdowns designed to slow the spread of the coronavirus pandemic.
  • At the same time, a recent fuel tax increase is forcing Californians to pay more at the gas pump. California now has the highest gas prices in the country, data show. 

 See also Californian Wildfires–Due To Climate Change?

ANTARCTIC FRONT TO DELIVER “ONE-IN-15-YEAR WEATHER EVENT” TO NEW SOUTH WALES

by Cap Allon, August 20, 2020 in Electroverse


People do the best they can with the information they have, but it appears to me, and Charles Bukowski, that the problem with the world is that the intelligent people are full of doubt, while the stupid people are full of confidence.

HEAVY SNOW is set to bury large swathes of NSW and the ACT over the next few days in what the Bureau of Meteorology is calling a “one-in-15-year weather event”, and what Electroverse posits is an addition to the ever-mounting pile of evidence which suggests anthropogenic global warming is a politicized, data-spun lie.

A large mass of Antarctic air is on course to blast the eastern half of Australia with blizzards, wild winds, and record-breaking low temperatures as it breaks-away from the ice continent and rides anomalously-far north on the back of a weak & wavy (meridional) jet stream (a phenomenon associated with the historically low solar activity we’re currently receiving).

Let’s Be Serious, More C02 Isn’t Making the Earth ‘Uninhabitable’

by  D. Simon, August 17, 2020 in RealClearMarkets


Former Federal Reserve Board Vice Chairman and Princeton University economist Alan Blinder recently wrote the following in the Wall Street Journal: “cumulative CO2 emissions heat up the atmosphere, causing climate changes of all sorts—most of them bad. Because this huge negative externality has been allowed to run rampant, we are gradually making the Earth an inhospitable place for humans.”

Increasing CO2 emissions have been “making the Earth an inhospitable place for humans?” Really?