Archives par mot-clé : 2018

THE FUTILITY OF WESTERN DE-CARBONISATION

by Ed. Hoskins, June 18, 2019  in GWPF


It is clear that CO2 emissions are continuing to grow incrementally in the Developing World.  This should be anticipated to continue indefinitely.

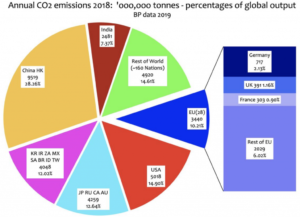
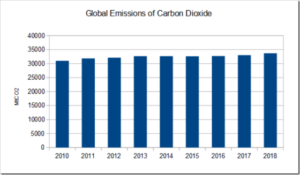
2018 Global CO2 emissions

The following calculations and graphics are based on information on worldwide CO2 emissions published by BP in June 2019 for the period from 1965 up until the end of 2018.

The pie diagram above shows the proportion of CO2 emissions as of the end of 2018.

The previous post for the end of 2017 is available here

The data showing the progress of CO2 emissions by 2018 in the Developed and Developing worlds can be summarised as follows:

Statistical Review of World Energy

by BP, June 15, 2019


Global primary energy consumption grew rapidly in 2018, led by natural gas and renewables. Nevertheless, carbon emissions rose at their highest rate for seven years

Energy developments

  • Primary energy consumption grew at a rate of 2.9% last year, almost double its 10-year average of 1.5% per year, and the fastest since 2010.
  • By fuel, energy consumption growth was driven by natural gas, which contributed more than 40% of the increase. All fuels grew faster than their 10-year averages, apart from renewables, although renewables still accounted for the second largest increment to energy growth.
  • China, the US and India together accounted for more than two thirds of the global increase in energy demand, with US consumption expanding at its fastest rate for 30 years.


Carbon emissions

  • Carbon emissions grew by 2.0%, the fastest growth for seven years.

ENERGY SUPERPOWER USA: SHALE OIL & GAS HIT RECORD PRODUCTION LEVELS IN 2018

by GWPF, June 12, 2019 in TheWallStreetJournal


World-wide energy demand grew at its fastest rate since 2010

The shale revolution powered U.S. oil and gas production in 2018 to the largest annual increases ever recorded by any country, according to energy giant BP PLC .

Surging global energy demand is fueling the production boom, even as oil and gas prices rise and economic growth slows, said BP’s annual statistical review published Tuesday.

World-wide demand for energy grew 2.9% in 2018, its fastest rate since 2010.

Unusual weather spurred some of the stronger-than-expected growth, as a greater number of extremely hot and cold days drove up air conditioning and heating use around the world, particularly in China, the U.S. and Russia, the company said.

In the U.S., energy consumption rose by 3.5% in 2018, with oil at 20.5 million barrels a day and a total of 817 billion cubic meters of gas consumed during the year.


Les pays du G20 ont augmenté leur consommation énergétique et leurs émissions de CO2 en 2018

by Eva Gomez, 28 mai 2018 in EnvironnementMagazine


Ce mardi 28 mai, le bureau d’études Enerdata publie son bilan énergétique mondial pour l’année 2018. Celui-ci fait part d’une hausse et de nouveaux records de consommation d’énergie et d’émissions de CO2.

En 2018, les pays du G20 ont vu leur consommation d’énergie augmenter de 2,1% et leurs émissions de CO21 de 1,7%, conclut Enerdata ce mardi 28 mai. Dans son nouveau bilan énergétique mondial, le bureau d’étude souligne que la croissance économique reste stable (+3,8%) dans les pays du G20, qui affichent néanmoins un niveau record de consommation énergétique. Dans l’Union européenne, les consommations d’énergie ont un peu diminué, mais cette baisse est compensée par une hausse de celles des Etats-Unis et des pays non membres de l’OCDE. « La consommation énergétique des USA a fortement augmenté, ce qui peut s’expliquer par les conditions climatiques extrêmes auxquelles ils ont été soumis, dont l’hiver très froid qui a demandé beaucoup de chauffage », explique le président d’Enerdata, Pascal Charriau. Par ailleurs, il semblerait que « le développement économique se fasse de façon énergivore : même si on observe un léger gain d’intensité énergétique, l’efficacité énergétique n’est pas améliorée », souligne-t-il.

Greenland Temperature Data For 2018

by P. Homewood, April 24, 2019 in NotaLotOfPeopleKnowThat


The DMI has just published its Greenland Climate Data Collection for last year, and it is worth looking at the temperature data:

There are six stations with long records, Upernavik, Nuuk, Ilulissat, Qaqortoq, Narsarsuaq and Tasilaq.

Throughout Greenland we find that temperatures in the last two decades are little different to the 1920s to 60s.

The only exceptions were 2010 on the west coast sites, which was an unusually warm year, and 2016 on the east coast at Tasilaq, another warm year there.

Noticeably, last year was actually colder than the 1981-2010 average at all of the west and south coast stations.


The big Arctic Sea-Ice shift of 2007: Ice refuses to melt

by Javier, April 23, 2019 in WUWT


I have maintained since 2015 that in the 2006-2007 season the Arctic underwent a cyclical phase shift, and the rapid sea-ice melting observed over the previous decades ended. A few scientists predicted or explained this shift based on their study of multi-decadal oscillations (see bibliography). They were ignored by mainstream climatology and the press because the “anthropogenic” melting of the Arctic is one of the main selling points of the climate scare. See for example:

Year after year the data supports my view over the desperate scaremongers like Tamino. With the passing of time it is more and more difficult to defend the idea that Arctic melting is continuing, so alarmists keep changing the metric. First it was September sea-ice extent (SIE), then September sea-ice volume, and now annual average SIE. However, the reference measurements are September minimum SIE and March maximum SIE.

This article is more than a biannual update on the Arctic ice situation, as I will focus specifically on showing evidence for the trend change that took place in 2007. As 12 years have passed since the shift, the best way is to compare the 2007-2019 period with the previous 1994-2006 period of equal length to display the striking differences between both periods.

Figure 1. Changes in September SIE for both periods as a percentage change over the first year of the period.

Global Energy & CO2 Status Report

by IEA, March 2019 (.pdf)


Key Findings 2018

Global energy consumption in 2018 increased at nearly twice the average rate of growth since 2010, driven by a robust global economy and higher heating and cooling needs in some parts of the world. Demand for all fuels increased, led by natural gas, even as solar and wind posted double-digit growth. Higher electricity demand was responsible for over half of the growth in energy needs. Energy efficiency saw lacklustre improvement.

Energy-related CO2 emissions rose 1.7% to a historic high of 33.1 Gt CO2. While emissions from all fossil fuels increased, the power sector accounted for nearly two-thirds of emissions growth. Coal use in power alone surpassed 10 Gt CO2, mostly in Asia. China, India, and the United States accounted for 85% of the net increase in emissions, while emissions declined for Germany, Japan, Mexico, France and the United Kingdom.

Oil demand rose by 1.3% in 2018, led by strong growth in the United States. The start-up of large petrochemical projects drove product demand, which partially offset a slowdown in growth in gasoline demand. The United States and China showed the largest overall growth, while demand fell in Japan and Korea and was stagnant in Europe.

Natural gas consumption grew by an estimated 4.6%, its largest increase since 2010 when gas demand bounced back from the global financial crisis. This second consecutive year of strong growth, following a 3% rise in 2017, was driven by growing energy demand and substitution from coal. The switch from coal to gas accounted for over one-fifth of the rise in gas demand. The United States led the growth followed by China.

Coal demand grew for a second year, but its role in the global mix continued to decline. Last year’s 0.7% increase was significantly slower than the 4.5% annual growth rate seen in the period 2000- 10. But while the share of coal in primary energy demand and in electricity generation slowly continues to decrease, it still remains the largest source of electricity and the second-largest source of primary energy.

Higher energy demand drove up global CO2 emissions in 2018

by IEA, April 7, 2019


Higher energy demand drove up global CO2 emissions in 2018
We released our second annual report on global energy trends last week, highlighting that energy demand worldwide grew by 2.3% in 2018, its fastest pace this decade, thanks to a strong global economy and higher demand for heating and cooling.
Natural gas emerged as the fuel of choice, posting the biggest gains and accounting for 45% of the rise in energy consumption. Solar and wind generation grew at double-digit pace, with solar alone increasing by 31%. Still, that was not fast enough to meet higher electricity demand around the world that also drove up coal use.

As a result, global energy-related CO2 emissions rose by 1.7% to 33 Gigatonnes (Gt) with coal use in power generation alone surpassing 10 Gt and accounting for a third of total emissions. The majority of that was from coal-fired generation capacity in Asia, with a fleet of young power plants that are decades short of average lifetimes of around 50 years.

State of the Climate 2018

by Prof. Ole Humlum, April 2 , 2019 in GWPF


That’s according to Norwegian Professor Ole Humlum whose annual review of the world’s climate is published today by the Global Warming Policy Foundation.
 
Last week, the WMO issued its own review of the climate, which insinuated that global warming was worsening. However, Professor Humlum points out that the data tells a very different story:
 
“Reading the WMO report, you would think that global warming was getting worse. But in fact it is carefully worded to give a false impression. The data are far more suggestive of an improvement than a deterioration.”
 
And the lack of anything to be alarmed about is clear across a range of measures, says Professor Humlum:
 
“After the warm year of 2016, temperatures last year continued to fall back to levels of the so-called warming “pause” of 2000-2015. There is no sign of any acceleration in global temperature, hurricanes or sea-level rise. These empirical observations show no sign of acceleration whatsoever.”


Professor Humlum’s key findings:
 

  • In 2018, the average global surface temperature continued a gradual descent towards the level characterising the years before the strong 2015–16 El Niño episode. 
  • Since 2004, when the Argo floats came into operation, the global oceans above 1900m depth have on average warmed somewhat. The maximum warming (between the surface and 120 m depth) mainly affects oceans near the equator, where the incoming solar radiation is at a maximum. In contrast, net cooling has been pronounced for the North Atlantic since 2004.
  • Data from tide gauges all over the world suggest an average global sea-level rise of 1– 1.5 mm/year, while the satellite record suggests a rise of about 3.2 mm/year. The large difference between the two data sets still has no broadly accepted explanation.
  • The Northern Hemisphere snow cover extent has undergone important local and regional variations from year to year. The overall global tendency since 1972, however, is for overall stable snow extent.
  • Tropical storm and hurricane accumulated cyclone energy (ACE) values since 1970 have displayed large variations from year to year, but no overall trend towards either lower or higher activity. The same applies for the number of hurricane landfalls in the continental United States, for which the record begins in 1851.

see also here

In 2018, U.S. coal exports were the highest in five years

by EIA, March 27, 2019


While U.S. coal consumption has generally declined since its 2008 peak, EIA expects that U.S. coal exports reached 116 million short tons (MMst) in 2018, the highest level in five years, based on foreign trade data collected by the U.S. Census Bureau. Exports of coal from the United States have increased since 2016 as international prices have made it more economic for U.S. producers to sell coal overseas.

In 2018, the United States exported 15% of its coal, and the remaining 85% was sold to end-use markets, primarily power sector and industrial customers. Coal exports have increased during the past two years, driven by increasing international coal demand, and in 2018 accounted for the largest share of total U.S. coal disposition on record. The United States exported 54 MMst of steam coal and 62 MMst of metallurgical coal in 2018, based on export data collected by the U.S. Census Bureau.

Global CO2 Emissions Rose By 1.7% Last Year, As Energy Demand Climbs

by P. Homewood, March 26, 2019 in NotaLotofPeopleKnowThat


Energy demand worldwide grew by 2.3% last year, its fastest pace this decade, an exceptional performance driven by a robust global economy and stronger heating and cooling needs in some regions. Natural gas emerged as the fuel of choice, posting the biggest gains and accounting for 45% of the rise in energy consumption. Gas demand growth was especially strong in the United States and China.

Demand for all fuels increased, with fossil fuels meeting nearly 70% of the growth for the second year running. Solar and wind generation grew at double-digit pace, with solar alone increasing by 31%. Still, that was not fast enough to meet higher electricity demand around the world that also drove up coal use.

As a result, global energy-related CO2 emissions rose by 1.7% to 33 Gigatonnes (Gt) in 2018. Coal use in power generation alone surpassed 10 Gt, accounting for a third of the total increase. Most of that came from a young fleet of coal power plants in developing Asia. The majority of coal-fired generation capacity today is found in Asia, with 12-year-old plants on average, decades short of average lifetimes of around 50 years.


GREENLAND ICE SHEET SIXTH HIGHEST ON RECORD

by GWPF, December 7, 2019


In 2018, Greenland’s total  surface mass budget (SMB) is almost 150bn tonnes above the average for 1981-2010, ranking as sixth highest on record.


The Danish Meteorological Institute (DMI) also performs daily simulations of how much ice or water the Ice Sheet loses or accumulates. Based on these simulations, an overall assessment of how the surface mass balance develops across the entire Ice Sheet is obtained (Fig. 4).

At the end of the 2018 season (31 August 2018), the net surface mass balance was 517 Gt, which means that 517 Gt more snow fell than the quantity of snow and ice that melted and ran out into the sea.

WORLD COOLING – BUT RAPID WARMING FORECAST

by David Whitehouse, February 7, 2019 in GWPF


Average global temperature has been falling for the last 3 years, despite rising atmospheric CO2 levels.


2018 was the fourth warmest year of the instrumental period (started 1850) having a temperature anomaly of 0.91 +/- 0.1 °C – cooler than 2017 and closer to the fifth warmest year than the third. But of course there are those that don’t like to say the global surface temperature has declined.

Les émissions de CO2 des États-Unis en forte hausse en 2018

by Connaissance des Energie, 22 janvier 2019


Après trois années de baisse, les émissions américaines de CO2 liées à l’énergie auraient augmenté de 3,4% en 2018 selon les dernières estimations du cabinet Rhodium Group. Explications.

Une hausse des émissions malgré la baisse de consommation de charbon

Les émissions américaines de CO2 liées à l’énergie auraient connu en 2018 (+ 3,4%) leur deuxième plus forte hausse annuelle des deux dernières décennies, après 2010 (+ 3,8% dans un contexte de reprise économique après la crise de 2008) selon les dernières estimations de Rhodium Group publiées le 8 janvier.

La consommation de charbon a pourtant significativement baissé aux États-Unis en 2018 selon l’EIA. Dans le secteur électrique, le « King Coal » s’efface peu à peu au profit du gaz naturel, plus compétitif (avec l’exploitation du gaz de schiste) : la part du charbon dans la production nationale d’électricité aurait atteint 28% en 2018 (et pourrait encore diminuer à 26% en 2019), contre 35% pour le gaz naturel selon le Short-Term Energy Outlook de l’EIA publié en décembre dernier.

Is the forecasted El Niño for this year fading away? It sure looks that way.

by Anthony Watts, January 8, 2019 in WUWT


In late 2018, there were some predictions that there would be a significant El Niño event in 2019. There were strong hints of an El Niño event in both SST data and forecasts. In an April 6th 2018 essay, Bob Tisdale suggested  “Looks like one may be forming right now.”

But if we look at the animation provided by NOAA’s Climate prediction center, it sure looks like it has been fading:

Arctic Sea Ice Extent Higher Than 2006 Last Month

by P. Homewood, January 9, 2019 in NotaLotofPeopleKnowThat


Just last March, the Guardian was trying to panic us about record lows in Arctic sea ice during last winter.

Back in the real world, DMI confirm that average Arctic sea ice extent in December was higher last month than in 2006. In reality, there has been very little change at all since 2005.

http://ocean.dmi.dk/arctic/icethickness/txt/IceVol.txt


UK Climate Trends – 2018

by P. Homewood, January 4, 2019 in NotaLotofPeopleKnowThat


The Met Office has now published its data for 2018. We can expect plenty of claims about last year being the 7th warmest in the UK since records began (in 1910). Or that all of the ten warmest years have occurred this century.

The real significance of these latest numbers, however, is that they continue to confirm that UK temperatures stopped rising more than a decade ago, after a step up during the 1990s.


https://www.metoffice.gov.uk/climate/uk/summaries/actualmonthly…