Archives par mot-clé : Wrong Prediction(s)?

Uncertain Certainty: Germany’s Potsdam Climate Institute Humiliated After One-Year El Nino Forecast Model Flops

by P. Gosselin, Nov 15, 2020 in WUWT


Last year Germany’s Potsdam Institute (PIK) boasted that it had a superior El Niño one-year forecasting model, claiming 80% certainty. Today, a year later, its forecast emerges totally wrong and the prestigious institute is left humiliated. 

Hat-tip: Snowfan

In 2019, Germany’s Potsdam Climate Institute (PIK) boasted that it had a superior El Niño forecasting model, claiming one year in advance and with 80% certainty, there would be an El Niño event late in 2020 (upper curve is just an El Niño illustration). But the PIK model forecast flopped totally. The opposite has in fact emerged. Chart source: BOM (with additions).

One year ago, together with researchers of the Justus Liebig University Giessen (JLU), and Bar-Ilan University in Ramat Gan in Israel, Germany’s alarmist yet highly regarded Potsdam Institute for Climate Research (PIK) boldly declared in a press release there would “probably be another ‘El Niño’ by the end of 2020.”

NASA’S JAMES HANSEN, 1989: “NEW YORK CITY’S WEST SIDE HIGHWAY WILL BE UNDERWATER BY 2009”

by Cap Allon, Nov 5, 2020 in Electroverse


NASA climate scientist James Edward Hansen is where all this nonsense started–or at least he’s the one responsible for devising the hokey theory politicians, activists, and political-activists would go on to fall-for/exploit for decades to come.

“The greenhouse effect is here,” pronounced Hansen back on June 23, 1988 during his Congressional testimony on man-made global warming — an announcement that “shook the political establishment,” reported grist.org. George H. W. Bush, in the middle of a heated presidential campaign, vowed to use the “White House effect” to battle the “greenhouse effect.”

Hansen had told the Senate Energy and Natural Resources Committee there is only a “1 percent chance” that he is wrong in blaming rising temperatures around the world on the buildup of man-made gases in the atmosphere.

A 1 percent chance that he is wrong?

In a field as complex and unknown as Earth’s climate?

When many of his peers and even colleagues at the time were already casting doubt on his assumptions and “leaps”?

Something was off from the very start.

And so to highlight what a soothsayer James Edward Hansen is not, I’ve compiled a few of the man’s ludicrous -and in many cases laughable- predictions below–oh, and I’ve assumed Hansen applied a 99 percent probability to all of his prophesies, because, well, why wouldn’t he of… the man presents all the confidence of one in contact with a divine being.

HANSEN, 1989: “NEW YORK CITY’S WEST SIDE HIGHWAY UNDERWATER BY 2009”

Perhaps the dumbest article title ever: “The Arctic hasn’t been this warm for 3 million years”… AEUHHH???

by D. Middleton, Nov 6, 2020 in WUWT


The sad thing is that this was apparently written by two geoscience professors.


Figure 1. “The oxygen isotopes in the ice imply that climate was stable during the last interglacial period, with temperatures 5 °C warmer than today.” North Greenland Ice Core Project members, 2004

How to Scare and Deceive without Lying: JPL Cries Wolf about Polar Glacial Melt

by C. Beisner, Nov 6, 2020 in WUWT


Yesterday NASA’s Jet Propulsion Laboratory published “The Anatomy of Glacial Ice Loss.” For the most part it’s an interesting, though not particularly revolutionary, discussion of the various forces that add to and subtract from glacial ice. Nothing wrong with that.

But its authors took the opportunity to insert a poison pill, a little bit of fearmongering, in a video caption:

Did you catch that little trick? “Combined, the two regions also contain enough ice, that if it were to melt all at once, would raise sea levels by nearly 215 feet ….”

Well, yes, but at what rate is the ice from the two regions melting, and at what rate can we, with any confidence, predict they’ll continue to melt, and over what period of time?

There is absolutely no chance of their melting “all at once”—barring, I suppose, Earth’s collision with some enormous asteroid that sends Earth careening into the Sun!

So, how fast is the ice melting?

For Greenland, about 0.1% of its ice mass per decade—1 percent per century.

For Antarctica, about 0.0045% per decade—1% in 2,200 years.

Combined, those contribute to sea-level rise of about 1 mm per year, i.e., 3.94 inches per century.

(See “Lying with Statistics: The National Climate Assessment Falsely Hypes Ice Loss in Greenland and Antarctica.”)

So, if the actual rate is about 3.94 inches (0.3283 foot) per century, how long would it take to raise sea level by 215 feet? The answer: 215 ft. / 0.3283 ft. per century = 654.889 centuries, or 65,488.9 years.

Climate Scientists Admit Clouds are Still a Big Unknown

by E. Worrall, Sep 12, 2020 in WUWT


The authors assert that if we had a better understanding clouds, the spread of model predictions could be reduced. But there is some controversy about how badly cloud errors affect model predictions, and that controversy is not just limited to climate alarmists.

Pat Frank, who produced the diagram at the top of the page in his paper “Propagation of Error and the Reliability of Global Air Temperature Projections“, argues that climate models are unphysical and utterly unreliable, because they contain known model cloud physics errors so large the impact of the errors dwarfs the effect of rising CO2. My understanding is Pat believes large climate model physics errors have been hidden away via a dubious tuning process, which adds even more errors to coerce climate models into matching past temperature observations, without fixing the original errors.

Climate skeptic Dr. Roy Spencer disagrees with Pat Frank; Dr. Spencer suggests the cloud error biases hilighted by Pat Frank are cancelled out by other biases, resulting in a stable top of atmosphere radiative balance. Dr. Spencer makes it clear that he also does not trust climate model projections, though for different reasons to Pat Frank.

Other climate scientists like the authors of the study above, Paulo Ceppi and Ric Williams, pop up from time to time and suggest that clouds are a significant problem, though Paulo and Ric’s estimate of the scale of the problem appears to be well short of Pat Frank’s estimate.

Whoever is right, I think what is abundantly clear is the science is far from settled.

The Dirty Dozen Tests Of Global Warming Science

by G.H. Sherrington, Sep 11, 2020 in WUWT


Assume for discussion that there has been a change of 1⁰C in the customary global near-surface air temperature, GAST, over the last century. There have been many assertions that this has produced changes. The strength of assertions is greater when a mathematical relation between temperature and the alleged change is established. Here are some relationships to ponder, for the last century or for a significant or available shorter time.

For a 1C change in global temperature –

  1. By how many millimeters does the sea level surface height change?

  2. By how many ppm does atmospheric CO change?

  3. By how many tonnes does the weight of terrestrial vegetation, like forests, change?

  4. By how much does the pH of the oceans change?

  5. By how many sq km does the average area of cloud cover change?

  6. What change is there to the accumulated cyclone index, ACE?

  7. What is the net change to the globalnumber of –

    1. Birds
    1. Land animals
    1. Marine algae
  8. By how many Watt per square metre does the Top of Atmosphere TOA radiation balance change?

  9. By how many tonnes does the weight of ice change –

    1. Over land
    1. Floating on sea
    1. Grounded over sea
  10. By how much does total precipitable rainfall TPW change?

  11. By what number does the number of large bush fires change?


By how many tonnes do yields of major food crops change, expressed as tonnes available per person, for example

….

NASA “CLIMATE PROPHET” JAMES HANSEN SAID THE ARCTIC WOULD BE “FREE OF SUMMER ICE” BY 2018

by Cap Allon, August 2, 2020 in Electroverse


Bolstered by the sycophantic-praise he received following his 1988 Congressional testimony on man-made global warming, NASA climate scientist/activist James Edward Hansen continued his prophesies well into the 2000s–despite his ever-growing list of climate fails.

“The greenhouse effect is here,” pronounced doomsayer Hansen back on June 23, 1988.

“We’re [still] toast,” he repeated with a straight face 20 years later, in 2008.

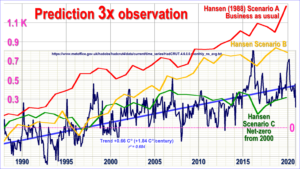
in preparation for his 1988 Congressional testimony, scientists/activist Hansen produced three potential scenarios regarding the future trend for global average temperatures:

A) “Business As Usual” — if human’s did nothing regarding rising CO2 levels.

B) If we “moderately” reduced CO2 emissions.

C) If atmospheric carbon dioxide was reduced to year 2000 levels.


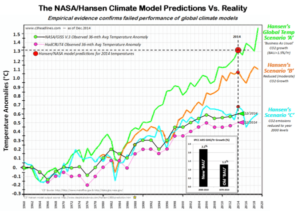
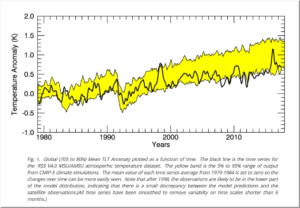
Real-world observations reveal Hansen’s projections were way off. Scenarios A and Bsignificantly over-predict the warming trend. And digging into the data, A overstates CO2 and other greenhouse gas growth and rejects against the observations; Scenario B slightly understates CO2 growth, overstates methane and CFCs and zeroes-out other greenhouse gas growth, and it too significantly overstates the warming.

The scenario that best-matches the observations is C — the one where Hansen has CO2 topping-out at 368 ppm in 2000 but then sees it fixed at that level thereafter–something that obviously didn’t happen. It’s this drastic “halt the industrial revolution” scenario that ended up with a warming trend most like the real-world observations.

Here is one thought, proposed by climate scientist John Christy:

Suppose Hansen had offered a Scenario D, in which greenhouse gases continue to rise, but after the 1990s they have very little effect on the climate. That would play out similarly in his modeled Scenario C, and it would match the data — this hypothetical Scenario D is the reality we’re living today.

James Edward Hansen is still considered a “climate prophet” by many, but his 1988 scenarios simply DO NOT FIT THE DATA–speaking of which, let’s look at his Arctic sea ice predictions.


Peter Ridd loses, we all lose

by J. Marohasy, July 23, 2020 in TheSpectator


On 2 May 2018, Professor Peter Ridd was sacked by James Cook University for serious misconduct. It all started when he called-out his colleague Terry Hughes for falsely claiming healthy inshore coral reefs were dead from climate change and deteriorating water quality.

Ignoring the first censure in April 2016, Professor Ridd went on television in August 2017 and explained in an interview with Alan Jones and Peta Credlin why so much said and written about the Great Barrier Reef, including by scientists at the Australian Institution of Marine Science, is ‘untrustworthy’.

The interview was to promote a book that I edited, Climate Change: The Facts 2017. The book, published by the Institute of Public Affairs, begins with a chapter about the Great Barrier Reef in which the orthodoxy on Great Barrier Reef science is challenged, in particular reporting on coral calcification rates. In that interview – that contributed directly to Peter Ridd’s sacking – the main argument was, and continues to be, for better quality assurance of coral reef science.

It is a fact that the Australian Institute of Marine Science refuses to release 15 years of coral growth data – because it contradicts the claims of high-profile activists that coral growth rates are in decline. They are not. But the false claims are central to their fundraising strategy. Never mind the truth.

Also: from GWPF, July 27 2020

Climate Hysteria Has Killed Academic Freedom

Censorship Universities May Not Receive Bail Out Funding

Greenpeace Cofounder: ‘There Is No Climate Catastrophe – It’s A Lie’

by 21Wire, July 24, 2020 in ClimateChangeDispatch


Power Hour host Alex Epstein  discusses the alleged ‘climate catastrophe’ with Dr. Patrick Moore, ecologist and co-founder of Greenpeace. 

Incredibly, Moore completely eviscerates the concept of “climate catastrophism,” and dismantles the claim that man-made CO2 levels are warming the planet beyond a tipping point of human survival.

Moore makes a number of strong arguments that debunk the IPCC’s increasingly problematic pseudo-scientific and anti-human narrative which is being parroted by climate change activists and the likes of Greta Thunberg.

He explains:

  • Why Moore left Greenpeace.

  • The beginnings of the climate catastrophe movement.

  • Why Moore believes human beings would not only survive but survive better at far higher average temperatures (which would be concentrated toward the poles).

  • Why Moore believes that contrary to being in a Sixth Extinction, we are actually at an unprecedented time of biodiversity with no end in sight.

  • Why Moore believes “ocean acidification” claims are totally meritless.

  • The commonality among the opposition to plastics, GMOs, nuclear energy, and fossil fuels.

  • Moore’s unrefuted theory that human beings actually saved life on Earth from a terminal decline in CO2 levels.

Watch this highly informative interview:

Latest Polar Bear Scare Shredded By Susan Crockford

by P. Homewood, July 22, 2020 in NotaLotofPeopleKnowThat


Apparently, a prediction that polar bears could be nearly extinct by 2100 (which was first suggested back in 2007) is news today because there is a new model. As for all previous models, this prediction of future polar bear devastation depends on using the so-called ‘business as usual’ RCP8.5 climate scenario, which has been roundly criticized in recent years as totally implausible, which even the BBC has mentioned. This new model, published today as a pay-walled paper in Nature Climate Change, also did something I warned against in my last post: it uses polar bear data collected up to 2009 only from Western Hudson Bay – which is an outlier in many respects – to predict the response of bears worldwide. The lead author, Peter Molnar, is a former student of vocal polar bear catastrophist Andrew Derocher – who himself learned his trade from the king of polar bear calamity forecasts, Ian Stirling. Steven Amstrup, another co-author of this paper, provided the ‘expert opinion’ for the failed USGS polar bear extinction model featured in my book, The Polar Bear Catastrophe That Never Happened.

Well, these authors and their supporters got the headlines they crave, including coverage by outlets like the BBC and New York Times (see below) but I have to say that the combination of using out-of-date Western Hudson Bay information on when polar bears come ashore in summer and leave for the ice in fall (only to 2009) to make vague projections (‘possible’, ‘likely’, ‘very likely’) about all other subpopulations in addition to depending on the most extreme and now discredited RCP8.5 climate scenario (Hausfather and Peters 2020) for this newest polar bear survival model is all that’s needed to dismiss it as exaggerated-fear-mongering-by-proxy. Why would anyone believe that the output of this new model describes a plausible future for polar bears?

Meanwhile, polar bear populations worldwide continue to thrive despite declines in sea ice. And as I have pointed out on numerous occasions, the ice free period for WH has not continued to decline since 1998 but rather has remained stable (with yearly variation) at about 3 weeks longer than it was in the 1980s (Castro de la Guardia et al 2017). Moreover, for the last five years at least, including this one, the ice-free season for WH bears has been better (only 1-2 weeks longer than the 1980s), although no official data on this phenomenon has yet been published. Oddly, this more recent data for Hudson Bay was not used for the Molnar model.


Susan’s full account is here.

Flawed Models: New Studies Find Plants Take Up “More Than Twice As Much” CO2 Than Expected

by Fritz Vahrenholt, July 7, 2020 in NoTricksZone


First, the global mean temperature of satellite based measurements was surprisingly much higher in May 2020 than in April. In contrast, the global temperatures of the series of measurements on land and sea decreased. The difference can be explained by the fact that under warm El-Nino conditions the satellite measurements lag about 2-3 months behind the earth-based measurements.

From November 2019 to March 2020 a moderate El-Nino was observed, which has now been replaced by neutral conditions in the Pacific. Therefore, it is to be expected that also the satellite based measurements, which we use at this point, will show a decrease in temperatures within 2-3 months.

The average temperature increase since 1981 remained unchanged at 0.14 degrees Celsius per decade. The sunspot number of 0.2 corresponded to the expectations of the solar minimum.

The earth is greening

DESPITE THE LIES, THE SPIN, AND THE PROPAGANDA, ANTARCTIC SEA ICE IS GROWING — BOTH EXTENT AND CONCENTRATION GREATER NOW THAN IN 1980

by Cap Allon, July 6, 2020 in Electroverse


The UN and their scraggly little offshoot, the IPCC, are at it again — obfuscating data in order to push their fraudulent catastrophic global warming agenda.

According to the IPCC, and picked up the usual AGW propaganda rags such as the Guardian: “the South pole is warming three times faster than rest of the world.”

The Guardian articledated June 30, 2020 continues in predictably befogging fashion: “Dramatic change in Antarctica’s interior in past three decades a result of effects from tropical variability working together with increasing greenhouse gases.”

But, 1) the MSM have a habit of claiming everywhere is warming faster than everywhere else:

And 2), the actual data reveals quite the opposite re Antarctica.

As @Harry_Hardrada recently pointed out on Twitter, there was a larger extent and concentration of Antarctic Sea Ice in June 2020 than back in June 1980:

Robert Felix over at iceagenow.com dives into the data, adding that sea ice extent today stands at 700,000 sq km (270,272 sq miles) greater than in 1980.

And in case you’re having a hard time reading the numbers, Felix breaks them down for you:

Sea ice extent in June 2020 = 13.2 million sq km
Sea ice extent in June 1980 = 12.5 million sq km

Sea ice concentration in June 2020 = 10.6 million sq km
Sea ice concentration in June 1980 = 9.6 million sq km

Fact-checked!

That’s enough extra ice to entirely cover Maryland, Delaware, West Virginia, South Carolina, Virginia, Indiana, Ohio and all six New England states. Oh, and throw in Washington, D.C. for good measure. (Which might be a good idea.)

 See also THE ARCTIC IS ON FIRE, AND WE SHOULD ALL BE TERRIFIED” — FACT CHECK: IT’S CURRENTLY SNOWING IN VERKHOYANSK

Hot Summer Epic Fail: New Climate Models Exaggerate Midwest Warming by 6X

by Dr Roy Spencer, July 3, 2020 in GlobalWarming


For the last 10 years I have consulted for grain growing interests, providing information about past and potential future trends in growing season weather that might impact crop yields. Their primary interest is the U.S. corn belt, particularly the 12 Midwest states (Iowa, Illinois, Indiana, Ohio, Kansas, Nebraska, Missouri, Oklahoma, the Dakotas, Minnesota, and Michigan) which produce most of the U.S. corn and soybean crop.

Contrary to popular perception, the U.S. Midwest has seen little long-term summer warming. For precipitation, the slight drying predicted by climate models in response to human greenhouse gas emissions has not occurred; if anything, precipitation has increased. Corn yield trends continue on a technologically-driven upward trajectory, totally obscuring any potential negative impact of “climate change”.

What Period of Time Should We Examine to Test Global Warming Claims?

Based upon the observations, “global warming” did not really begin until the late 1970s. Prior to that time, anthropogenic greenhouse gas emissions had not yet increased by much at all, and natural climate variability dominated the observational record (and some say it still does).

Furthermore, uncertainties regarding the cooling effects of sulfate aerosol pollution make any model predictions before the 1970s-80s suspect since modelers simply adjusted the aerosol cooling effect in their models to match the temperature observations, which showed little if any warming before that time which could be reasonably attributed to greenhouse gas emissions.

This is why I am emphasizing the last 50 years (1970-2019)…this is the period during which we should have seen the strongest warming, and as greenhouse gas emissions continue to increase, it is the period of most interest to help determine just how much faith we should put into model predictions for changes in national energy policies. In other words, quantitative testing of greenhouse warming theory should be during a period when the signal of that warming is expected to be the greatest.

50 Years of Predictions vs. Observations

Now that the new CMIP6 climate model experiment data are becoming available, we can begin to get some idea of how those models are shaping up against observations and the previous (CMIP5) model predictions. The following analysis includes the available model out put at the KNMI Climate Explorer website. The temperature observations come from the statewide data at NOAA’s Climate at a Glance website.

For the Midwest U.S. in the summer (June-July-August) we see that there has been almost no statistically significant warming in the last 50 years, whereas the CMIP6 models appear to be producing even more warming than the CMIP5 models did.

What Happened To Greenland’s Tipping Point?

by P. Homewood, June 22, 2020 in NotaLotofPeopleKnowThat


Ten years ago, the Guardian warned us that Greenland would have passed a tipping point by now, with the whole ice sheet due to disappear by the end of the century:

How did that work out then?

The article was written in 2010, which was the warmest on record. Since then, however, Greenland’s temperatures have returned to normal, and are no higher than they were in the 1930s.

Far from being the start of a new trend, 2010 was simply an outlier:


Tree Rings & Michael Mann’s Hockey Stick

by P. Homewood, June 14, 2020 in NotalotofPeopleKnowThat


Somehow what starts as a perfectly sensible review morphs into Michael Mann and his discredited hockey stick!

But, as the review itself admits, tree rings tell you more about rainfall than temperature, Indeed, in a much better review in Newsweek, we read how the book reveals in detail the effect that a long period of drought had on the declining Roman Empire in the 4thC.

In fact Mann’s Hockey Stick was hopelessly flawed in many ways. (I would recommend Andrew Montford’s book, “The Hockey Stick Illusion”, for anyone interested.

For a start, the Hockey Stick was based on shonky statistics, which were guaranteed to produce a hockey stick curve regardless of the data fed into it. This was because of the way Mann used Principal Component analysis. In simple terms, Mann’s statistics blew out of all proportion any data which showed a hockey stick effect and ignored all other data.

Secondly, as far as tree rings were concerned, it was heavily dependent on bristlecone pines. It has long been known that the marked increase in bristlecone growth in the 19th and 20thC is due to CO2 fertilization, not temperature. When bristlecones are taken out of Mann’s analysis. the hockey stick disappears.

Thirdly, when tree ring and other proxy data diverged from rising temperature data in the late 20thC, Mann ignored the proxies and spliced the temperature data onto his graph.

There are also a whole host of other major flaws in the Hockey Stick, not related to tree rings.

Models Can’t Accurately Predict Next Week’s Weather, So Why Should We Trust Them To Predict Climate Change?

by D. Turner, June 2, 2020 in WUWT


It’s curious … SpaceX has all the money in the world, and they didn’t hire someone who could have accurately predicted the afternoon weather in Florida on May 27, 2020.  Seems like a huge oversight, doesn’t it?  And to think there are scores of nonprofit leaders and academics in Washington, DC who can accurately predict global temperatures 10, 15, even 50 years into the future.

Oh, stop it with the “climate isn’t weather” rebuttal. It’s trite and silly. The guys who says “food isn’t cuisine” is a food critic, and by default, haughty and obnoxious.

How about this one: science isn’t semantics.

Pacific Island states will not longer play the patsies for the climate alarmists

by P. Homewood, May 27, 2020 in NotaLotofpeopleKnowThat


The science is settled. The time for debate is over. It’s actually better than we thought. The Pacific islands are not sinking under rising sea levels, in fact, the peer-reviewed science shows the exact opposite, the majority of low lying islands are either stable or increasing in size — something even ABC FactCheck was forced to concede.

Nevertheless, this has not stopped climate alarmists led by the Portuguese socialist and UN General Secretary Guterres from denying the peer-reviewed science and exploiting Pacific Island nations, by using them as patsies to peddle fear and misinformation with discredited claims of ”sinking islands”.

And so far, the Pacific islanders have been happy to play along; perhaps driven by a cargo-cult mentality, believing if they utter the magic words ”climate change” and pose for the international media forlornly staring out over the sea, that they might be rewarded with cash handouts from the UN Green Global Climate fund.

But that was all before the Wuhan Flu.

Sorry Greta, Climate ‘Experts’ Are 0-41 With Wrong Predictions

by Mark Simone, March 5, 2020 in ClimateChangeDispatch


For more than 50 years, climate alarmists in the scientific community and environmental movement have not gotten even one prediction correct, but they do have a perfect record of getting 41 predictions wrong.

List Of Doomsday Predictions That Climate Alarmist Got Wrong:

Here is the source for numbers 1-27. As you will see, the individual sources are not crackpots, but scientific studies and media reports on “expert” predictions.

The sources for numbers 28 to 41 are linked individually.

  1. 1967: Dire Famine Forecast By 1975
  2. 1969: Everyone Will Disappear In a Cloud Of Blue Steam By 1989 (1969)
  3. 1970: Ice Age By 2000
  4. 1970: America Subject to Water Rationing By 1974 and Food Rationing By 1980
  5. 1971: New Ice Age Coming By 2020 or 2030
  6. 1972: New Ice Age By 2070
  7. 1974: Space Satellites Show New Ice Age Coming Fast
  8. 1974: Another Ice Age?
  9. 1974: Ozone Depletion a ‘Great Peril to Life
  10. 1976: Scientific Consensus Planet Cooling, Famines imminent
  11. 1980: Acid Rain Kills Life In Lakes
  12. 1978: No End in Sight to 30-Year Cooling Trend
  13. 1988: Regional Droughts (that never happened) in the 1990s
  14. 1988: Temperatures in DC Will Hit Record Highs
  15. 1988: The Maldive Islands will Be Underwater by 2018 (they’re not)
  16. 1989: Rising Sea Levels will Obliterate Nations if Nothing Done by 2000
  17. 1989: New York City’s West Side Highway Underwater by 2019 (it’s not)
  18. 2000: Children Won’t Know What Snow Is
  19. 2002: Famine In 10 Years If We Don’t Give Up Eating Fish, Meat, and Dairy
  20. 2004: Britain will Be Siberia by 2024
  21. 2008: The Arctic will Be Ice Free by 2018
  22. 2008: Climate Genius Al Gore Predicts Ice-Free Arctic by 2013
  23. 2009: Climate Genius Prince Charles Says we Have 96 Months to Save World
  24. 2009: UK Prime Minister Says 50 Days to ‘Save The Planet From Catastrophe’
  25. 2009: Climate Genius Al Gore Moves 2013 Prediction of Ice-Free Arctic to 2014
  26. 2013: Arctic Ice-Free by 2015
  27. 2014: Only 500 Days Before ‘Climate Chaos’
  28. 1968: Overpopulation Will Spread Worldwide
  29. 1970: World Will Use Up All its Natural Resources
  30. 1966: Oil Gone in Ten Years
  31. 1970: Urban Citizens Will Require Gas Masks by 1985
  32. 1970: Nitrogen buildup Will Make All Land Unusable
  33. 1970: Decaying Pollution Will Kill all the Fish
  34. 1970s: Killer Bees!
  35. 1972: Oil Depleted in 20 Years
  36. 1977: Department of Energy Says Oil will Peak in the 90s
  37. 1980: Peak Oil In 2000
  38. 1996: Peak Oil in 2020
  39. 2002: Peak Oil in 2010
  40. 2005: Manhattan Underwater by 2015
  41. 2006: Super Hurricanes!

Sorry, Experts… Sorry, Scientific Consensus… Only a fool comes running for the 42nd cry of wolf.

Why are polar bears going extinct? (Spoiler: They’re not)

by S. Crockford, February 24, 2020 in WUWT


Google says many people ask this question so here is the correct answer: polar bears are not going extinct. If you have been told that, you have misunderstood or have been misinformed. Polar bears are well-distributed across their available habitat and population numbers are high (officially 22,000-31,000 at 2015 but likely closer to 26,000-58,000 at 2018): these are features of a healthy, thriving species. ‘Why are polar bears going extinct?’ contains a false premise – there is no need to ask ‘why’ when the ‘polar bears [are] going extinct’ part is not true.1

mother-with-cubs-russia_shutterstock_71694292_web-size-e1582489285608

It is true that in 2007, it was predicted that polar bear numbers would plummet when summer sea ice declined to 42% of 1979 levels for 8 out of 10 years (anticipated to occur by 2050) and extinct or nearly so by 2100 (Amstrup et al. 2007). However, summer sea ice has been at ‘mid-century-like’ levels since 2007 (with year to year variation, see NOAA ice chart below) yet polar bear numbers have increased since 2005. The anticipated disaster did not occur but many people still believe it did because the media and some researchers still give that impression.

Do We Really Have Only 12 Years to Live?

by Andy May, February 23, 2020 in WUWT


Why have uninformed celebrities and politicians been telling everyone, who will listen, we are all going to die in a climate catastrophe in 10 to 30 years? U.N. General Assembly President María Fernanda Espinosa Garcés of Ecuador warned us…


However, these absurd statements are not supported by even the most fanatical climate alarmists, like Kate Marvel (NASA), Gavin Schmidt (NASA), Katharine Hayhoe (Texas Tech), or Andrea Dutton (University of Florida) (link). The original inspiration for these statements came from a 2018 IPCC report entitled Global Warming of 1.5°C. Even the alarmist Scientific American does not think the world is ending in twelve years.

We will discuss this IPCC report below, but first let’s look at some critical evidence that is not in the report. As usual the IPCC dodges the current benefits of warming and additional CO2, so we need to fill in this gap.

A little over two years ago I posted an essay entitled “Calculating the Cost of Global Warming,” it did not calculate a cost, but discussed calculations made by others. Global warming and the increasing concentration of CO2 in the atmosphere are not existential threats to mankind or to nature. Global warming will not go “runaway,” this idea, discussed here, has been discredited by climate change skeptics and by climate alarmists alike (see here and here for examples). So, given that global warming and additional CO2 will not harm us, we are reduced to a discussion of the economic impacts and benefits, both positive and negative, of global warming and additional CO2.


Figure 2. A graph of CMIP5 global tropospheric temperatures (5-year averages) versus satellite and weather balloon observations. These predictions are for the Representative Concentration Pathway (RCP) 4.5, a moderate case. Source: House of Representatives report by Dr. John Christy.

Analysis of a carbon forecast gone wrong: the case of the IPCC FAR

by J. Curry, January 31, 2020 in WUWT-C. Rotter


The IPCC’s First Assessment Report (FAR) made forecasts or projections of future concentrations of carbon dioxide that turned out to be too high.

From 1990 to 2018, the increase in atmospheric CO2 concentrations was about 25% higher in FAR’s Business-as-usual forecast than in reality. More generally, FAR’s Business-as-usual scenario expected much more forcing from greenhouse gases than has actually occurred, because its forecast for the concentration of said gases was too high; this was a problem not only for CO2, but also for methane and for gases regulated by the Montreal Protocol. This was a key reason FAR’s projections of atmospheric warming and sea level rise likewise have been above observations.

Some researchers and commentators have argued that this means FAR’s mistaken projections of atmospheric warming and sea level rise do not stem from errors in physical science and climate modelling. After all, emissions are for climate models an input, not an output. Emissions depend largely on economic growth, and can also be affected by population growth, intentional emission reductions (such as those implemented by the aforementioned Montreal Protocol), and other factors that lie outside the field of physical science. Under this line of reasoning, it makes no sense to blame the IPCC for failing to predict the right amount of atmospheric warming and sea level rise, because that would be the same as blaming it for failing to predict emissions.

Readers who have made it to this part of the article probably want a summary, so here it goes:

  • Hausfather estimates that FAR’s Business-as-usual scenario over-projected forcings for the 1990-2017 period by 55%. This would mean a difference of 0.59 w/m2 between FAR and reality.
  • Lower-than-expected concentrations of Montreal Protocol gases explain about 0.19 w/m2 of the difference. With the big caveat that Montreal Protocol accounting is a mess of CFCs, HCFCs, HFCs, stratospheric ozone, and perhaps other things I’m not even aware of.
  • FAR didn’t account for tropospheric ozone, and this ‘unexplains’ about 0.07 w/m2. So there’s still 0.45-0.5 w/m2 of forcing overshoot coming from something else, if Hausfather’s numbers are correct.
  • N2O is irrelevant in these numbers
  • CO2 concentration was significantly over-forecasted by the IPCC, and that of methane grossly so. It’s safe to assume that methane and CO2 account for most or all of the remaining difference between FAR’s projections and reality.

Again, this is a rough calculation. As mentioned before, an exact calculation has to take into account for many issues I didn’t consider here. I really hope Hausfather’s paper is the beginning of a trend in properly evaluating climate models of the past, and that means properly accounting for (and documenting) how expected forcings and actual forcings differed.

CLINTEL Group Blasts Climate Doomsters; There Is No ‘Emergency’

by D. Wojick, Jan 29, 2020 in ClimateChangeDispatch


There is NO climate emergency. Preaching doom and gloom is a crime against the young generation. These are the key points of a new manifesto from the Climate Intelligence Group or CLINTEL.

CLINTEL is a rapidly growing international group, led by prominent scientists, that opposes the ill-founded attempts to scare people into hasty climate policy actions.

They also oppose the terrorizing of children as part of the false climate alarm. CLINTEL recently issued a World Climate Declaration denouncing scaremongering and this new manifesto provides detailed scientific backup for the WCD for a wide public.

The manifesto is authored by Professor Guus Berkhout, the President of CLINTEL.

The focus of the Berkhout manifesto is on climate-related modeling, which it says is “unfit for purpose.” The purpose, in this case, is predicting future climate change. Modeling dominates climate science.

It also provides the scary scenarios that drive hugely expensive and disruptive climate emergency action policies. That the models are faulty is a very important finding.

The manifesto says there are at least four strong reasons why today’s models are no good.

Emissions – the ‘business as usual’ story is misleading

by Z. Hausfather & G. Peters, January 29, 2020 in Nature


Stop using the worst-case scenario for climate warming as the most likely outcome — more-realistic baselines make for better policy.

More than a decade ago, climate scientists and energy modellers made a choice about how to describe the effects of emissions on Earth’s future climate. That choice has had unintended consequences which today are hotly debated. With the Sixth Assessment Report (AR6) from the Intergovernmental Panel on Climate Change (IPCC) moving into its final stages in 2020, there is now a rare opportunity to reboot.


Doomsday Climate Predictions: Wrong Then, Wrong Now

by CFACT, January 20, 2020, in ClimateChangeDispatch


How many doomsday predictions about the Earth’s climate must fail before they finally get broadly ignored and dismissed out of hand?

Considering the track record of climate predictions that turned out to be false, we are well passed the moment of ridicule.

The latest climate prediction fiasco, about glaciers disappearing in Glacier National Park by 2020, is the latest reminder of the falsity of the man-made global warming movement.  It’s 2020; the glaciers remain.

Predictions of climate catastrophe drone on, and get more hysterical, including many from the same people whose credibility was destroyed long ago.

Yet, the climate alarmists remain undaunted and impervious to embarrassment.

Instead, they simply move the goalposts by predicting more planetary weather Armageddon in the future and proposing more insanely expensive solutions to “address” it (notice they rarely promise to reverse assumed man-made warming).

It is not just actors like Ted Danson or Jane Fonda who make absurd climate predictions, but scientists, government bureaucrats and especially politicians continue this longstanding racket.

In the years leading up to the first “Earth Day” in 1970, there were so many climate predictions that ended up being laughably wrong, it’s hard to pick favorites.

Stanford University biologist, Paul Ehrlich, author of The Population Bomb, is perhaps the best-known alarmist of that period.


Continuer la lecture de Doomsday Climate Predictions: Wrong Then, Wrong Now

2019 Science Refutes Climate Alarm On Every Front… Shrinking Deserts, Growing Islands, Crumbling Consensus, Weaker Storms, Cooler Arctic Etc. Etc. Etc.

by P. Gosselin, December 31, 2019 in NoTricksZone


2019 science: Absolutely no climate alarm 

No alarm on every aspect: stable polar ice, normal sea level rise, no consensus, growing snow cover, less tropical storms, tornadoes, shrinking deserts, global greening, predictions wrong, models flawed, climate driven by sun, ocean cycles, biodiversity, warmer 1000 years ago…etc…


2019 saw a great amount of new science emerge showing that there’s nothing alarming or catastrophic about our climate. 

Some 2019 scientific findings

Need to make a presentation showing there is no climate alarm? The following findings we reported on in 2019 will put many concerns to rest.

Hundreds of peer-reviewed papers ignored by media

What follows are some selected top science-based posts we published here at NoTricksZone in 2019. These new findings show there is absolutely no climate alarm.

Hundreds of new peer-reviewed papers, charts, findings, etc – which the IPCC, activists and media ignore and even conceal. No wonder they’ve gotten so shrill.