Archives par mot-clé : Fun?/Discussion

Don’t Panic: Leading Scientists See Little Global Warming, Just ‘Natural Variability’

by F. Vahrenholt, July 6, 2020 in ClimateChangeDispatch


A commentary titled “‘Just don’t panic – also about climate change’” by Prof. Fritz Vahrenholt appearing at German site achgut.comtells us there’s no need for panic with respect to climate change, as leading scientists dial back earlier doomsday projections.

No warming until 2050

Vahrenholt claims a negative Atlantic oscillation is ahead of us and the expected second weak solar cycle in succession will reduce anthropogenic warming in the next 15-30 years.

He cites a recent publication by Judith Curry, who sees a pause in the temperature rise until 2050 as the most likely scenario.

Vahrenholt and Curry are not alone when it comes to believing natural-variability-watered-down warming is in the works.

Also, IPCC heavyweight Jochem Marotzke from the Max Planck Institute for Meteorology in Hamburg takes a similar stand in a publication in the Environmental Research Letters.

In the paper, Marotzke concludes that all locations examined show “a cooling trend or lack of warming trend” and that there is “no warming due to natural cooling effects” and that in calculations up to 2049.

The researchers find “a large part of the earth will not warm up because of internal variability.”

Distancing from alarmists Schellnhuber, Rahmstorf

And recently The Max Planck Institute Director Marotzke said in an interview with Andreas Frey of the Frankfurter Allgemeinen Zeitung (FAZ) that there was no need to panic, thus clearly splitting from the doomsday scenarios put out by his alarmist colleagues Hans-Joachim Schellnhuber and Stefan Rahmstorf.

In the FAZ interview, Marotzke also said there was no need to worry that the port city of Hamburg would be flooded in 2100: “Hamburg will not be threatened, that is totally clear.”

Areas not going to be wiped out

Marotzke then told the FAZ that the fears that children have today for the future are not absolutely well-founded, and that entire areas are not going to be wiped out, as often suggested by alarmists.

Sensational French models

DESPITE THE LIES, THE SPIN, AND THE PROPAGANDA, ANTARCTIC SEA ICE IS GROWING — BOTH EXTENT AND CONCENTRATION GREATER NOW THAN IN 1980

by Cap Allon, July 6, 2020 in Electroverse


The UN and their scraggly little offshoot, the IPCC, are at it again — obfuscating data in order to push their fraudulent catastrophic global warming agenda.

According to the IPCC, and picked up the usual AGW propaganda rags such as the Guardian: “the South pole is warming three times faster than rest of the world.”

The Guardian articledated June 30, 2020 continues in predictably befogging fashion: “Dramatic change in Antarctica’s interior in past three decades a result of effects from tropical variability working together with increasing greenhouse gases.”

But, 1) the MSM have a habit of claiming everywhere is warming faster than everywhere else:

And 2), the actual data reveals quite the opposite re Antarctica.

As @Harry_Hardrada recently pointed out on Twitter, there was a larger extent and concentration of Antarctic Sea Ice in June 2020 than back in June 1980:

Robert Felix over at iceagenow.com dives into the data, adding that sea ice extent today stands at 700,000 sq km (270,272 sq miles) greater than in 1980.

And in case you’re having a hard time reading the numbers, Felix breaks them down for you:

Sea ice extent in June 2020 = 13.2 million sq km
Sea ice extent in June 1980 = 12.5 million sq km

Sea ice concentration in June 2020 = 10.6 million sq km
Sea ice concentration in June 1980 = 9.6 million sq km

Fact-checked!

That’s enough extra ice to entirely cover Maryland, Delaware, West Virginia, South Carolina, Virginia, Indiana, Ohio and all six New England states. Oh, and throw in Washington, D.C. for good measure. (Which might be a good idea.)

 See also THE ARCTIC IS ON FIRE, AND WE SHOULD ALL BE TERRIFIED” — FACT CHECK: IT’S CURRENTLY SNOWING IN VERKHOYANSK

Hot Summer Epic Fail: New Climate Models Exaggerate Midwest Warming by 6X

by Dr Roy Spencer, July 3, 2020 in GlobalWarming


For the last 10 years I have consulted for grain growing interests, providing information about past and potential future trends in growing season weather that might impact crop yields. Their primary interest is the U.S. corn belt, particularly the 12 Midwest states (Iowa, Illinois, Indiana, Ohio, Kansas, Nebraska, Missouri, Oklahoma, the Dakotas, Minnesota, and Michigan) which produce most of the U.S. corn and soybean crop.

Contrary to popular perception, the U.S. Midwest has seen little long-term summer warming. For precipitation, the slight drying predicted by climate models in response to human greenhouse gas emissions has not occurred; if anything, precipitation has increased. Corn yield trends continue on a technologically-driven upward trajectory, totally obscuring any potential negative impact of “climate change”.

What Period of Time Should We Examine to Test Global Warming Claims?

Based upon the observations, “global warming” did not really begin until the late 1970s. Prior to that time, anthropogenic greenhouse gas emissions had not yet increased by much at all, and natural climate variability dominated the observational record (and some say it still does).

Furthermore, uncertainties regarding the cooling effects of sulfate aerosol pollution make any model predictions before the 1970s-80s suspect since modelers simply adjusted the aerosol cooling effect in their models to match the temperature observations, which showed little if any warming before that time which could be reasonably attributed to greenhouse gas emissions.

This is why I am emphasizing the last 50 years (1970-2019)…this is the period during which we should have seen the strongest warming, and as greenhouse gas emissions continue to increase, it is the period of most interest to help determine just how much faith we should put into model predictions for changes in national energy policies. In other words, quantitative testing of greenhouse warming theory should be during a period when the signal of that warming is expected to be the greatest.

50 Years of Predictions vs. Observations

Now that the new CMIP6 climate model experiment data are becoming available, we can begin to get some idea of how those models are shaping up against observations and the previous (CMIP5) model predictions. The following analysis includes the available model out put at the KNMI Climate Explorer website. The temperature observations come from the statewide data at NOAA’s Climate at a Glance website.

For the Midwest U.S. in the summer (June-July-August) we see that there has been almost no statistically significant warming in the last 50 years, whereas the CMIP6 models appear to be producing even more warming than the CMIP5 models did.

How Climate Trickery Infiltrated the AGU

by Donna Laframboise, July 2020, In BigPicturesNews


11 presentations – based on private, agenda-driven research – were delivered to the world’s largest gathering of climate scientists.

I’ve been writing about a far-fetched climate fairy tale that was repackaged and re-positioned – with the result that it now gets taken seriously by supposedly serious scientists (see here and here).

How did this happen? First, billionaire climate activists hired consultants to produce a brand new climate analysis. Because, you know, the world doesn’t have enough climate research, what with governments spending billions on it every year.

This custom research was conducted by a team of noticeably young people. One is still working on his doctorate. Two others were doctoral students at the time. The lead scientist had earned his geobiology PhD seven years earlier. The lead economist had earned his, in sustainable development, a mere three years earlier.

This team produced a 2014 report titled Risky Business: The Economic Risks of Climate Change in the United States. It features a graphic that wildly misrepresents the scientific literature.

Six months after that report appeared, fully 11 presentations based on it were delivered at the world’s largest annual gathering of earth scientists – the American Geophysical Union’s December 2014 conference.

A “Good” Proxy on the Antarctic Peninsula?

by Steve McIntyre, June 30, 2014 in ClimateAudit


Nearly all of the text of this article on an interesting ice core proxy series (James Ross Island) from the Antarctic Peninsula was written in June 2014, but not finished at the time for reasons that I don’t recall.  This proxy was one of 16 proxy series in the Kaufman 12K pdf. 60-90S reconstruction.

I originally drafted the article because it seemed to me that the then new James Ross Island isotope series exemplified many features of a “good” proxy according to ex ante criteria that I had loosely formulated from time to time in critiquing “bad” proxies, but never really codified (in large part, because it’s not easy to codify criteria except through handling data.)

Although this series is in the Kaufman 60-90S reconstruction, its appearance is quite different than the final 60-90S reconstruction: indeed, it has a very negative correlation (-0.61) to Kaufman’s final CPS reconstruction. I’ll discuss that in a different article.

Following is mostly 2014 notes, with some minot updating for context.

“Good” Proxies
I’ve articulated with increasing clarity over the years (but present in early work as well) – is that one needs to work outward from proxies that are “good” according to some ex ante criteria, rather than place hope in a complicated multivariate algorithm on inconsistent and noisy data, not all of which are “proxies” for the item being reconstructed. This is based on principles that I’ve observed in use by geophysicists and geologists to combine “good” (high resolution) data with lower quality data.

WHY CARBON DIOXIDE CAN’T CAUSE WARMING IN THE ATMOSPHERE, BY PROFESSOR EMERITUS OF GEOLOGY AT WESTERN WASHINGTON UNIVERSITY

by Cap Allon, July 5, 2020 in Electroverse


ABSTRACT

A greenhouse gas is a gas that absorbs and emits infrared radiation.

The primary greenhouse gases in the atmosphere are water vapor, carbon dioxide, methane, nitrous oxide, and ozone. Atmospheric carbon dioxide (CO2) is a nontoxic, colorless, odorless gas.

Water vapor accounts for by far the largest greenhouse effect (90–85%) because water vapor emits and absorbs infrared radiation at many more wavelengths than any of the other greenhouse gases, and there is much more water vapor in the atmosphere than any of the other greenhouse gases. CO2 makes up only a tiny portion of the atmosphere (0.040%) and constitutes only 3.6% of the greenhouse effect. The atmospheric content of CO2 has increased only 0.008% since emissions began to soar after 1945. Such a tiny increment of increase in CO2 cannot cause the 10°F increase in temperature predicted by CO2 advocates.

Computer climate modelers build into their models a high water vapor component, which they claim is due to increased atmospheric water vapor caused by very small warming from CO2, and since water vapor makes up 90–95% of the greenhouse effect, they claim the result will be warming.

The problem is that atmospheric water vapor has actually declined since 1948, not increased as demanded by climate models. If CO2 causes global warming, then CO2 should always precede warming when the Earth’s climate warms up after an ice age. However, in all cases, CO2 lags warming by ∼800 years. Shorter time spans show the same thing–warming always precedes an increase in CO2 and therefore it cannot be the cause of the warming.

A Hydrogen Future? Some Basic Facts

by P. Homewood, July 5, 2020 in NotaLotofPeopleKnowThat


There has been a wide ranging debate about hydrogen in the last couple of days, so I thought it worthwhile to recap some of the basic facts. Most of these are from the Committee on Climate Change’s Net Zero report last year, otherwise I will provide links.

I have referred to many of these facts before, but they sometimes get lost in the fog of technical debate. If anybody disagrees with these facts, please explain where the CCC went wrong.

Production

There are essentially two methods of producing hydrogen:

1) Steam reforming

This process typically usually uses natural gas as the feedstock, but produces CO2 as a by-product. Therefore, for the process to be “low carbon”, carbon capture and storage would be necessary. Unfortunately even then not all of the CO2 is captured. Allowing for upstream emissions as well, the CCC estimate that the process will only reduce emissions by 60 to 85%, compared to burning natural gas instead.

The cost of producing hydrogen via steam reforming with CCS is estimated to be triple the current wholesale price of natural gas (ie before adding distribution costs).

2) Electrolysis

The CCC explain why electrolysis can only offer a limited contribution:

CO2 Coalition Corrects the Record on How to Report on Climate Science

by C. Rossiter, December 17, 2019 in CO2Coalition


Memo to the Media: Don’t Use Bad Words!

13 misleading phrases about industrial warming gases and policies to slow their increase.

 By: Dr. Caleb Rossiter, Executive Director of the CO2 Coalition

1. Climate change (as in “climate change is real”): Climate change is indeed real, and humans have little to do with it.

What is the specific change you have in mind?  Is it a typical fluctuation or a statistically significant trend?  Is it caused by an increase in average temperature, locally or globally?  Is the increase driven by CO2 levels, or natural causes?  The scientific answer to each of these questions is usually complex, uncertain, and not alarming at all.

2. Climate “crisis” (or “emergency”): There is no climate crisis or emergency.

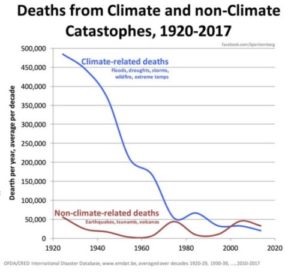
UN IPCC data show no statistically significant trends in “crisis” variables like storms, floods, hurricanes, droughts and rate of sea-level rise in the last 100 years.  That is before CO2 emissions could have had a measurable impact on temperature.

3. “A consensus (of 97% of scientists) agrees”: Agrees about precisely what?

This has nothing to do with claims of a “crisis,” or with the potential of “renewable” energy.  The “consensus” was declared by non-scientists, who judged the content of articles in science journals – often incorrectly.  They tried to determine whether the articles agreed with the IPCC opinion that at least 0.25 of the 1°C rise in global average temperature since 1900 was likely caused by industrial CO2 emissions.

4. “It’s already happening”: This confuses climate with weather.

Climate – a statistical average – is what we expect; weather – random and often extreme fluctuations – is what we get. Hurricanes Harvey, Andrew, Sandy, and Katrina, California wildfires, regional droughts and floods, and sea-level rise are all almost entirely natural.  Similar events occur in historical records going back millennia.

5. “(X out of the Y) warmest months, years, decades on record have occurred recently”: This has been true throughout the past 250 years, for natural reasons.

Temperature has been rising slowly and steadily since the Little Ice Age, well before CO2 levels increased.  Slightly higher records are to be expected.

6. CO2 emissions are causing “ocean acidification”: The ocean will never become acidic (i.e. below “neutral” 7 on the pH scale).

Sea water is alkaline, not acidic, with a pH of around 8.  A one-unit change to 7 on this logarithmic scale would require a 10-fold increase in pH.  Even a tripling of current CO2 levels, over 600 years, would drive pH down only to 7.8.  Rainwater is naturally acidic, at 5.6.  Ocean health is improved by the plant and phytoplankton food: CO2.

7. “Carbon pollution”: CO2 is not a “pollutant” but an essential plant food.

A pollutant damages human health.  CO2 is an inert, natural, non-toxic, mild warming gas.  The rise of CO2 levels from 0.03% of the atmosphere to 0.04% has increased plant growth by a third.  Human breath has 100 times this level.  EPA does not list CO2 as a “criteria pollutant,” like carbon monoxide (CO) from cars and sulfur dioxide from power plants.  Ironically, catalytic converters remove these real pollutants by oxidizing them to CO2.

8. Social Cost of Carbon (SCC): There is a far greater cost to using “renewables.”

The current SCC of $40 in damages per metric ton of CO2 is based on 300-year projections of the economy and CO2-driven extreme weather.  Both are wildly uncertain.  At present the true cost of wind and solar is four times that of fossil fuels, per mile of travel and per kilowatt-hour of electricity.  The SCC ignores these costs.

9. Renewable Energy: Converting it to power is NOT renewable.

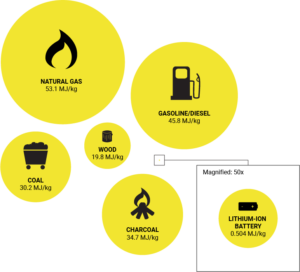
Wind and solar are free and renewable but using them is not.  The costly turbines, solar panels, batteries, and transmission lines must be mined, produced, transported, and disposed of after their short lifetimes.  What powers those industries?  Reliable, cheap fossil fuels.

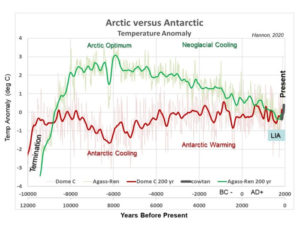
10. “Highest CO2 levels in (thousands, millions) of years”: Correlation is not causation.

Al Gore tried to convince movie-goers that CO2 and temperature “go together.”  Indeed, they do, but on these time scales, it is temperature that drives CO2.  As the Earth has warmed and cooled over the past million years of recurrent ice ages, changes in CO2come long after changes in temperature.  That’s because CO2 is released from warming oceans and land and is absorbed again when they cool.

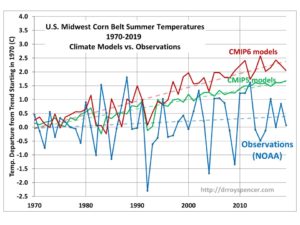
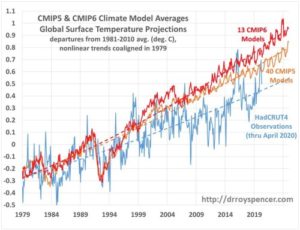
11. “Climate models predict…”: No, IPCC computer estimations “project scenarios”

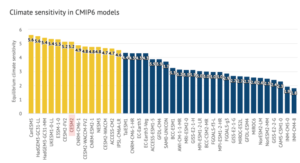
The IPCC’s models run about three times too “hot.”  Why?  Because they “tune” the models to make past CO2 levels drive temperature changes.  Nature hasn’t cooperated with their theory of strong warming when the models are run into the future.  The models require thousands of guesses about physics and economics, and their error bands are bigger than their projected temperature results.

12. “Exxon Knew”: That alarmist science was uncertain.

The #ExxonKnew lawsuits are based on a fraud: the plaintiffs and their advocates cynically edit Exxon’s scientific memos before quoting them, removing key words and phrases.  This reverses the scientists’ conclusions, because they were summarizing alarmist predictions and explaining their uncertainties.

13. “The debate is over”: See 1-12, above.

A PDF of this memo can be downloaded at Memo to the Media.

Climate alarmism versus integrity at National Academies of Science

by D. Wojick, June28, 2020 in WUWT


National Academies of Science should speak out against climate alarmism, not support it. This is the major message in a recent letter from Professor Guus Berkhout, president of CLINTEL, to the new head of the Royal Netherlands Academy of Arts and Sciences. The integrity of science is at stake.

This letter is a model for how all alarmist National Academies should be addressed. For example, the US National Academy of Sciences (NAS) is painfully alarmist. Even worse, NAS has been joined in promoting alarmism by its two siblings, the National Academies of Engineering and Medicine. The fact that these Academies have become a servant of supranational political organizations such as IPCC shows how serious the crisis in climate science really is.

The Netherlands Academy is called KNAW, from its Dutch name. KNAW was established in 1808 as an advisory body to the government, a task it still performs today. NAS was established by Congress in 1868. Both NAS and KNAW derive their authority from their high profile members, rigorously selected top scientists from a large range of scientific fields. Professor Berkhout is a member of KNAW.

The letter is addressed to Prof. Dr. Ineke Sluiter, President of KNAW. It begins with a clear statement of the issue:

I am addressing you in your capacity as the new President of the KNAW because the climate issue is escalating. The IPCC and the associated activist climate movement have become highly politicised. Sceptical scientists are being silenced. As an IPCC expert reviewer, I critically looked at the latest draft climate report. My conclusion is that there is little evidence of any intent to discover the objective scientific truth.

The Ninety-Seven Percent Consensus Myth

by J. O’Sullivan, une 29, 2020 in ClimateChangeDispatch


A Pew Research survey for this year’s Earth Day showed that while Democrats with a high degree of scientific knowledge were likely to have a strong belief in the human contribution to climate change, Republicans with the same level of information were much more skeptical.

These are intriguing, even embarrassing, results. The researchers plainly thought so, because they added this somewhat nervous comment on them:

A similar pattern was found regarding people’s beliefs about energy issues. These findings illustrate that the relationship between people’s level of science knowledge and their attitudes can be complex.

And maybe they illustrate something else, too.

These results seem to conflict with perhaps the single best-known statistic about science and global warming, namely that 97 percent of scientists believe in global warming.

On Behalf Of Environmentalists, I Apologize For The Climate Scare

by M. Shellenberg, June 28, 2020 in Forbes


On behalf of environmentalists everywhere, I would like to formally apologize for the climate scare we created over the last 30 years. Climate change is happening. It’s just not the end of the world. It’s not even our most serious environmental problem.

I may seem like a strange person to be saying all of this. I have been a climate activist for 20 years and an environmentalist for 30.

But as an energy expert asked by Congress to provide objective expert testimony, and invited by the Intergovernmental Panel on Climate Change (IPCC) to serve as Expert Reviewer of its next Assessment Report, I feel an obligation to apologize for how badly we environmentalists have misled the public.

Here are some facts few people know:

  • Humans are not causing a “sixth mass extinction”

  • The Amazon is not “the lungs of the world”

  • Climate change is not making natural disasters worse

  • Fires have declined 25% around the world since 2003

  • The amount of land we use for meat — humankind’s biggest use of land — has declined by an area nearly as large as Alaska

  • The build-up of wood fuel and more houses near forests, not climate change, explain why there are more, and more dangerous, fires in Australia and California

  • Carbon emissions have been declining in rich nations for decades and peaked in Britain, Germany and France in the mid-seventies

  • Adapting to life below sea level made the Netherlands rich not poor

  • We produce 25% more food than we need and food surpluses will continue to rise as the world gets hotter

  • Habitat loss and the direct killing of wild animals are bigger threats to species than climate change

  • Wood fuel is far worse for people and wildlife than fossil fuels

  • Preventing future pandemics requires more not less “industrial” agriculture

I know that the above facts will sound like “climate denialism” to many people. But that just shows the power of climate alarmism.

 See also Green Activist, Michael Schellenberger, Apologises For Climate Scare

CO2 Not A Threat To Oceans

by Dr. J. Lehr, June 26, 2020 in ClimateChangDispatch


For the past three decades, the public has been taught by the news media and the folks who make a living composing mathematical equations they claim to simulate how our planet’s climate operates, that our oceans are in jeopardy.

They have all told you one of the biggest falsehoods in human history.

They say that carbon dioxide, the only reason man can inhabit Earth, is causing the planet to heat up to a dangerous level and the oceans will become unlivable for marine life.

There is no proof of these lies whatever. Civilization has generally been most prosperous under warmer than colder conditions.

The Ocean acidificationfrom carbon dioxide emissions preached by the scaremongers would require an impossible ten-fold decrease in the alkalinity of surface waters.

Even if atmospheric CO2 concentrations triple from todays four percent of one percent, which would take about 600 years, todays surface pH of 8.2 would plateau at 7.8, still well above neutral 7.

Ocean health has improved as a result of greater CO2, as it feeds phytoplankton that stimulates the ocean’s food chain.

CO2 allows phytoplankton such as algae, bacteria, and seaweed to feed the rest of the open ocean food chain. As carbon dioxide moves through this food web, much of it sinks or is transported away from the surface.

A high surface pH allows the ocean to store 50 times more CO2 than the atmosphere. Digestion of carbon at lower depths allows for storage there for centuries.

CMIP6 Climate Models Show 50% More Warming Than Observations Since 1979

by Roy W. Spencer, June 26, 2020 in ClimateChangeDispatch


Those who defend climate model predictions often produce plots of observed surface temperature compared to the models which show very good agreement.

Setting aside the debate over the continuing adjustments to the surface temperature record which produce ever-increasing warming trends, let’s look at how the most recent (CMIP6) models are doing compared to the latest version of the observations (however good those are).

First, I’d like to explain how some authors get such good agreement between the models and observations. Here are the two “techniques” they use that most annoy me.

  1. They look at long periods of time, say the last 100+ years. This improves the apparent agreement because most of that period was before there was substantial forcing of the climate system by increasing CO2.
  2. They plot anomalies about a common reference period but do not show trend lines. Or, if they show trend lines, they do not start them at the same point at the beginning of the record. When you do this, the discrepancy between models and observations is split in half, with the discrepancy in the latter half of the record having the opposite sign of the discrepancy in the early part of the record. They say, “See? The observed temperatures in the last few decades nearly match the models!”

In the following plot (which will be included in a report I am doing for the Global Warming Policy Foundation) I avoid both of those problems.

During the period of strongest greenhouse gas forcing (since 1979), the latest CMIP6 models reveal 50% more net surface warming from 1979 up to April 2020 (+1.08 deg. C) than do the observations (+0.72 deg. C).


Continuer la lecture de CMIP6 Climate Models Show 50% More Warming Than Observations Since 1979

MIT’s Dr. Lindzen Pokes Fun At The ‘Naïve’, Well-Funded ‘Scientific Reasoning’ That 1 Factor – CO2 – Controls Climate

by Prof. Dr.  Lindzen, June 15, 2020 in NoTricksZone_K. Richard


In a new paper, atmospheric physicist Dr. Richard Lindzen summarizes the “implausible” claims today’s proponents of dangerous anthropogenic global warming espouse.

Dr. Richard Lindzen retired several years ago, and yet his immense contribution to the atmospheric sciences lives on. His research is still cited about 600 times per year.

Lindzen recently published another scientific paper (Lindzen, 2020) in The European Physical Journal criticizing the current alarmism in climate science.  Here are a few of the highlights.

1. Doubling the atmospheric CO2 concentration from 280 ppm to 560 ppm results in just a 1-2% perturbation to the Earth’s 240 W/m² energy budget. This doubled-CO2 effect has less than 1/5th of the impact that the net cloud effect has. And yet we are asked to accept the “implausible” claim that change in one variable, CO2, is predominatly responsible for altering global temperatures.

2. A causal role for CO2 “cannot be claimed” for the glacial-to-interglacial warming events because CO2 variations follow rather than lead the temperature changes in paleoclimate records and the 100 ppm total increase over thousands of years produce “about 1 W/m²” of total radiative impact.

3. Climate science didn’t used to be alarmist prior to the late 1980s. Scientists were instead sufficiently skeptical about claims of climatically-induced planetary doom. That changed during the years 1988-1994, when climate research centered on CO2 and global warming received a 15-fold increase in funding in the US alone. Suddenly there was a great financial incentive to propel alarming global warming scenarios.

4. Concepts like “polar amplification” are “imaginary”.

“The change in equator-to-pole temperature difference was attributed to some imaginary ‘polar amplification,’ whereby the equator-pole temperature automatically followed the mean temperature. Although the analogy is hardly exact, this is not so different from assuming that flow in a pipe depends on the mean pressure rather than the pressure gradient.”

Feux californiens : le climat innocenté

by Benoît Rittaud, 19 juin 2020


Dans un silence remarquable, on vient d’apprendre que les incendies qui ont ravagé la Californie en 2018 ont été causés par des défauts de maintenance dans le réseau électrique et ne devaient rien au réchauffement climatique, rapporte Benoît Rittaud, mathématicien et président de l’Association des climato-réalistes. Tribune.

Calomniez, calomniez, il en restera toujours quelque chose, dit-on. Dans notre monde où l’écologisme est un réflexe pavlovien, ce slogan s’est fait encore plus simple : dès que se produit un drame, toute explication fondée sur le « dérèglement climatique » est présumée correcte. Cette vérité immédiate a alors de bonnes chances de devenir vérité tout court, car qui ira perdre son temps à rétablir les faits après coup, tandis qu’entre-temps tant d’autres drames auront à leur tour « démontré une fois de plus la réalité de la crise ».


Continuer la lecture de Feux californiens : le climat innocenté

Natural Variability Behind West Antarctic Warming—Media Silent

by D. Whitehouse, June 19,2020 in ClimateChangeDispatch


Ten days ago the journal Science issued an embargoed press release about a forthcoming paper that suggested the warming observed in West Antarctica was due to natural climatic variability.

West Antarctica has always been looked on by alarmists as being the southern example of polar temperature amplification – a phenomenon predicted by most climate change models.

The Arctic temperature amplification is very apparent so there must be an Antarctic equivalent, and there it is.

But while scientists have been well aware that Antarctica is warming asymmetrically, with West Antarctica experiencing more than East Antarctica and frequently attributed to climate change, the underlying causes of this phenomenon have been poorly understood, and the suggestion that West Antarctica may be experiencing natural warming has been suggested before though not taken up very enthusiastically, if at all.

This new paper, “The internal origin of the west-east asymmetry of Antarctic climate change”, expresses the dilemma well.

….


Flashback: What Michael Crichton Taught Us About Scientific Fraud

by A. Stewart, June17, 2020 in ClimateChangeDispatch


Michael Crichton’s books earned global plaudits.

He invented the genre we now call the techno-thriller whereby it is hard to discern whether it is fact or fiction you were reading.

The reason for that was because he wove his plots around well-researched facts.

One of the best examples is State of Fear.

If you are a student of the climate change furor, it is a must-read, chock full of intelligent insight into the twisted pseudoscience driving the environmental movement.

Below is a key short extract in which Crichton deftly summarizes the reality of nature and man through the character, Kenner. (emphasis added)


The graph above demonstrates we are getting better every day in understanding our environment, working with it, and adapting to its harsher realities.

Tree Rings & Michael Mann’s Hockey Stick

by P. Homewood, June 14, 2020 in NotalotofPeopleKnowThat


Somehow what starts as a perfectly sensible review morphs into Michael Mann and his discredited hockey stick!

But, as the review itself admits, tree rings tell you more about rainfall than temperature, Indeed, in a much better review in Newsweek, we read how the book reveals in detail the effect that a long period of drought had on the declining Roman Empire in the 4thC.

In fact Mann’s Hockey Stick was hopelessly flawed in many ways. (I would recommend Andrew Montford’s book, “The Hockey Stick Illusion”, for anyone interested.

For a start, the Hockey Stick was based on shonky statistics, which were guaranteed to produce a hockey stick curve regardless of the data fed into it. This was because of the way Mann used Principal Component analysis. In simple terms, Mann’s statistics blew out of all proportion any data which showed a hockey stick effect and ignored all other data.

Secondly, as far as tree rings were concerned, it was heavily dependent on bristlecone pines. It has long been known that the marked increase in bristlecone growth in the 19th and 20thC is due to CO2 fertilization, not temperature. When bristlecones are taken out of Mann’s analysis. the hockey stick disappears.

Thirdly, when tree ring and other proxy data diverged from rising temperature data in the late 20thC, Mann ignored the proxies and spliced the temperature data onto his graph.

There are also a whole host of other major flaws in the Hockey Stick, not related to tree rings.

Climate Scientists Step Up the Climate Emergency Narrative

by E. Worrall, June 13, 2020 in WUWT


MIP6 Climate Sensitivities. Source Carbon Brief

Guest essay by Eric Worrall

Even worse than we thought ™. Despite a recent sanity test study which demonstrated that high end climate models hindcast impossible Eocene temperatures, climate scientists are pushing ahead anyway with their new, even more extreme climate projections.


Continuer la lecture de Climate Scientists Step Up the Climate Emergency Narrative

DWD Reverses: Admits Data From Germany’s Infamous Ultra-Hot Lingen Weather Station Need To Be Rechecked

by P. Gosselin, June10, 2020 in NoTricksZone


Recently I wrote here how Germany’s now infamous record-setting weather station in Lingen was producing readings that were 2-3°C hotter than surrounding stations, yet the German DWD weather service refused to acknowledge the station was likely producing bad data. Today they admit the station has problems and that they will be moving it to a better location.

Last year’s all-time record high is now in question.

Lingen’s heated readings

Last summer the Lingen station, located in northwest Germany near the Dutch border, smashed the country’s all-time record high when the ‘mercury’ rose to a scorching 42.6°C during a late July heat wave. The previous all-time high for Germany was a comparatively cool 40.3°C.


Lingen’s readings of late July 2019 compared to other stations in the surrounding region (July 23 – July 27).

WHY ARE FOSSIL FUELS SO HARD TO QUIT?

by S. Gross, June 2020 in Brookings.Edu


We understand today that humanity’s use of fossil fuels is severely damaging our environment. Fossil fuels cause local pollution where they are produced and used, and their ongoing use is causing lasting harm to the climate of our entire planet. Nonetheless, meaningfully changing our ways has been very difficult.

But suddenly, the COVID-19 pandemic brought trade, travel, and consumer spending to a near-standstill. With billions of people recently under stay-at-home orders and economic activity plunging worldwide, the demand for and price of oil have fallen further and faster than ever before. Needless to say, oil markets have been in turmoil and producers around the world are suffering.

Note: MJ/kg = megajoules per kilogram
Sources: The Engineering Toolbox; Epec Engineered Technologies
 …

Weather Extremes? Are they caused by global warming?

by Ralph Alexander, June 4, 2020 in CO2Colation


Critical Review Confirms IPCC Assessment On Extreme Weather: “No sign that extreme weather events are getting worse”

The paper, by physicist Dr Ralph Alexander, looks at trends in hot and cold weather extremes, floods and droughts, hurricanes and wildfires and finds only a minor increase in cold weather extremes.

According to Dr Alexander, weather extremes is one area where the IPCC has been reasonably empirical and scientific in recent years.

As he explains:

The IPCC stands out, among those who believe that global warming is primarily due to human activity, as a voice of restraint on the issue of extreme weather. My review is in broad agreement with their position: there is little sign things are getting worse.”

In particular, Dr Alexander points to the underreported global reductions in floods, wildfires and hurricanes, but he cautions that many of the changes are likely to be cyclical.

The key driver for many weather extremes is natural ocean cycles like El Nino and the Atlantic Multidecadal Oscillation. Eventually these cycles will turn, and we should be ready. But we shouldn’t be under any illusion that we can prevent extreme weather by changing our lifestyles”.

Weather Extremes: Are They Caused By Global Warming? (pdf)

Renewable energy development threatens many globally important biodiversity areas

by Rehbein J.A. et al., March 2020, in GlobalChangeBiology


Transitioning from fossil fuels to renewable energy is fundamental for halting anthropogenic climate change. However, renewable energy facilities can be land‐use intensive and impact conservation areas, and little attention has been given to whether the aggregated effect of energy transitions poses a substantial threat to global biodiversity. Here, we assess the extent of current and likely future renewable energy infrastructure associated with onshore wind, hydropower and solar photovoltaic generation, within three important conservation areas: protected areas, Key Biodiversity Areas and Earth’s remaining wilderness. We identified 2,206 fully operational renewable energy facilities within the boundaries of these conservation areas, with another 922 facilities under development. Combined, these facilities span and are degrading 886 protected areas, 749 Key Biodiversity Areas, and 40 distinct wilderness areas. Two trends are particularly concerning. First, while the majority of historical overlap occurs in Western Europe, the renewable electricity facilities under development increasingly overlap with conservation areas in South East Asia, a globally important region for biodiversity. Second, this next wave of renewable energy infrastructure represents a ~30% increase in the number of protected areas and Key Biodiversity Areas impacted and could increase the number of compromised wilderness areas by ~60%. If the world continues to rapidly transition towards renewable energy these areas will face increasing pressure to allow infrastructure expansion. Coordinated planning of renewable energy expansion and biodiversity conservation is essential to avoid conflicts that compromise their r​e​s​p​e​c​t​

Germany’s DWD National Weather Service Denies Station Siting Problem: “Dubious” All-Time Record Temperature Allowed To Stand

by P. Gosselin, May 26, 2020 in NoTricksZone


Leading German daily Bild here reports on the controversy, which still continues to swirl, over Germany’s all-time record high temperature recorded last year in North Germany near the Dutch border.

Independent meteorologists say the readings needs to be thrown out

Last year on July 25th, the Lingen thermometer reached a whopping 42.6°C, far eclipsing the old German all-time record of 40.3°C. But that recording quickly came under fire by independent weather experts who say the station data were  corrupted by siting issues. The Lingen station is located in a depression in the earth, near a parking lot, and shielded by trees from the wind, thus creating the ideal conditions for trapping heat.

Comparison to nearby stations shows huge anomaly

Last year NTZ reported on the controversial record here noting that surrounding stations did not even come close to record reading in Lingen. What follows is a comparison of the Lingen’s readings to those of 6 nearby stations over the five day period, July 23 – July 27:

The Yin and Yang of Holocene Polar Regions Andy May / 1 day ago May 27, 2020

by R. Hannon/A. May, May 27, 2020 in WUWT


Introduction

The Arctic and Antarctic regions are different and yet similar in many ways. The Arctic has ocean surrounded by land and the Antarctic is a continent surrounded by water. Both are cold, glaciated and located at Earth’s poles some 11,000 miles apart. While sea ice has been retreating in the Arctic, it has been relatively stable in the Antarctic. This post examines surface temperature trends, solar insolation, and CO2 at the polar Arctic and Antarctic regions during the Holocene interglacial period.


Continuer la lecture de The Yin and Yang of Holocene Polar Regions Andy May / 1 day ago May 27, 2020