Not a single EU state is meeting its climate targets, a new analysis by CAN Europe finds.
It’s been close to three years since countries worldwide signed the Paris Agreement, which obligates nations pledge to commit themselves to intending (or something like that) to reduce their greenhouse gas emissions in order to “safeguard the planet’s future”.
The language of the Agreement is in fact non-binding, and so one wouldn’t be surprised to learn that some signatories might not be living up to the agreement’s spirit.
Richard Siegmund Lindzen is an American atmospheric physicist known for his work in the dynamics of the atmosphere, atmospheric tides, and ozone photochemistry. He has published more than 200 scientific papers and books. From 1983 until his retirement in 2013, he was Alfred P. Sloan Professor of Meteorology at the Massachusetts Institute of Technology. He was a lead author of Chapter 7, “Physical Climate Processes and Feedbacks,” of the Intergovernmental Panel on Climate Change’s Third Assessment Report on climate change. He has criticized the scientific consensus about climate change and what he has called “climate alarmism.”
by Paul Berth, 16 juin 2018 in ScienceClimatEnergie
Les ours polaires (Ursus maritimus) sont souvent utilisés dans le débat concernant le réchauffement climatique qui serait provoqué par l’homme. Selon les écologistes et les partisans du GIEC ils sont en grand danger. Mais n’est-ce pas aller un peu vite?
Water, H2O, determines the ‘General Background Temperature’ for the Earth, resulting in Hothouse and Ice House Climate States. During geological periods the movement of continents changes the position of
continents, oceans and seas. Because of the different configurations, a dominant warm or a dominant cold deep-water production configuration ‘sets’ average temperatures for the deep oceans. Changing vertical oceanic circulation changes surface temperatures, especially in the higher latitudes. During a Hot House State, higher temperatures in the high latitudes result in a high water-vapor concentration that prevents a rapid loss of thermal energy by the Earth.
These three processes, plate tectonics (continental drift), vertical oceanic circulation variability and variations in atmospheric water vapor concentration and distribution, caused previous Hot House and Warm House Climate States. A change in the working of those mechanisms resulted in a transition from the previous Hot House Climate State to the very cold ‘Ice House State’ that we live in now. That change was set in motion by the changing configuration of continents, oceans and seas.
Some have speculated that the distribution of relative humidity would remain roughly constant as climate changes (Allen and Ingram 2002). Specific humidity can be thought of as “absolute” humidity or the total amount of water vapor in the atmosphere. We will call this amount “TPW” or total precipitable water with units of kg/m2. As temperatures rise, the Clausius-Clapeyron relationship states that the equilibrium vapor pressure above the oceans should increase and thus, if relative humidity stays the same, the total water vapor or specific humidity will increase. The precise relationship between specific humidity and temperature in the real world is unknown but is estimated to be between 0.6 to 18% (10-90%ile range) per degree Celsius from global climate model results (Allen and Ingram 2002) …
Lack of information is a major problem in reconstructing and understanding climate and climate mechanisms. H.H.Lamb gave it as his reason for creating the Climatic Research Unit (CRU).
Notice he is talking about “the facts”, which includes data and other measures. Chief among the other measures are accurate chronologies, which is why he discusses dates and dating methods at some length in Volume 2 of his Climate, Present, Past and Future.
Lamb also divided climate studies into three major areas based on time and method. The secular or instrumental period covers at most 100 years. Few stations are longer and almost all are in Western Europe or eastern North America. The historical period includes the recorded works of humans and covers at most 3000 years. The biologic/geologic record covers the remainder of time. The degree of accuracy diminishes both in measures, such as temperature and precision of dates, as you go back in time. One tragedy of the “hockey stick” rarely discussed was that it misused and demeaned the value of one of the few measures that transcends two or three of these divisions.
WUWT reader “ES” writes: It is not bad enough we have global warning but, now we have warming on the moon. “increased from 1.6 C to 3.5 C over the roughly six-year period measurements were being taken.”
Astronauts’ movement increased subsurface temperatures on the moon, study finds.
On June 8th, the California Department of Forestry and Fire Protection (Cal Fire) made its first official announcement via press release that 12 big Northern California wildfires in October 2017 were caused by problems associated with electric utility power lines.
The October 2017 Fire Siege involved more than 170 fires and burned at least 245,000 acres in Northern California. About 11,000 firefighters from 17 states and Australia helped battle the blazes. They concluded that 12 Wildfires in Mendocino, Humboldt, Butte, Sonoma, Lake, and Napa Counties were caused by Pacific Gas & Electric (PG&E) “power and distribution lines, conductors and the failure of power poles.”
The words “global warming” and “climate change” were conspicuously absent from the announcement even…
Solar cycle 24 is ending and we are approaching a time of minimal solar activity between solar cycles 24 and 25, known as a solar minimum. Despite claims that we understand how the Sun works, our solar predictive skills are still wanting, and the Sun continues to be full of surprises.
The surprising 2008 solar minimum
Solar scientists did not pay much attention to the early warning signs that the Sun was behaving differently during solar cycle 23 (SC23), and to most the surprise came when the expected solar minimum failed to show up in 2006. The SC23-24 minimum took place two years later (Dec 2008, according to SIDC), and despite showing only a tiny difference in total solar irradiation compared to previous minima of the space age, it displayed significantly reduced solar wind speed and density, extreme-UV flux was 10% reduced, the polar fields were 50% smaller, and the interplanetary magnetic field strength was 30% below past minima.
A team of researchers from the U.K. Met Office, Sweden and Australia has found that three periods of global warming slowdown since 1891 were likely due to natural causes rather than disruptions to the factors causing global warming. In their paper published on the open access site Science Advances, the group describes their study of global mean surface temperatures (GMST) since the late 19th century and what they found.
In this new paper, the researchers looked at GMST as registered by multiple sources around the globe over the past 127 years, noting the slow march of temperature increases. More specifically, they noted the three previously identified slowdowns in GMST increases—the time periods from 1896 to 1910, from 1941 to 1975, and then from 1998 to 2013. They then looked at factors that could have contributed to these slowdowns and found natural causes for each. (…)
The following true story is a cautionary tale for scientists against making quick judgements about what seems impossible. Or indeed for any “experts” believing that they know best and ignoring any evidence contrary to what they believe. Does this ring any bells relating to the global warming hypothesis?
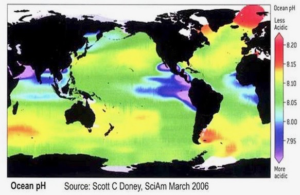
Voici quelques réflexions sur la théorie de l’acidification des océans. Selon cette théorie, le pH des océans diminuerait inlassablement, en raison du CO2 qui ne cesse de s’accumuler dans l’atmosphère.
• Les mesures directes de pH sont récentes et nous n’avons aucun recul. Selon les médias et les ONG écologistes, qui se basent sur le GIEC et sur certaines publications (e.g., Caldeira & Wickett 2003), le pH des océans aurait été de 8.25 en 1750. Cependant, il faut savoir que personne n’a jamais mesuré le pH des océans en 1750, puisque le concept de pH n’a été inventé qu’en 1909 (par le danois Søren P.L. Sørensen), et que les premiers appareils fiables pour mesurer le pH ne sont apparus qu’en 1924… Nous ne sommes donc pas certains de cette valeur de 8.25 pour 1750… La valeur de 8.25 est donc obtenue par des mesures indirectes et n’est donc pas certaine.
• A l’heure d’aujourd’hui, tous les pH sont possibles. Lorsqu’on dit que les océans actuels sont à un pH de 8.1, de quel océan parle-t-on? S’agit-il du pH moyen global? Si c’est de cela qu’on parle, quelle est l’incertitude sur la mesure? (i.e., l’écart-type?). Ceci n’est jamais indiqué. Il faut savoir que si l’on prend un jour de la semaine, tous les pH sont possibles dans les océans, comme l’illustre très bien la figure suivante.
When if comes to debunking Gorebal Warming, Chicken Little of the Sea (“ocean acidification”) and other Warmunist myths, my favorite starting points are my old college textbooks.
Way back in the Pleistocene (spring semester 1979) in Marine Science I, our professor, Robert Radulski, assigned us The Oceans by Sverdrup (yes, that Sverdrup), Johnson and Fleming. Even though it was published in 1942, it was (and may still be) considered the definitive oceanography textbook. I looked up “ocean acidification” in the index… It wasn’t there.
The notion that CO2 partial pressure influences the pH of seawater isn’t a new concept, *surely* ocean acidification must have been mentioned in at least one of my college textbooks.
Dr. Boris M. Smirnov, a prominent atomic physicist, has authored 20 physics textbooks during the last two decades. His latest scientific paper suggests that the traditional “absorption band” model for calculating the effect of atmospheric CO2 during the radiative transfer process is flawed. New calculations reveal that the climate’s sensitivity to a doubling of the CO2 concentration is just 0.4 K, and the human contribution to that value is a negligible 0.02 K.
SPOTLIGHT: Whether the predictions in Paul Ehrlich’s 50-year-old bestseller, The Population Bomb, were right or wrong matters. Because scientists and environmentalists continue to follow in his footsteps.
BIG PICTURE: Ehrlich is an important case study. His conviction that humanity is a blight on the planet is shared by many ordinary people, as well as by many influential ones (…)
by Wallace Manheimer, June 4, 2018 in ClimateChangeDispatch
A claimed nearly unanimous scientific consensus on fear of climate change has caused a push to substantially reduce or even eliminate the use of fossil fuel in favor of solar and wind.
But three crucial questions are: 1) is the scientific community really united? 2) can solar and wind take over any time soon to provide the required vital energy for the maintenance of modern civilization in today’s world of 7 billion people?, and 3) has CO2 caused any harm yet? The answer to all three questions is no.
A major theme of this essay is that many assertions can easily be checked out by a simple Google search.
After finally realizing that the claimed rising temperatures never showed up around the globe, the scientific community is being told through its most respected publications that specific forms of pollution that are human-generated are keeping populations from experiencing the toll of other airborne human-made emissions.
“Pollution in the atmosphere is having an unexpected consequence, scientists say – it’s helping to cool the climate, masking some of the global warming that’s occurred so far,” Scientific American reported last week. “That means efforts worldwide to clean up the air may cause an increase in warming, as well as other climate effects, as this pollution disappears.”
There is a continuing debate over sea level rise, especially how much will occur in the future. The most annoying part of the news media reporting on the issue is that they imply sea level rise is all the fault of humans.
This is why the acceleration of sea level rise is what is usually debated, because sea level has been rising naturally, for at least 100 years before humans could be blamed. So, the two questions really are (1) Has sea level rise accelerated?, and (2) how much of the acceleration is due to humans?
Yesterday’s spat between Gavin Schmidt and Willis Eschenbach dealt with the question of whether sea level rise has accelerated or not. Gavin says it has. Willis says not, or at least not by a statistically significant amount. (…)
This manntastic event looms large. With the irascible Dr. Mann pitted against Moore and Curry, fireworks are almost guaranteed. Titley is a lightweight and he’ll be overshadowed by Mann’s huge ego and need to control the conversation. Their idea to hear a “collegial and balanced” discussion may very well be a pipe dream, especially after what happened the last time when Mann and Curry were testifying before congress.
BIG PICTURE: The Population Bomb was first published in May 1968 – 50 years ago this month. Page one of my copy, printed in 1970, describes its author as “a qualified scientist.” The back cover provides further detail: (…)
A landmark paper by warmist scientists in Nature Geosciencenow concedes the world has indeed not warmed as predicted, thanks to a slowdown in the first 15 years of this century. One of its authors, Michael Grubb, professor of international energy and climate change at University College London, admits his past predictions of runaway warming were too alarmist.
“When the facts change, I change my mind. We are in a better place than I thought.”
ANOTHER author, Myles Allen, professor of geosystem science at Oxford, confessed that too many of the mathematical models used by climate scientists to predict future warming “were on the hot side” — meaning they exaggerated.
“We haven’t seen that rapid acceleration in warming after 2000 that we see in the models.”
Scientists claim that the ocean’s global mean surface pH may have declined (i.e., became less alkaline and thus more “acidic”) by -0.08 in the last 265 years — from 8.13 during pre-industrial times to 8.05 today. That’s an overall, long-term pH change rate of -0.0003 per year.
By way of comparison, from one season to the next, or over the course of less than a year, pH levels naturally change by twice that amount (±0.15 pH units). On a per-decade scale, oceanic pH can naturally fluctuate up and down by up to 0.6 units within a span of a decade (as shown in red below).
La géologie, une science plus que passionnante … et diverse