Archives par mot-clé : Fun?/Discussion

US Government Tries To Erase Historical Forest Fire Data To Fabricate Another Fake Crisis

by P. Gosselin, June 8, 2021 in NoTricksZone


The US government deletes more than 50 years of early data on forest fires in order to make it look like forest fires are more widespread, and linked to CO2. Should be Investigated under the RICO Act. 

There’s a reason why Smokey the Bear has been around more than 75 years with his message. “Only you can prevent forest fires.” The US government had known for decades that forest fires were a serious problem – much more serious than today.

They have forest fire data going back over 100 years. But suddenly, since January of this year, the US government is acting like there had never been a Smokey the Bear before 1983 and that forest fires are just a recent problem caused by manmade climate change.

It’s all a fraud, explains data analyst and software expert Tony Heller in his latest video.

CARBON CYCLE

by C. Spencer, June 7, 2021 in WUWT


The increase in 12C in the atmosphere is, in my opinion, weak evidence that the annual increases are driven only by fossil fuel sources. The atmosphere can’t tell ‘anthropogenic’ carbon dioxide from natural carbon dioxide. It seems unlikely that a source that represents only about 4% of the total flux is going to drive the system. The oceans sequester the vast majority of the carbon. One would expect that warming oceans (from whatever forcing) would increase the rate of out-gassing in mid-latitudes, and decrease the rate of extraction at high-latitudes. It seems more reasonable to me that, in a world with warming oceans, there would be a shift in the relative amounts of carbon in the oceans and the atmosphere. That would be the case even in the absence of any anthropogenic carbon.


….

….

No sign of a climate emergency

by GWPF, May 29, 2021


A new review of weather and climate data based on observational data from 2020 finds little evidence to support the idea of a “climate emergency”.


The annual report, by Professor Ole Humlum, reviews a wide range of temperature and weather data, as well as records on sea-level, storms and ice and snow cover.

Temperature records for the Earth’s surface show that 2020 was a comparatively warm year, but that by the end of the year there was a marked cooling driven by natural ocean cycles in the Pacific. This cooling was also observed higher in the atmosphere.

Sea ice levels globally remained low, but are now increasing in the Southern Hemisphere. Global snow cover remained stable and there is still no significant trend in tropical storms.

Professor Humlum said:

The weather and weather extremes we are experiencing are still dominated by natural fluctuations. Rapid and frightening changes are nowhere to be seen in the observational data as this annual review shows.”

https://www.thegwpf.org/content/uploads/2021/05/State-of-the-Climate-2020.pdf

CO2 Cyclone Doomsday Flat Out Refuted: 170 Years “Absolutely No Trend” In Hurricane Intensity/Frequency

by P. Gosselin, May, 22, 2021 in NoTricksZone


The latest comes from statistics expert, Zoe Phin, who looks at the alarmists’ claim that increasing CO2 emissions are leading to more frequent and intense Atlantic hurricanes.

Alarmist claims cost nothing, and so easily made. Zoe Phin looks at whether the hurricane alarmist claim holds up.

Frequency

First Zoe looked at the (HURDAT2) data to find out if the first of the two claims (increasing frequency) is true. At first glance it would appear so.

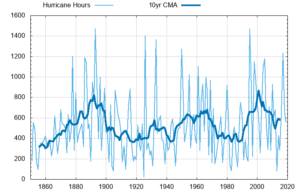
But Zoe asks if the method of measuring the frequency really is sensible and if it maybe weren’t better to measure the amount of time the Atlantic spends in hurricane mode? To find out, Zoe plotted the hurricane hours data and the 10-year moving average:

Source: Zoe Phin.

….

New Study Casts Doubt On Controversial Theory Linking Melting Arctic To Severe Winter Weather

by P. Voosen, May 13, 2021 in ClimagteChangeDispatch


Every time severe winter weather strikes the United States or Europe, reporters are fond of saying that global warming may be to blame.

The paradox goes like this: As Arctic sea ice melts and the polar atmosphere warms, the swirling winds that confine cold Arctic air weaken, letting it spill farther south.

But this idea, popularized a decade ago [and was the outlandish plotline in The Day After Tomorrow, pictured], has long faced skepticism from many atmospheric scientists, who found the proposed linkage unconvincing and saw little evidence of it in simulations of the climate.

Now, the most comprehensive modeling investigation into this link has delivered the heaviest blow yet: Even after the massive sea ice loss expected by midcentury, the polar jet stream will only weaken by tiny amounts—at most only 10% of its natural swings.

And in today’s world, the influence of ice loss on winter weather is negligible, says James Screen, a climate scientist at the University of Exeter and co-leader of the investigation, which presented its results last monthat the annual meeting of the European Geosciences Union.

Wandering polar bears are the new starving polar bears, falsely blamed on climate change

by Polar Bear Science, May 15 , 2021


Back in 2017, we famously had National Geographic falsely blaming a starving polar bear on climate change but since then we have been inundated (relatively speaking) with stories of ‘wandering’ bears sighted far from Arctic coastlines. These wandering bears are oddities to be sure but are not in any way an indicator of melting Arctic sea ice or lost habitat, as The Times (UK) has claimed in this latest example (Polar bear treks 1,500 miles south as Arctic hunting zone melts away).

The Greenhouse Effect In A Water World

by B. Irvine, May 17, 2021 in WUWT


A knowledge of Greenhouse gases is fundamental to any understanding of global surface temperatures. The presence of GHGs in our atmosphere has increased the global surface temperature by about 33C.

There are multiple lines of evidence, however, that challenge the strong water vapour feedback to a small initial CO2 forcing.  These strong positive feedbacks are central to the IPCC narrative.

These lines of evidence include.

  • The failure of all models and catastrophic warming projections.
  • The stubborn refusal of atmospheric Precipitable Water Vapour (PWV) concentration to rise in recent years.
  • The strength of convection cells in the tropics that have kept tropical temperatures approximately the same for many millions of years.
  • Irrigation and extra humidity generally coincide with cooler temperatures.
  • The hot spot as a signature of the positive Water Vapour (WV) feedback and its opposite, the negative lapse rate feedback, has not occurred.

INTRODUCTION

Rising Sea Levels No Cause For Apocalyptic Climate Claims

by J. Tennebaum, May 12, 2021 in ClimateChangeDispatch


Former US Energy Department chief scientist Steven Koonin says sea levels rise at changing rates and sees ‘no signs’ of a climate apocalypse.

Here we continue our interview with Dr. Steven Koonin, chief scientist in the US Department of Energy during the Barack Obama administration and author of the just-published book, Unsettled: What Climate Science Tells Us, What It Doesn’t, And Why It Matters

….

….


Does ocean acidification alter fish behavior? Fraud allegations create a sea of doubt

by P. Homewood, May 7, 2021 in NotaLotofPeopleKnowThat


When Philip Munday discussed his research on ocean acidification with more than 70 colleagues and students in a December 2020 Zoom meeting, he wasn’t just giving a confident overview of a decade’s worth of science. Munday, a marine ecologist at James Cook University (JCU), Townsville, was speaking to defend his scientific legacy.

But their work has come under attack. In January 2020, a group of seven young scientists, led by fish physiologist Timothy Clark of Deakin University in Geelong, Australia, published a Nature paper reporting that in a massive, 3-year study, they didn’t see these dramatic effects of acidification on fish behavior at all.

REVEALED: Al Gore’s real climate catastrophe

by Ian Plimmer & John Ruddick, Apr 29, 2021 in SpectatorAustralia


Next month is the thirtieth anniversary of the most entertaining and damning chapter in Al Gore’s career.

By the mid-nineteenth century, our knowledge of atmospheric chemistry was sufficiently advanced for a few sharp minds to ponder whether an increase in carbon dioxide might increase global temperature.  The speculation remained entirely theoretical until 1957 when an international collaboration of top geophysicists — including the Soviets — used buoys, weather balloons and so forth to collect data.  The undertaking was led by Dr Roger Revelle then based at California’s Scripps Institute of Oceanography.  Today’s global warming debate is hyper-partisan but all agree Revelle’s standing is impeccable.

Before this research, many assumed the ocean was absorbing most of the increase in carbon dioxide caused by industrialisation.  Revelle’s data, however, indicated only half was. So what was happening to the other half?  Would the planet soon overheat?

Oceanic Warming? Well, sorta.

by W. Eschenbach, May 1, 2021 in WUWT


After my last post about the surface warming of the ocean, entitled “How Global Warming Isn’t“, I got to thinking about the warming of the upper part of the ocean. So I got the data for the ocean heat content (OHC) of the top 700 metres of the ocean from the marvelous site, KNMI. If you look under “Monthly Observations” you’ll find a host of most fascinating datasets. Under “Heat Content” on that page, you’ll find the National Oceanic Data Center (NODC) 0-700 metre depth OHC data. And down at the very bottom of that page is a link that will download a 196 megabyte gridded NetCDF file containing the data that I used. (Big file, click at your own risk.)

And what did I find? Well, I’m a visual kind of guy. I mean, I can do the math, but it only makes sense when it comes up as a picture on the silver screen. So here are my graphics. I’m interested in the changes in the oceanic heat content, so these are two views of those trends.

This is the bottom line. If the world’s creatures, both on land and at sea, were as temperature-sensitive as the alarmists would have us believe, those beings (and we humanoids as well) all would have gone extinct long ago. And near as I can tell, that hasn’t occurred … at least yet.

Gavin’s Falsifiable Science

by W. Eschenbach, Apr 2020 in WUWT


Gavin Schmidt is a computer programmer with the Goddard Institute of Space Sciences (GISS) and a noted climate alarmist. He has a Ph.D. in applied mathematics. He’s put together a twitter threadcontaining what he sees as some important points of the “testable, falsifiable science that supports a human cause of recent trends in global mean temperature”. He says that the slight ongoing rise in temperature is due to the increase in carbon dioxide (CO2) and other so-called “greenhouse gases”. For simplicity, I’ll call this the “CO2 Roolz Temperature” theory of climate. We’ve discussed Dr. Schmidt’s ideas before here on WUWT.

Now, Gavin and I have a bit of history. We first started corresponding by way of a climate mailing list moderated by Timo Hameraanta back around the turn of the century, before Facebook and Twitter.

The interesting part of our interaction was what convinced me that he was a lousy programmer. I asked him about his program, the GISS Global Climate Model. I was interested in how his model made sure that energy was conserved. I asked what happened at the end of each model timestep to verify that energy was neither created nor destroyed.

He said what I knew from my own experience in writing iterative models, that there is always some slight imbalance in energy from the beginning to the end of the timestep. If nothing else, the discrete digital nature of each calculation assures that there with be slight roundoff errors. If these are left uncorrected they can easily accumulate and bring the model down.

He said the way that the GISS model handled that imbalance was to take the excess or the shortage of energy and sprinkle it evenly over the entire planet.

Now, that seemed reasonable for trivial amounts of imbalance coming from digitization. But what if it were larger, and it arose from some problem with their calculations? What then?

So I asked him how large that energy imbalance typically was … and to my astonishment, he said he didn’t know.

Amazed, I asked if he had some computer version of a “Murphy Gauge” on the excess energy. A “Murphy Gauge” (below) is a gauge that allows for Murphy’s Law by letting you set an alarm if the variable goes outside of the expected range … which of course it will, Murphy says so. On the computer, the equivalent would be something in his model that would warn him if the excess or shortage of energy exceeded some set amount.

Obama administration scientist says climate ‘emergency’ is based on fallacy

by Dr S. Koonin, Apr 24, in NewYorkPost


‘The Science,” we’re told, is settled. How many times have you heard it?

Humans have broken the earth’s climate. Temperatures are rising, sea level is surging, ice is disappearing, and heat waves, storms, droughts, floods, and wildfires are an ever-worsening scourge on the world. Greenhouse gas emissions are causing all of this. And unless they’re eliminated promptly by radical changes to society and its energy systems, “The Science” says Earth is doomed. 

Yes, it’s true that the globe is warming, and that humans are exerting a warming influence upon it. But beyond that — to paraphrase the classic movie “The Princess Bride” — “I do not think ‘The Science’ says what you think it says.”

For example, both research literature and government reports state clearly that heat waves in the US are now no more common than they were in 1900, and that the warmest temperatures in the US have not risen in the past fifty years. When I tell people this, most are incredulous. Some gasp. And some get downright hostile.

These are almost certainly not the only climate facts you haven’t heard. Here are three more that might surprise you, drawn from recent published research or assessments of climate science published by the US government and the UN:

  •  Humans have had no detectable impact on hurricanes over the past century.
  • Greenland’s ice sheet isn’t shrinking any more rapidly today than it was 80 years ago.
  • The global area burned by wildfires has declined more than 25 percent since 2003 and 2020 was one of the lowest years on record.

Why haven’t you heard these facts before?

See also : New High Resolution Climate Simulation Projects Antarctic Ice To Remain Stable Rest Of The Century

An anti–global warming hysteria book is driving Norwegian warming hysterics nuts

by G. Tomb, Apr 9, 2021 in AmercianThinker


Other than by misspelling “fjord,” how would an American geologist draw the ire of a pair of Norwegian politicians?  Answer: Write a book that counters the notion that human activity is causing the globe to warm with catastrophic consequences.

Gregory Wrightstone’s 2017 book, Inconvenient Facts: The Science that Al Gore Doesn’t Want You to Know, was published in Norway and is being promoted by the Climate Realists, a Norwegian organization, which shares the author’s view that modern warming is neither unusual nor unprecedented.

Backed with 90 illustrations and 15 pages of references, the book presents 60 footnoted facts inconvenient to the Western elite’s absurd narrative about global warming.  Among them: Most of the last 10,000 years have been warmer than today, including the Medieval Warm Period, when Vikings raised barley on Greenland, and the Roman Warm Period, when citrus grew in northern England.

Follow the Science: Seas Rising 20 Times Slower than the Media Claim

by J. Taylor, Apr 13, 2021 in ClimateRealism


According to NASA and NOAA satellite instruments, sea level is rising at a mere 3 millimeters per year, which is a pace of just under one foot per century. (Note, the NASA/NOAA-reported 3.3 mm/year rise in Global Mean Sea Level includes a 0.3 mm “adjustment” that accounts for land rising as glaciers melt. The sea-level rise in relation to coastal shorelines is therefore 3.0 mm/year.) Moreover, the satellite measurements show no significant acceleration during recent decades in the pace of sea-level rise.

Given that seas are rising at a pace of merely one foot per century, which is little if any faster than the pace of sea-level rise throughout the global warming of the 1800s and 1900s, it is almost certain that seas will not rise 20 feet during the next 100 to 200 years. It is also almost certain that seas will not rise two feet during the next 20 years.

The Imaginary Climate Crisis: How can we Change the Message? A talk by Richard Lindzen

by Prof. Lindzen, Apr 7, 2021 in WUWT/Clintel


The Irish Climate Science Forum (ICSF) in cooperation with CLINTEL hosted a lecture by the world-renowned climate scientist Richard Lindzen. The online lecture was attended by around 200 people from around the world (including a group of climate activists who disturbed the talk. The recorded talk can be viewed here.


Professor Lindzen kindly agreed that his written speech could be posted here at CLINTEL. It follows below.


Richard S. Lindzen, Professor Emeritus of Atmospheric Sciences, MIT

For about 33 years, many of us have been battling against climate hysteria. We have correctly noted

The exaggerated sensitivity,
The role of other processes and natural internal variability,
The inconsistency with the paleoclimate record,
The absence of evidence for increased extremes, hurricanes, etc. and so on.

We have also pointed out the very real benefits of CO2 and even of modest warming. And, as concerns government policies, we have been pretty ineffective. Indeed our efforts have done little other than to show (incorrectly) that we take the threat scenario seriously. In this talk, I want to make a tentative analysis of our failure.

Subsidence In The Bangladesh Basin

by P. Homewood, Mach 26, 2021 in NotaLotofPeopleKnowThat


Absolute sea levels are rising by about 2mm a year, yet the land is subsiding by 2.2cm a year. A small part of this is due to isostasy, but most is evidently the result of “dewatering”, what we would call water extraction. (see here)

Whatever problems farmers in Bangladesh are having, it has nothing to do with climate change.

New Study: 100-Year Flood Events Have Decreased Globally Since 1970

by  K. Richard, Apr 6, 2021 in ClimateChangeDispatch


In contrast to alarming claims about rare, 100-year flood events now occurring every few years due to global warming, scientists have determined the exact opposite is more likely true.

Not only have flood frequencies declined globally in the last 50 years, but the probability of a 100-year flood event is now so rare it has only been occurring once every 358 years on average since 1970.

According to the IPCC, there has been no clear evidence of a global-scale increase in flood magnitude or frequency in the last century (Hodgkins et al., 2017).

A new study (Slater et al., 2021) suggests that claims of flood magnitude, frequency, and probability dramatically increasing with global warming can be “misleading” if they use a stationary calculation approach instead of continually updating significant changes over time.

These scientists, using “observed annual maximum daily streamflow” records and a “nonstationary approach,” concluded there has been no obvious global-scale trend in 20-, 50-, and 100-year flood magnitude since 1970, with 100-year flood events defined as “flows of a given exceedance probability in each year.

It’s Here: Morano’s New book: ‘Green Fraud: Why The Green New Deal Is Even Worse Than You Think

by M.  Steyn, March 23, 2021 in ClimateDepot


Morano’s probably single-handedly, in a civilian sense, the guy (other than me, of course) doing a better job of ringing the bells alarming people of what’s going on here.” Rush Limbaugh

“This is a must-read book that shows how the Green New Deal is dangerous, impractical, misguided, and guaranteed to fail with disastrous results for the American people.”  —Sean Hannity, host of Hannity on Fox News

“’Green Fraud’ is the ultimate guidebook to exposing and fighting this Marxist plan masquerading as environmental policy.”  —Mark R. Levin, author and nationally syndicated TV and radio broadcaster

Also see Daily Signal’s interview w/ Morano: “Green Fraud,” a new book from @ClimateDepot’s Marc Morano, exposes far-reaching implications of the #GreenNewDeal & what freedom-loving #Americans can do. 

Here is a promotional video from the publisher on the book: https://twitter.com/Regnery/status/1370512451322716160

“If you care about America’s future, read this book.”—Mark Levin

“A must-read book that shows how the Green New Deal is dangerous, impractical, misguided, and guaranteed to fail with disastrous results for the American people.”—Sean Hannity

A New Lockdown to “Save” the Climate

That’s what’s in store for us if Alexandria Ocasio-Cortez and the Democrats pass their radical climate plan—the Green New Deal.

It is packed with guarantees so completely irrelevant to the problem it purports to “solve” (like “free college” and incomes for everyone “unable or unwilling to work”) that even its boosters have admitted it’s not really about the climate.

The intrepid Marc Morano, author of the bestselling Politically Incorrect Guide to Climate Change, breaks down the science and the politics to expose the truth about the Green New Deal:

• The science is settled: copious evidence—and prominent defections from the “climate consensus”—make clear we are not facing a man-made climate disaster

• “Climate change” is the perfect Trojan horse for the socialist agenda of the Left

• Fossil fuels lifted the West out of poverty—but our elites now want to deny them to the world’s poor

• The Green New Deal is on a collision course with self-government and our fundamental rights

Climate change has already been “solved” multiple times over the past two decades—with highly touted international agreements—and yet it never goes away as an excuse for leftist policies that will cripple our economy, impoverish the world, and take away our freedoms.

Packed with telling statistics, damning quotations, and real science, Green Fraud is your source for all the facts you need to understand—and resist—the threat.

CLIMATE CHANGE, COVID-19, AND THE GREAT RESET

by A. MacRae, March 2021 in Elecroverse


The below treatise was sent to Canadian and American politicians and the media – but most of them won’t understand it, because they have no scientific competence and have been utterly deceived – programmed for decades by false climate scares and green energy frauds.

SUMMARY

We published in 2002 that there was NO catastrophic human-made global warming /climate change crisis, and green energy schemes were NOT green and produced little useful (dispatchable) energy. Dangerous global warming and climate change have NOT HAPPENED and green energy schemes have proved to be COSTLY, UNRELIABLE AND INEFFECTIVE. Global warming is NOT a threat, but global cooling IS dangerous. In 2002 we predicted that global cooling would start circa 2020, based on low solar activity, and that prediction is increasingly supported by the evidence.

Politicians foolishly accepted very-scary global warming falsehoods and brewed the perfect storm, crippling our energy systems with costly and unreliable green energy schemes that utterly fail due to intermittency, at a time when we will need more reliable, dispatchable energy due to increased energy demand and imminent global cooling. The good people of Australia, Britain, Germany, California and Texas have all suffered and died due to green energy failures that were PREDICTABLE AND PREDICTED.

THE GREENS’ PREDICTIVE CLIMATE AND ENERGY RECORD IS THE WORST

False Alarm: IPCC Models Say A Warming Antarctica REDUCES Sea Levels -0.8 Of A Meter By 3000

by K. Richard, March 15, 2021 in NoTricksZone


The IPCC-endorsed anthropogenic global warming (AGW) paradigm finds a warming Antarctica results in more precipitation locked up as ice on the continent. This contributes to reducing sea levels: a -1.2 mm/year−1 mitigation of sea level rise over the next 80 years.

In the 4th IPCC report, Working Group 1 (the physical science) reported that as global temperatures rise,GCMs [models] indicate increasingly positive SMB for the Antarctic Ice Sheet as a whole because of greater accumulation.” This means that by 2100 Antarctica “would contribute 0.4 to 2.0 mm yr−1 of sea level fall.” Over the next 980 years, Antarctica’s ice accumulation will reduce sea levels by nearly a full meter (-0.8 m by 3000).

Clouds From Both Sides Now

by W. Eschenbach, March 15, 2021 in WUWT


Clouds are said to be the largest uncertainty in climate models, and I can believe that. Their representation in the models is highly parameterized, each model uses different parameters as well as different values for the same parameters, and so of course, different models give very different results. Or to quote from the IPCC, the Intergovernmental Panel on Climate Change:

In many climate models, details in the representation of clouds can substantially affect the model estimates of cloud feedback and climate sensitivity. Moreover, the spread of climate sensitivity estimates among current models arises primarily from inter-model differences in cloud feedbacks. Therefore, cloud feedbacks remain the largest source of uncertainty in climate sensitivity estimates.

The question of importance is this—if the earth heats up, will clouds exacerbate the warming or will they act to reduce the warming? The general claim from mainstream climate scientists and the IPCC is that the clouds will increase the warming, viz:

All global models continue to produce a near-zero to moderately strong positive net cloud feedback.

My own theory is that clouds and other emergent climate phenomena generally act to oppose any increases in surface temperature. So me, I’d expect the opposite of what the models show. I figured that there should be a negative cloud feedback that opposes the warming.

So I thought I’d take a look at answering the question using the CERES satellite dataset. As a prologue, here’s a short exposition about measuring the effect of clouds.

Michael Mann “Hockey Stick” Update: Now Definitively Established To Be Fraud

by F. Menton, Aug 26, 2021 in ManhattanContrarian


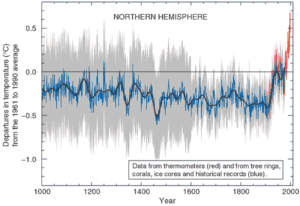
The Michael Mann “Hockey Stick” is suddenly back in the news. It’s been so long since we have heard from it, do you even remember what it is?

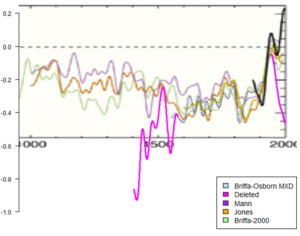
The “Hockey Stick” is the graph that took the world of climate science by storm back in 1998. That’s when Mann and co-authors Raymond Bradley and Malcolm Hughes published in Nature their seminal paper “Global-scale temperature patterns and climate forcing over the past six centuries.” A subsequent 1999 update by the same authors, also in Nature (“Northern Hemisphere Temperatures During the Past Millennium: Inferences, Uncertainties, and Limitations”) extended their reconstructions of “temperature patterns and climate forcing” back another 400 years to about the year 1000. The authors claimed (in the first paragraph of the 1998 article) to “take a new statistical approach to reconstructing global patterns of annual temperature . . . , based on the calibration of multiproxy data networks by the dominant patterns of temperature variability in the instrumental record.” The claimed “new statistical approach,” when applied to a group of temperature “proxies” that included tree ring samples and lake bed sediments, yielded a graph — quickly labeled the “Hockey Stick” — that was the perfect icon to sell global warming fear to the public. The graph showed world temperatures essentially flat or slightly declining for 900+ years (the shaft of the hockey stick), and then shooting up dramatically during the 20th century era of human carbon dioxide emissions (the blade of the stick).

Major February global temperature drop reveals the real climate control knob

by J. Bastardi, March 7, 2021 in CFACT


By now all of you know my belief ( bias) that it’s the oceans, and more so the tropical oceans, that are the biggest control knob of the weather and climate. If you really wanted to make this a controlled classroom experiment (nature is not a classroom with easy controls)  then I venture to say that the real way to know man’s influence is to have SST’s return to where they were in the 1970s, give it a couple of years for the water vapor adjustment, ( and if I am right. co2 will adjust as warmer oceans outsource it, so the outsourcing to the air will decrease) and see the difference there. And there you may be able to make an irrefutable argument for man’s contribution, Unfortunately for those who will not look at anything else,  that is likely to be quite small, but on the other hand, unlike the warming we have had which is really in the coldest driest places and more so at their coldest driest time of the year, you would likely find the lions share of what warming would be where life thrives.. As small as that has been, less than .25C of the numbers we see all the time that tell us that at. a bit over 59 degrees the planet is overheating, it is liable to be even less detectable and certainly as or more adaptable than what we seemed to have adapted to nicely here.

But the fear of course is runaway warming which is interesting since it counters Le Chateliers,  which I never hear anyone bring up, most likely because it’s a simple explanation. And a simple explanation would impact a lot of things relying on a done deal, complex explanation that the public must accept because they could never understand.

Danish Institute Data: Greenland Ice Melt Has Slowed Down Significantly Over Past Decade

by P. Gosselin, March 10, 2021 in NoTricksZone


The media and activists, among them a number of “Climate scientists”, have been declaring that Greenland ice melt has been accelerating.

Today the German Klimaschau climate news video reports, however, that this has not been the case over the recent years. All the recent talk about accelerating Greenland ice loss over the past years is false.

SMB on the rise

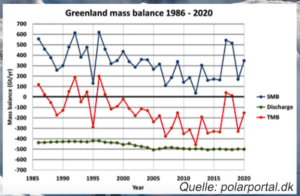
First a plot of Greenland’s surface mass balance SMB (blue curve below) shows that snow accumulation has occurred faster than snow and ice have melted over the past 35 years:

Chart: cropped from Klimaschau here

Though the annual SMB values declined from 1985 to 2012, the trend has rebounded since.

Loss through coastal discharge steady over the past 15 years