
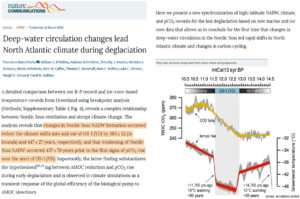
by Van der Bilt et al. , December 3, 2019 in GeophysResLetters
Abstract
Arctic climate is uniquely sensitive to ongoing warming. The feedbacks that drive this amplified response remain insufficiently quantified and misrepresented in model scenarios of future warming. Comparison with paleotemperature reconstructions from past warm intervals can help close this gap. The Early Holocene (11.7–8.2 ka BP) is an important target because Arctic temperatures were warmer than today. This study presents centennially resolved summer temperature reconstructions from three Svalbard lakes. We show that Early Holocene temperatures fluctuated between the coldest and warmest extremes of the past 12 ka, exceeding the range of instrumental observations and future projections. Peak warmth occurred ~10 ka BP, with temperatures 7 °C warmer than today due to high radiative forcing and intensified inflow of warm Atlantic waters. Between 9.5 and 8 ka BP, temperatures dropped in response to freshwater fluxes from melting ice. Facing similar mechanisms, our findings may provide insight into the near‐future response of Arctic climate.
…
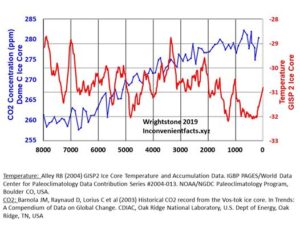
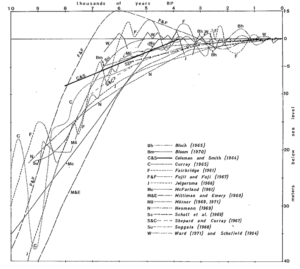
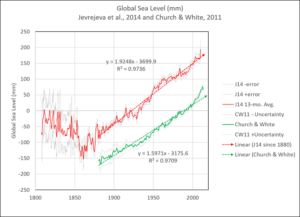 Figure 1. Jevrejeva et al., 2014 (red) and Church & White, 2011 (green).
