Archives par mot-clé : Holocene

How ancient dust from the sea floor helps to explain climate history

by UNIVERSITY OF OLDENBURG, Nov 11, 2020 in WUWT


During the last Ice Age about 20,000 years ago, iron-containing dust acted as a fertilizer for marine phytoplankton in the South Pacific, promoting CO2 sequestration and thus the glacial cooling of the Earth. But where did the dust come from? Researchers led by Dr. Torben Struve, geoscientist at the University of Oldenburg, Germany, have investigated this open question of climate history, which is also relevant with respect to current climate change.

Using sediment cores from the sea floor, they found that a large part of the dust deposited in the southern South Pacific at that time had travelled an extremely long way. Up to 80 percent of the dust came from what is now north-west Argentina, from where it was transported almost completely around the globe by the prevailing westerly winds. After a voyage of up to 20,000 kilometres, it contributed significantly to the increased input of iron into the glacial South Pacific. The dust input from Australia, which dominates in the South Pacific today, played only a minor role. The research team has published these new insights into the mechanisms of natural iron input into the Southern Ocean in the journal Nature Communications.

“We have analysed the chemical fingerprint of the dust and compared it with geological data from several continents. This was laborious work, like a jigsaw puzzle,” says Struve, a post-doctoral scientist in the research group “Marine Isotope Geochemistry” at the University’s Institute for Chemistry and Biology of the Marine Environment (ICBM). The team included researchers from his group as well as colleagues from the Alfred Wegener Institute – Helmholtz Centre for Polar and Marine Research, Bremerhaven (Germany), and from Columbia University, New York (USA).

3 More New Studies Show Modern Arctic Sea Ice Extent Is Greater Than Nearly Any Time In The Last 10,000 Years

by K. Richard, Oct 29, 2029 in NoTricksZone


For years scientists have been using biomarker evidence (IP25, PIP25) to reconstruct the Arctic’s sea ice history. The evidence shows modern (20th-21st century) Arctic sea ice is at its greatest extent since the Holocene began.

Scientists (Wu et al., 2020) have determined that from about 14,000 to 8,000 years ago, when CO2 lingered near 250 ppm, the Beaufort Sea (Arctic) was “nearly ice free throughout the year” (<0.2 PIP25) and ~4°C warmer than today in winter.

With CO2 at ~400 ppm, this region is 70-100% ice-covered (>0.8 PIP25) for all but 1-2 summer months in the modern (1988-2007) era.

….

“Where’s the sea ice?” Right where it’s been for most of the Holocene.

by D. Middleton, Oct 30, 2020 in WUWT


This is sort of a sequel yesterday’s post: Where’s the sea ice? 3 reasons the Arctic freeze is unseasonably late and why it matters.

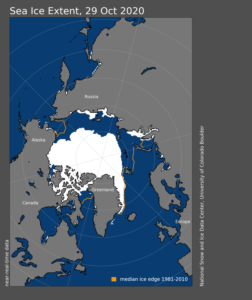
What a difference a day can make! Looks like it’s starting to crust over:

Figure 0. Daily sea ice extent map, October 29, 2020. (NSIDC)

Two key takeaways:

  1. Maximum Holocene sea ice extent occurred within the past 500-1,000 years at every location.
  2. The current sea ice extent is higher at all of the locations than over 50% to 85% of the Holocene.

While this doesn’t tell us what the sea ice extent was in million km2, it does tell us that the modern sea ice extent is larger than it was over most of the Holocene Epoch. It also tells us that the areas of currently seasonal sea ice extent have been seasonal or reduced over most of the past 5,000 years and ice-free or nearly ice-free over the prior 3,000 years or so. Here’s is the Kinnard graph plotted at the same horizontal scale as the Stein cross section:

A Geological Perspective of Polar Bears

by D. Middelton, Oct 11, 2020 in WUWT


Estimates have ranged from 70,000 to 5,000,000 years ago. The oldest confirmed polar bear fossil dates to 110,000 to 130,000 years ago… Meaning that polar bears survived the Eemian interglacial stage.

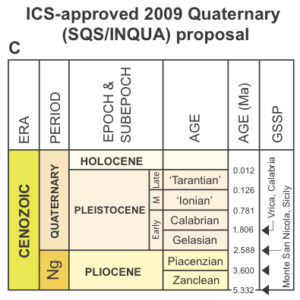
The peak warmth of the Eemian interglacial stage marks the boundary between the Late Pleistocene Tarantian Age and the Middle Pleistocene Ionian Age.

Que nous apprend l’Optimum Climatique Romain?

by A. Préat, 4 septembre 2020 in ScienceClimatEnergie


1/ Introduction

SCE a plusieurs fois rapporté que la période actuelle de réchauffement n’est pas exceptionnelle, qu’elle fait partie de cycles décennaux à pluriséculaires de refroidissement et réchauffement qui ont lieu dans des fourchettes de température fort modestes, de l’ordre de 0,15°C par 10 ans. SCE a aussi montré que le CO2 tant incriminé dans ces changements, et surtout l’actuel, n’avait pas de raison d’être, ce gaz venant après l’augmentation de température. Le ‘bouton CO2 ‘ à même d’expliquer ou de ‘justifier’ le battage médiatique quasi-quotidien est donc à ‘la remorque’ de la température et, l’hypothèse de l’effet de serre reste avant tout une hypothèse (exemple ici).

Mercury Deposition, Climate Change and Anthropogenic Activities: A Review

by Li, F. et al. July 31, 2020 in Front. Earth.Sci.


As a toxic and harmful global pollutant, mercury enters the environment through natural sources, and human activities. Based on large numbers of previous studies, this paper summarized the characteristics of mercury deposition and the impacts of climate change and human activities on mercury deposition from a global perspective. The results indicated that global mercury deposition changed synchronously, with more accumulation during the glacial period and less accumulation during the interglacial period. Mercury deposition fluctuated greatly during the Early Holocene but was stable and low during the Mid-Holocene. During the Late Holocene, mercury deposition reached the highest value. An increase in precipitation promotes a rise in forest litterfall Hg deposition. Nevertheless, there is a paucity of research on the mechanisms of mercury deposition affected by long-term humidity changes. Mercury accumulation was relatively low before the Industrial Revolution ca. 1840, while after industrialization, intensive industrial activities produced large amounts of anthropogenic mercury emissions and the accumulation increased rapidly. Since the 1970s, the center of global mercury production has gradually shifted from Europe and North America to Asia. On the scale of hundreds of thousands of years, mercury accumulation was greater in cold periods and less in warm periods, reflecting exogenous dust inputs. On millennial timescales, the correspondence between mercury deposition and temperature is less significant, as the former is more closely related to volcanic eruption and human activities. However, there remains significant uncertainties such as non-uniform distribution of research sites, lack of mercury deposition reconstruction with a long timescale and sub-century resolution, and the unclear relationship between precipitation change and mercury accumulation.

Extensive hake (fish) skeletal remains in ocean waters too cold for this species to occupy today suggest past ocean temperatures were several degrees warmer.

by Wheeland & Morgan, July 2020 in NoTricksZone


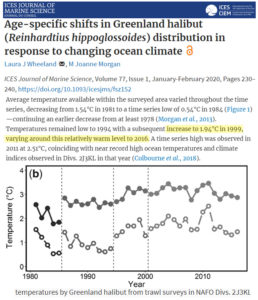
Fish habitats are limited by specific temperature boundaries. In a new study, for example,  Wheeland  and Morgan (2020) found there was a pronounced ocean warming from the 1980s to late 1990s off the coasts of Greenland. This temperature shift changed the distribution of halibut habitat. Since then, however, there has been no net warming in the study region (through 2016).

New Study: Arctic Waters Were 4°C Warmer Than Today And Nearly Sea-Ice Free Year-Round ~4100 Years Ago

by Brice et al., May 28, 2020 in NoTricksZone


Today, the region north of Svalbard is encrusted with sea ice for all but a few weeks per year and summer sea surface temperatures (SSTs) hover near 0°C.  Scientists (Brice et al., 2020) have determined this same region had sea ice-free conditions last about 10 months per year while SSTs reached 4°C just ~4100 years ago.

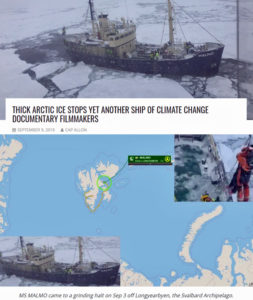
In early September, 2019, Arctic explorers once again needed to be rescued from the “disappearing” sea ice that had captured their ship in central Svalbard. This region is presently free of sea ice for only a few weeks per year (late August).

Image Source: electroverse.net

Study: Ancient ocean oxygen levels associated with changing atmospheric carbon dioxide


by Texas A&M University, May 24, 2020 in WUWT


A Texas A&M-led study analyzed ocean floor sediment cores to provide new insights into the relationship between deep ocean oxygenation and atmospheric carbon dioxide levels in the 50,000 years before the last ice age

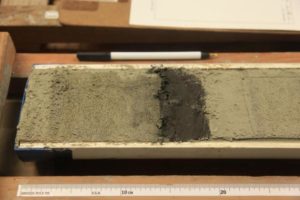
IMAGE: Deep ocean floor sediment cores hold chemical clues to Earth’s past. view more  Credit: Texas A&M University

Why do carbon dioxide levels in the atmosphere wax and wane in conjunction with the warm and cold periods of Earth’s past? Scientists have been trying to answer this question for many years, and thanks to chemical clues left in sediment cores extracted from deep in the ocean floor, they are starting to put together the pieces of that puzzle.

Recent research suggests that there was enhanced storage of respired carbon in the deep ocean when levels of atmospheric carbon dioxide concentrations were lower than today’s levels. But new research led by a Texas A&M University scientist has reached back even further, for the first time revealing insights into atmospheric carbon dioxide levels in the 50,000 years before the last ice age.

New Study: Greenland Was ‘4–5 °C Warmer Than Today’ ~9000 Years Ago…When The Arctic Was Nearly Sea-Ice Free

by Syring et al., February 6, 2020 in NoTricksZone


Scientists (Syring et al., 2020) find almost sea ice-free conditions pervaded a much warmer northern Greenland region during the Early Holocene.  Arctic sea ice extent has “continuously” grown for ~4800 years, with modern conditions a bit lower than the peak of the last few centuries.


In a new paper (Syring et al., 2020), scientists rely on biomarker evidence – (a) the presence of warmth-demanding species Armeria scabra and Mytilus edulis, and (b) IP25, a proxy for the presence or absence of sea ice – to suggest not only were there much warmer (4 to 5°C) northern Greenland temperatures 10,000 to 8500 years ago, but effectively sea ice-free conditions pervaded the region during this time.

The sea ice in the region has been growing “continuously” for the last 4800 years, reaching its peak during the last millennium.

The authors also find decadal- and centennial-scale periodicities in solar activity have coincided with variability in Arctic sea ice (IP25) throughout the Holocene.

19 Papers Published In 2019 Affirm Sea Levels Were METERS Higher Than Today 4-8 Thousand Years Ago

by K. Richard, January 16, 2020 in NoTricksZone


The onslaught of paleoclimate evidence for warmer-than-now Mid-Holocene climates – when the Earth’s sea levels were meters higher than they are today –  stormed through 2019.

There were 107 scientific papers published this past year indicating today’s warmth isn’t even close to being unusual or unprecedented when compared to the climates of the last centuries to millennia.

As illustrated below, there were also 19 papers affirming today’s sea levels are among the lowest of the last ~8000 years.

This is added to the list of nearly 100 scientific papers published in the last handful of years indicating Mid-Holocene sea levels were multiple meters higher than they are today due to the much more extensive glacier and ice sheet melt occuring during these millennia.

YOUNGER DRYAS — REWIND AND REPEAT

by Poppaloff, January 10, 2020 in Electroverse


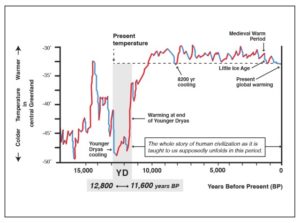
If the historical data is anything to go by, magnetic reversals/excursions often lead to large-level extinction events. Mounting evidence also suggests that our sun micro-novas every 12,000 years, or thereabouts, and that these two events are linked. Earth’s temperature has been on a downward trend since the sharp-warming that followed the end of the Younger Dryas, indicating that this coming Grand Solar Minimum could steer us back into a major glaciation period, and another extinction event.

In their 2014 paper, a group of scientists which included UC Santa Barbara’s James Kennett, posited that a comet collision with Earth played a major role in the extinction. Their hypothesis suggests that a cosmic-impact-event caused the Younger Dryas period of global cooling close to 12,800 years ago. This cosmic impact resulted in abrupt environmental stress and degradation that contributed to the extinction of most large animal species then inhabiting the Americas. According to Kennett, the catastrophic impact and the subsequent climate change also led to the disappearance of the prehistoric Clovis culture, known for its big game hunting, and to human population decline.


Early Holocene Temperature Oscillations Exceed Amplitude of Observed and Projected Warming in Svalbard Lakes

by Van der Bilt et al. , December 3, 2019 in GeophysResLetters


Abstract

Arctic climate is uniquely sensitive to ongoing warming. The feedbacks that drive this amplified response remain insufficiently quantified and misrepresented in model scenarios of future warming. Comparison with paleotemperature reconstructions from past warm intervals can help close this gap. The Early Holocene (11.7–8.2 ka BP) is an important target because Arctic temperatures were warmer than today. This study presents centennially resolved summer temperature reconstructions from three Svalbard lakes. We show that Early Holocene temperatures fluctuated between the coldest and warmest extremes of the past 12 ka, exceeding the range of instrumental observations and future projections. Peak warmth occurred ~10 ka BP, with temperatures 7 °C warmer than today due to high radiative forcing and intensified inflow of warm Atlantic waters. Between 9.5 and 8 ka BP, temperatures dropped in response to freshwater fluxes from melting ice. Facing similar mechanisms, our findings may provide insight into the near‐future response of Arctic climate.

8000 Years Of Zero Correlation Between CO2 And Temperature, GISP 2 Ice Core Shows – Opposite Is True!

by P. Gosselin, December 20, 2019 in NoTricksZone


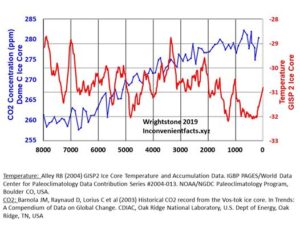
A plot of ice core data from Greenland reveals that CO2 does not drive temperatures.

At Facebook, Gregory Wrightstone posted a chart plotting atmospheric CO2 concentration reconstructed from  Dome C Ice Core versus temperature that was reconstructed from the GISP 2 Ice Core.

According to global warming scientists, there’s supposed to be tandem movement between the two magnitudes.

CO2, they say, drives global temperature.

But over the past 8000 years, the data show that temperature in reality has moved in the opposite direction of CO2 and thus of what climate alarmist scientists have told us.


If anything can be drawn from the plotted data, it is that there’s an inverse correlation: As CO2 rises, temperature drops. But of course there’s a lot more to it. CO2 is not that huge major climate driver that alarmists like having us believe it is.

3000-Year-Old Trees Excavated Under Icelandic Glacier

by P. Homewood, December 12, 2019 in NotaLotofPeopleKnowThat


Ancient tree stumps found under Breiðamerkurjökull glacier in Southeast Iceland are confirmed to be roughly 3,000 years old. RÚV reports.

A specialist believes the remarkably well-preserved stumps were part of a massive forest that disappeared after a long period of a warm climate.

One of the tree stumps was found in Breiðamerkursandur a couple of months ago, and once it was being salvaged a second, larger one was found. The smaller one was sent for examination while the larger will be examined at a later time.

Examinations revealed that the tree stump died very quickly at 89-years-old in the month of June. Nearby sediments and data suggest that the glacier itself was the culprit.

The tree stumps are from a period when Iceland was covered in forests. Even though 9th century Norse settlers reported vast forests across the country, it is believed that 3,000 years ago, the forests were much larger, even reaching the highlands. Approximately 500 BC, the climate became colder and glaciers began to form, destroying parts of the forests.

The 3,000-year-old remains of the forest are very well preserved and will be researched thoroughly. “It is absolutely incredible just how well preserved this tree stump is, having been buried under a glacier and that it still looks so whole, as opposed to being all wrinkled up like many of the specimens we have found.” Once examinations conclude, the water will be extracted from the tree stump and it will be filled with wax instead, allowing it to be exhibited.

https://www.icelandreview.com/news/3000-year-old-trees-excavated-under-glacier/

Discovering ancient forests under receding glaciers is not confined to Iceland. Remains of trees dating back to the Middle Ages have been found under the Juneau and Exit Glaciers in Alaska, as well under glaciers in Patagonia.

Tree stumps have also turned up under Swiss glaciers, carbon dated to about 4000 years ago.

The simple reality is that glaciers worldwide expanded enormously during the Little Ice Age, arguably to their greatest extent since the Ice Age. Despite decades of retreat since the 19thC, they are still abnormally large by historical standards.

A Geological Perspective on Sea Level Rise Acceleration

by David Middleton, December 9, 2019 in WUWT


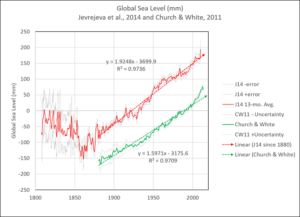
There have been at least three recent peer-reviewed papers asserting an anthropogenic acceleration in the rate of sea level rise (SLR): Church & White, 2006 (CW06), Church & White, 2011 (CW11) and Nerem et al., 2018 (N18). N18 only covers the satellite era (since 1993) and might actually be correct, albeit irrelevant. The primary culprits in the SLR acceleration scam are CW06 and CW11. Two other recent peer-reviewed papers clearly shoot down the notion of a recent anthropogenic acceleration: Jevrejeva et al., 2008 (J08) and Jevrejeva et al., 2014 (J14). This post will focus on CW11 (updated through 2013) and J14.

J08 and J14 indicate that the acceleration, to the extent there is one, started 150-200 years ago, consistent with the end of neoglaciation and that a quasi-periodic fluctuation (~60-yr cycle) is present. CW06 and CW11 also note the 19th Century acceleration; but also assert a more recent acceleration, presumably due to anthropogenic global warming. This SLR acceleration is, at worst, innocuous.

Figure 1. Jevrejeva et al., 2014 (red) and Church & White, 2011 (green).
….

Ancient Air Challenges Prominent Explanation For A Shift In Glacial Cycles

by E. W. Wolf, November 4, 2019 in WUWT


From Nature

An analysis of air up to 2 million years old, trapped in Antarctic ice, shows that a major shift in the periodicity of glacial cycles was probably not caused by a long-term decline in atmospheric levels of carbon dioxide.

Eric W. Wolff

During the past 2.6 million years, Earth’s climate has alternated between warm periods known as interglacials, when conditions were similar to those of today, and cold glacials, when ice sheets spread across North America and northern Europe. Before about 1 million years ago, the warm periods recurred every 40,000 years, but after that, the return period lengthened to an average of about 100,000 years. It has often been suggested that a decline in the atmospheric concentration of carbon dioxide was responsible for this fundamental change. Writing in Nature, Yan et al.1 report the first direct measurements of atmospheric CO2 concentrations from more than 1 million years ago. Their data show that, although CO2levels during glacials stayed well above the lows that occurred during the deep glacials of the past 800,000 years, the maximum CO2 concentrations during interglacials did not decline. The explanation for the change must therefore lie elsewhere.

Understanding what caused the shift in periodicity, known as the mid-Pleistocene transition (MPT), is one of the great challenges of palaeoclimate science. The 40,000-year periodicity that dominated until about 1 million years ago is easily explained, because the tilt of Earth’s spin axis relative to its orbit around the Sun varies between 22.1° and 24.5° with the same period. In other words, before the MPT, low tilts led to cooler summers that promoted the growth and preservation of ice sheets.

But after the MPT, glacial cycles lasted for two to three tilt cycles. Because the pattern of variation in Earth’s orbit and tilt remained unchanged, this implies that the energy needed to lose ice sheets2 had increased. One prominent explanation3 is that atmospheric levels of CO2 were declining, and eventually crossed a threshold value below which the net cooling effect of the decline allowed ice sheets to persist and grow larger.

Emmanuel Le Roy Ladurie A (re)lire absolument…

by Alain Préat,  3 octobre 2019 inScienceClimatEnergie


S’il est un livre, et un des premiers, à s’être penché de manière aussi détaillée sur l’évolution (récente) du climat, c’est celui d’Emmanuel Le Roy Ladurie ‘Histoire du climat depuis l’an mil’, publié en 1967.

Rappelons cependant le livre précurseur de Joseph-Jean-Nicolas Fuster publié en 1845 et récemment analysé ici même à SCE (et toujours disponible, voir ici).


1/ Introduction

A lire ou relire ce livre de 366 pages (Figure 1), on ne peut qu’être stupéfié par l’analyse rigoureuse qui met en évidence la variabilité naturelle du climat aux échelles pluriséculaire et décennale, qui décortique et privilégie  avec finesse le caractère local du climat par rapport à un climat global et fournit à partir d’indicateurs fiables des fourchettes de températures pour les variations climatiques observées à l’échelle pluriséculaire.

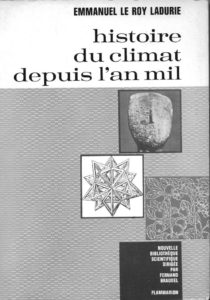
 Figure 1. Histoire du climat depuis l’an mil, Flammarion, publié en 1967

Avant d’aborder ce sujet en détail, il semble qu’aucun modèle sorti des ‘computers’ (GIEC) n’ait été jusqu’à présent capable de rendre compte des évolutions rapportées dans le livre d’ Emmanuel Le Roy Ladurie, ces modèles se prétendent ‘globaux’, contrairement à la conclusion du livre en question qui insiste particulièrement sur le caractère local des climats. Enfin il s’agit d’un livre de 366 pages bien illustré (photographies, cartes et graphiques) dans lequel il n’est pas mentionné une seule fois ‘le poison’ des temps modernes, à savoir le CO2. L’auteur, en 1967 (faut-il le rappeler …), propose ou explore quand  même des pistes pour rendre compte de la succession d’épisodes ‘froids’ et ‘chauds’, tout au long de ces 1000 années d’histoire, qui en fait  débutent il y a 3500 ans (mais pour ces temps historiques plus reculés, les données fiables sont moins nombreuses).


2/ Alors que dit Emmanuel Le Roy Ladurie ?

Anthropocene: “it will be the rocks that have the final say” about this fake word.

by David Middleton, August 7, 2019 in WUWT


The fake geologic epoch known as the “Anthropocene” just won’t die… It’s like a zombie from a bad science fiction movie.

Despite being populated with activists like Naomi Oreskes, it has taken the AWG ten years to vote on what their conclusion will be and to start looking for evidence to support their conclusion… And the vote wasn’t unanimous.

Here’s where the Anthropocene dies…


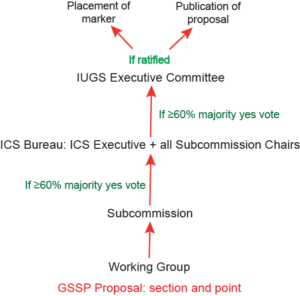
Figure 4 from Finney & Edwards.  “Workflow for approval and ratification of a Global Standard Stratotype Section and Point (GSSP) proposal. Extensive discussion and evaluation occurs at the level of the working group, subcommission, and International Commission on Stratigraphy (ICS) Bureau. If approved at these successive levels, a proposal is forwarded to the International Union of Geological Sciences (IUGS) for ratification. This process is also followed for other ICS decisions on standardization, such as approval of names of formal units, of revisions to the units, and to revision or replacement of GSSPs.”

For Most Of The Last 10,000 Years, Greenland Ice Sheet and Glacier Volume Was Smaller Than Today

by K. Richard, August 5, 2019 in NoTricksZone


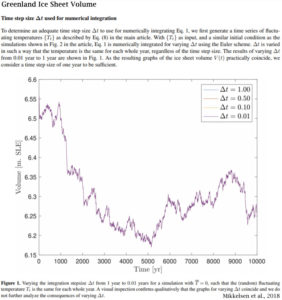
A new paper (Axford et al., 2019) reveals NW Greenland’s “outlet glaciers were smaller than today from ~9.4 to 0.2 ka BP” (9,400 to 200 years before 1950), and that “most of the land-based margin reached its maximum Holocene extent in the last millennium and likely the last few hundred years.”

The authors conclude:

“We infer based upon lake sediment organic and biogenic content that in response to declining temperatures, North Ice Cap reached its present-day size ~1850 AD, having been smaller than present through most of the preceding Holocene.”

Furthermore, the authors assert Greenland was 2.5°C to 3°C warmer than modern on average during the Holocene Thermal Maximum, and peak temperatures were 4°C to 7°C warmer.


Image Source: Mikkelson et al., 2018

1980s Science: Ice Cores Show CO2 Naturally Rose 200 ppm (65 ppm/100 Years) During The Early Holocene

by K. Richard, July 22, 2019 in NoTricksZone


A few decades ago it was “consensus” science that CO2 levels had reached 400 ppm (and even up to 500 ppm) during the Early Holocene, with rising amplitudes of greater than 200 ppm and rates of 65 ppm in less than a century. Then the “consensus” opinion changed.

In 1982 it was still quite acceptable for Dr. Flohn, a climate scientist, to acknowledge that changes in CO2 concentration changes are significantly determined by temperature “rather independent of” fossil fuel emissions, but also that Holocene CO2 concentrations reached 350 to 400 ppm between 8,000 to 6,000 years ago (Flohn, 1982).

Why the discrepancy between “consensus” CO2 and historically recorded CO2?

Polish physicist Dr. Zbigniew Jaworowski (1997) was a fierce critic of the means by which ice core data have been collected to assign CO2 concentration values to past epochs.

His criticisms center around the post-1985 tendencies for fellow scientists to openly employ selection bias in making pre-determined decisions about what measurements are “right” and which ones are “wrong” – effectively rendering their results meaningless.

He cites Pearlman et al. (1986), for example. These authors collected 74 Antarctic ice core CO2 samples. Of those, 32 (43%) were rejected because they had values that were too high or too low to match with the agreed-upon pre-determination.

In what other branch of science is it acceptable to discard measured data we don’t agree with?


Antarctica was warmer one thousand years ago — and life was OK

JoNova, July 11, 2019


Remember when polar amplification was the rage? So much for that theory

Antarctica is twice the size of the US or Australia. Buried 2 km deep under domes of snow, it holds 58 meters of global sea level to ransom. The IPCC have been predicting its demise-by-climate-change for a decade or two.

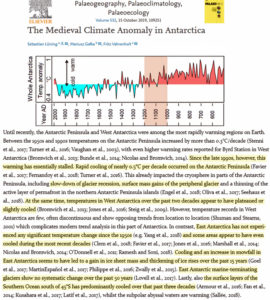
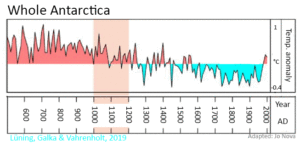
A new paper looks at 60 sites across Antarctica, considering everything from ice, lake and marine cores to peat and seal skins. They were particularly interested in the Medieval Warm Period, and researched back to 600AD.  During medieval times (1000-1200 AD) they estimate Antarctica as a whole was hotter than it is today.  Antarctica was even warmer still  — during the dark ages circa 700AD.

Credit to the paper authors: Sebastian Lüning, Mariusz Gałka, and Fritz Vahrenholt

Feast your eyes on the decidedly not unprecedented modern tiny spike:

The little jaggy down after 2000 AD is real. While there was rapid warming across Antarctica from 1950-2000, in the last twenty years, that warming has stalled. Just another 14 million square kilometers that the models didn’t predict.

We already knew the Medieval Warm Period was a global phenomenon, thanks to hundreds of proxies, and 6,000 boreholes. But this new paper is a great addition.

With an awesome dedication to detail, the team put all the big oceanic and other factors into one big graph. It is nice to see them side by side so we can see the connections between them.

Dry Hot North German Summers Were More Common 1000 Years Ago, Scientists Report

by P. Gosselin, June 19, 2019 in NoTricksZone


Dry Summers Like 2018 Were Common in the Middle Ages

Central Europe temperature constrained by speleothem fluid inclusion water isotopes over the past 14,000 years

by Affolter et al., June 5, 2019 in ScienceAdvance


Abstract

The reasons for the early Holocene temperature discrepancy between northern hemispheric model simulations and paleoclimate reconstructions—known as the Holocene temperature conundrum—remain unclear. Using hydrogen isotopes of fluid inclusion water extracted from stalagmites from the Milandre Cave in Switzerland, we established a mid-latitude European mean annual temperature reconstruction for the past 14,000 years. Our Milandre Cave fluid inclusion temperature record (MC-FIT) resembles Greenland and Mediterranean sea surface temperature trends but differs from recent reconstructions obtained from biogenic proxies and climate models. The water isotopes are further synchronized with tropical precipitation records, stressing the Northern Hemisphere signature. Our results support the existence of a European Holocene Thermal Maximum and data-model temperature discrepancies. Moreover, data-data comparison reveals a significant latitudinal temperature gradient within Europe. Last, the MC-FIT record suggests that seasonal biases in the proxies are not the primary cause of the Holocene temperature conundrum.