by Cap Allon, August 27, 2020 in Electroverse
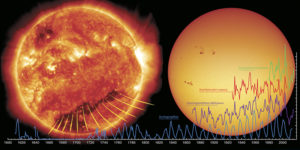
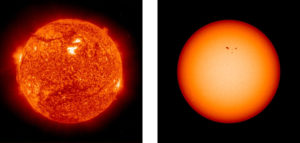
Solar Cycle 25 may be spluttering into life, but all is once-again quiet on the earth-facing solar disc: there are no sunspots — in fact, there haven’t been any for the past 6 days (as of Aug 27, 2020).
Solar activity is the driving force of Earth’s climate. This definition of obvious is only disputed by the misinformed, and by those with a financial or political motive.
High solar activity — as we’ve enjoyed for the past 100-or-so years — has delivered our planet a stable, predictable climate under-which we modern humans have had the opportunity to thrive and successfully advance our technological society.
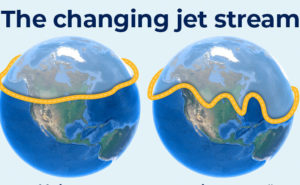
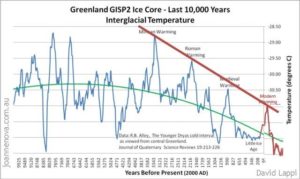
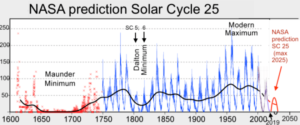
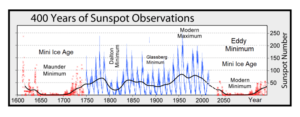
However, and as with all good things, these predictable days are ending: the Sun’s output is waning to levels not seen for the past 200 years, to a reduction in activity not experienced since the Dalton Minimum(1790-1830). And as with every great and advancing civilization of the past, a time comes when the consequences of a solar shutdown need to be contended. We need to prepare for the wild swings-between-extremes brought about by an increasingly weak & wavy (meridional) jet stream, we need to be aware of a powerful volcanic uptick witnessed during times of low solar activity, as well as cloud-nucleating Cosmic Rays, and, perhaps most crucially, an overall cooling of the planet.
Crops are always the first to go. And our modern delicately-balanced, chemical-dependent, monocropping-ways simply aren’t prepared for a violent shift in the climate — as Robert Felix has long been warning, “I fear that we will be fighting in the streets for food long before we’re covered by ice.”
…