by P. Homewood, September 5, 2018 in NotaLotofPeopleKnowThat
This article in something called Inside Climate News seems to be typical of many I have seen this year: Because we have had much attention in the media on heat waves this year, there must be an upward trend in heat waves and that is a warning signal that man-made global warming is destroying the planet. Typical of these articles are a couple of features
Declaration of a trend without any actual trend data, but just a single data point of events this year
Unstated implication that there must be a trend because the author can’t remember another year when heat wave stories were so prevalent in the media
Unproven link to man-made global warming, because I guess both involve warmth.
by P. Homewood, September 6, 2018 in NotaLotofPeopleKnowThat
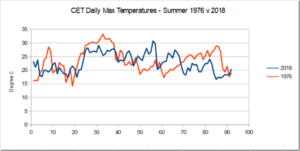
A lot of people have said they remember the summer of 1976 being hotter than this year. And they would be right.
According to CET data, at their peak temperatures went much higher and for longer than they did this summer. The only factor that kept the two summer remotely close was that in 1976 temperatures fell away during the middle of July to below average for a while.
The results of their analysis revealed that warming in this high Arctic site had proceeded at four times the global mean rate calculated in other data sets. However, Ding et al. note that over the last decade (2005-2014), “the warming rate in Ny-Ålesund slowed to 0.03 ± 1.85°C per decade,” which is essentially indicative of no-trend in the data. Lead-lag analysis further revealed that “Ny-Ålesund and global temperature variations were remarkably consistent, with a lag time of 8-9 years.” Consequently, the researchers say that “the ‘warming hiatus’ many scientists [have] studied also appears in Ny-Ålesund, it just started later than [that observed in] other areas.”
by P. Homewood, September 2, 2018 in NotaLotofPeopleKnowThat
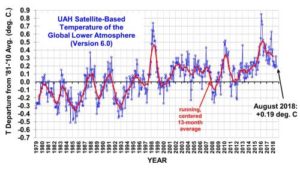
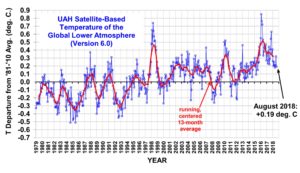
Global temperatures fell back to 0.19C in August. This means the YTD average is 0.23C, putting them back to roughly where they were in 2002.
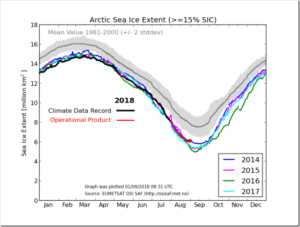
Arctic sea ice is tracking close to 2014, which finished with one of the highest minimums in the last decade. Current extent is well above the last three years.
by Paul Homewood, September 1, 208 in NotaLotofPeopleKnowThat
With one day to go, it is clear that 2018 has been one of the hottest summers on record for the UK, however, the margin between the mean temperatures at the top of the league tables (records dating back to 1910) is so small that at this point it is impossible to say if 2018 will be an outright winner. It is very close to the record-breaking summers of 2006 (15.78C), 2003 (15.77C), and 1976 (15.77C) all of which are within 0.01C of each other.
The margin is so small that different datasets and different regions of the UK will have different ranking. Usually we will only quote statistics to the nearest 0.1C as differences smaller than this could result from small numerical differences arising from the statistical calculations. A more comprehensive analysis of the 2018 summer data will be undertaken early next week and data for summer 2018 will continue to be analysed over the coming months.
Earth’s surface has undergone unprecedented warming over the last century, and especially in this century.
Every single year since 1977 has been warmer than the 20th century average, with 16 of the 17 warmest years on record occurring since 2001, and 2016 being the warmest year on recorded history. A study from 2016 found that without the emissions from burning coal and oil, there is very little likelihood that 13 out of the 15 warmest years on record would all have happened.
The Sun as climate driver is repeatedly discussed in the literature but proofs are often weak. In order to elucidate the solar influence, we have used a large number of temperature proxies worldwide to construct a global temperature mean G7 over the last 2000 years. The Fourier spectrum of G7 shows the strongest components as ~1000-, ~460-, and ~190 – year periods whereas other cycles of the individual proxies are considerably weaker. The G7 temperature extrema coincide with the Roman, medieval, and present optima as well as the well-known minimum of AD 1450 during the Little Ice Age. We have constructed by reverse Fourier transform a representation of G7 using only these three sine functions, which shows a remarkable Pearson correlation of 0.84 with the 31-year running average of G7. The three cycles are also found dominant in the production rates of the solar-induced cosmogenic nuclides 14C and 10Be, most strongly in the ~190 – year period being known as the De Vries/Suess cycle. By wavelet analysis, a new proof has been provided that at least the ~190-year climate cycle has a solar origin.
Comments to the July 2018 global surface air temperature overview Temperature quality class 1: Lower troposphere temperature from satellites Temperature quality class 2: HadCRUT global surface air temperature Temperature quality class 3: GISS and NCDC global surface air temperature Comparing global surface air temperature and satellite-based temperatures Global air temperature linear trends
Global temperatures: All in one, Quality Class 1, 2 and 3
Global sea surface temperature
Ocean temperature in uppermost 100 m
North Atlantic heat content uppermost 700 m
North Atlantic temperatures 0-800 m depth along 59N, 30-0W
Global ocean temperature 0-1900 m depth summary
Global ocean net temperature change since 2004 at different depths
La Niña and El Niño episodes
Troposphere and stratosphere temperatures from satellites
Zonal lower troposphere temperatures from satellites
Arctic and Antarctic lower troposphere temperatures from satellites Temperature over land versus over oceans
Arctic and Antarctic surface air temperatures
Arctic and Antarctic sea ice
Sea level in general
Global sea level from satellite altimetry
Global sea level from tide gauges
Northern Hemisphere weekly and seasonal snow cover
Atmospheric specific humidity
Atmospheric CO2
The phase relation between atmospheric CO2 and global temperature
Global air temperature and atmospheric CO2
Latest 20-year QC1 global monthly air temperature change
Sunspot activity and QC1 average satellite global air temperature
Climate and history: 1728: Vitus Bering and the non-discovery of Bering Strait
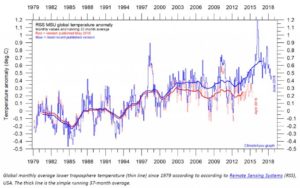
Temperatures can be measured from the ground and from satellites. Satellite data have two versions, UAH and RSS. The version of UAH (University of Alabama, Huntsville) makes a solid impression. The RSS version shows larger deviations and suggests a stronger warming.
How come?
Doping the data
Both datasets surely get their data from similar satellites. The explanation lies in a “post-processing” of the measured values by the RSS group. In the chart below you can see the old version in red.
Global temperature based on RSS satellite measurements. From Climate4You Newsletter June 2018.
There is frustration and reward when an article appears on the same topic of an article you are completing – in this case the Holocene. Such was the case this week with Andy May’s article “A Review of temperature reconstructions.” Andy points out the basic problems of reconstruction using proxy data for the most recent half of the Holocene – an issue central to historical climate and climate change studies. His paper did not alter my paper except as it reinforces some arguments.
This article examines the entire Holocene and illustrates the history that influenced the studies. There are two distinct parts to the studies, the pre and post Intergovernmental Panel on Climate Change (IPCC). The former is a genuine scientific struggle with issues of terminology and reconstruction, and the latter a scientific struggle to impose a political perspective regardless of the evidence. Because of the damage done to climatology by the proponents of anthropogenic global warming (AGW), both parts require explanation.
Somebody said economists try to predict the tide by measuring one wave. This puts them in the same league as climate scientists trying to predict the climate by measuring one variable, CO2. It is no surprise that an amalgam of the two, climate and economics, produces even worse results, but that is what happened early in the anthropogenic global warming (AGW) deception.
De tous temps les hommes se sont intéressés au climat et ont tenté de prévoir son évolution. Dès l’Antiquité il était connu que des caractéristiques géographiques comme la latitude mais aussi l’altitude ou le voisinage de vastes étendues d’eau avaient une grande influence sur le climat. Sur cette base les climatologues ont été amenés à distinguer différents types de climats tels que tropical, désertique, tempéré, polaire, etc. Ensuite, il est progressivement apparu que le climat est un système extrêmement complexe qui dépend de l’activité solaire ainsi que de la distance et de l’orientation de la Terre par rapport au Soleil, facteurs qui varient à des échelles de temps très différentes.
by P. Homewood, August 7, 2018 in NotaLotofPeopleKnowThat
Climate change: ‘Hothouse Earth’ risks even if CO2 emissions slashed
It may sound like the title of a low budget sci-fi movie, but for planetary scientists, “Hothouse Earth” is a deadly serious concept.
Researchers believe we could soon cross a threshold leading to boiling hot temperatures and towering seas in the centuries to come.
Even if countries succeed in meeting their CO2 targets, we could still lurch on to this “irreversible pathway”.
Their study shows it could happen if global temperatures rise by 2C.
…
The utterly corrupt body of climate science has been getting ever more desperate to scare people about climate change and thereby submit to their radical anti capitalist agenda.
People are not falling for it, so we are now being subjected to ever more absurd announcements like this.
During the 1930s, when the atmospheric CO2 concentration was about 100 ppm lower than today (310 ppm vs. 410 ppm), United States heat waves were just as if not more common than recent decades.
Recently there has been much ado about heat waves and the hottest-ever-recorded-temperatures making their rounds in Northern Hemisphere summer.
Yet scientists have determined that heat waves are largely driven by natural variability, not anthropogenic CO2 emissions.
But while Scripps is trying to tie the record-high ocean reading to the broader wave of media coverage on global heat waves, there are a few caveats to note about what the scientists found.
First, these measurements are taken from a pier that’s near the shoreline, which would not necessarily make it representative of the entire Pacific Ocean, and therefore easily influenced by local weather events.
The “anomalously warm temperatures for the past week” that Scripps researchers observed at their pier somewhat mirror the temperature pattern in 1931, and indeed, the daily records broken in the past week have been very close to readings from 87 years ago.
There is an upward trend in temperature readings from Scripps’ pier, but the trend seems to also broadly coincide with the flipping of a natural ocean cycle, the Pacific Decadal Oscillation, to its warm phase. That flip occurred around 1976.
by P. Homewood, August 1, 2018 in NotaLotofPeopleKnowThat
There have been just seven summers over 20c since 1910:
1911
1933
1947
1976
1995
2003
2006
While we don’t know how this summer will work out (and neither does Bob Ward), since 2006 we have had eleven distinctly average summers.
The hot summers above are still rare events, and are all essentially weather events. There is no evidence that these extreme weather events are becoming more frequent.
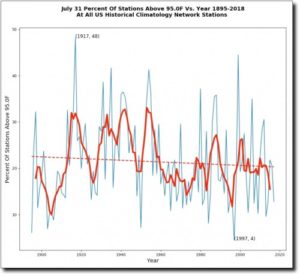
by Tony Heller, July 31, 2018 in ClimateChangeDispatch
July 31 afternoon temperatures have been declining in the US for a century, with the hottest year being 1917 when almost half of the US was over 95 degrees.
Climatologists trying to predict global warming forgot the sunshine in their sums. After correction of this startling error of physics, global warming will not be 2 to 4.5 K per CO2doubling, as climate models imagine. It will be a small, slow, harmless and net-beneficial 1.17 K.
by Tony Heller, July 30, 2018 in ClimateChangeDispatch
In 1999, NASA’s James Hansen was concerned that the very high-quality US temperature record didn’t match Hansen’s fake global warming trend.
How can the absence of clear climate change in the United States be reconciled with continued reports of record global temperature? Part of the “answer” is that U.S. climate has been following a different course than global climate, at least so far. Figure 1 compares the temperature history in the U.S. and the world for the past 120 years.
in the U.S. there has been little temperature change in the past 50 years, the time of rapidly increasing greenhouse gases — in fact, there was a slight cooling throughout much of the country …
by Cliff Mass, July 25, 2018 in CliffMassWeatherCimateBlog
There appears to be a problem with the temperature sensor at Seattle-Tacoma Airport: it seems to be running several degrees too warm.
This is not the first time this has happened. And excessively warm temperatures at airport stations seems to be a growth industry around here. In a previous blog I talked about the problem at Yakima–which has been fixed. Ellensburg is running too warm as well.
But this blog will be about Seattle-Tacoma Airport, whose official NWS/FAA temperature sensor is located between two of the runways.
Encore dans toutes les mémoires, la canicule de 2003 et ses 15 000 morts n’a pas été la plus meurtrière de la France du XXe siècle.
Il faudra marquer cette année 1911 d’une croix noire. » Voilà ce qu’écrivait, à la fin de l’été, un médecin du département de la Seine inférieure. À l’évidence traumatisé par les conséquences de la terrible vague de chaleur qui frappa alors, de juillet à septembre, toute l’Europe mais surtout la France et la Belgique. « Pendant la longue période de chaleur, la mort n’a cessé de faucher les tout-petits élevés au biberon », ajoutera ce médecin.
Une canicule de juillet à septembre
Encore dans toutes les mémoires, la canicule de 2003 et ses 15 000 morts n’a pas été la plus meurtrière en France. C’est ce que rappelait Catherine Rollet dans un article (1) paru en 2010. Cette historienne et démographe, décédée en décembre 2016, y racontait la dramatique canicule de l’été 1911.
…
La géologie, une science plus que passionnante … et diverse