When analyzing complex systems with multiple interacting variables it is useful to note the advice of Enrico Fermi who reportedly said “never make something more accurate than absolutely necessary”.
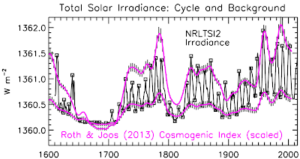
My recent paper presented a simple heuristic approach to climate science which plausibly proposed that a Millennial Turning Point (MTP) and peak in solar activity was reached in 1991.
Zharkova et al 2015 DOI:10.10381/srep15683 says ” Dynamo waves are found generated with close frequencies whose interaction leads to beating effects responsible for the grand cycles (350-400 years) superimposed on a standard 22 year cycle. This approach opens a new era in investigation and confident prediction of solar activity on a millenium timescale. ”
Svalgaard concluded in his essay on WUWT 10/27 2018:
The temperature increase since about 1650 is clearly chiefly due to the up- leg in the natural solar activity millennial cycle as shown by Lean 2018 “Estimating Solar Irradiance Since 850 AD” Fig 5
A recent paper Trajectories of the Earth System in the Anthropocene (Ref. [1] below) claims that even if the CO2 emission reductions called for in the Paris Agreement are met, our Earth may still enter what they call “Hothouse Earth” conditions, a long-term stabilization at temperature 4-5 °C-higher than pre-industrial temperatures, and sea-level 10-60 m-higher than today. They conclude calling for an accelerated transition towards a CO2 emission-free-world-economy. There is, however, very little evidence that the apocalyptic prediction is scientific grounded. Where really measured, the temperatures haven’t increased dramatically, and similarly, the sea-levels haven’t risen dramatically. More importantly, any acceleration of the temperature warming, or any acceleration of the rate of rise of the sea-level, are hard to detect.
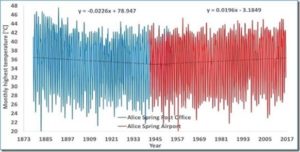
Figure 1 –sample long-term-trend thermometer results (Alice Spring, NT, Australia). The temperatures were recorded in the Post Office / City and Airport locations. Data downloaded from www.bom.gov.au/climate/data/.
The IPCC appears to have secretly changed the definition of what constitutes ‘climate’ by mixing existing and non-existing data
The definition of ‘climate’ adopted by the World Meteorological Organisation is the average of a particular weather parameter over 30 years. It was introduced at the 1934 Wiesbaden conference of the International Meteorological Organisation (WMO’s precursor) because data sets were only held to be reliable after 1900, so 1901 – 1930 was used as an initial basis for assessing climate. It has a certain arbitrariness, it could have been 25 years.
For its recent 1.5°C report the IPCC has changed the definition of climate to what has been loosely called “the climate we are in.” It still uses 30 years for its estimate of global warming and hence climate – but now it is the 30 years centred on the present.
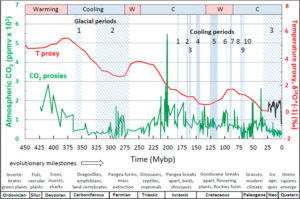
Davis, W.J. 2017. The relationship between atmospheric carbon dioxide concentration and global temperature for the last 425 million years. Climate5: 76; doi: 10.3390/cli5040076.
Writing by way of introduction to his work, Davis (2017) notes that “a central question for contemporary climate policy is how much of the observed global warming is attributable to the accumulation of atmospheric CO2 and other trace greenhouse gases emitted by human activities.” If you talk to a climate alarmist, the answer you receive from such an inquiry will likely be “almost all.” A climate skeptic, on the other hand, will likely respond that the answer is “likely none.”
Hoping to provide some crucial information on this topic, Davis analyzed the relationship between historic temperature and atmospheric CO2 using the most comprehensive assemblage of empirical databases of these two variables available for the Phanerozoic period (522 to 0 million years before present; Mybp). In all, 6680 proxy temperature and 831 proxy CO2 measurements were utilized, enabling what Davis described as “the most accurate quantitative empirical evaluation to date of the relationship between atmospheric CO2concentration and temperature.” Multiple statistical procedures and analyses were applied to the proxy records and the resultant relationship is depicted in the figure below.
The PAGES (2017) North American network consists entirely of tree rings. Climate Audit readers will recall the unique role of North American stripbark bristlecone chronologies in Mann et al 1998 and Mann et al 2008 (and in the majority of IPCC multiproxy reconstructions). In today’s post, I’ll parse the PAGES2K North American tree ring networks in both PAGES (2013) and PAGES (2017) from two aspects:
…
Conclusions
ex post screening based on recent proxy trends necessarily biases the resulting data towards a Hockey Stick shape – a criticism made over and over here and at other “ske;ptic” blogs, but not understood by Michael (“I am not a statistician”) Mann and the IPCC paleoclimate “community”;
the PAGES 2017 North American tree ring network has been severely screened ex post from a much larger candidate population: over the years, approximately 983 different North American tree ring chronologies have been used in MBH98, Mann et al 2008, PAGES 2013 or PAGES 2017. I.e. only ~15% of the underlying population was selected ex post – a procedure which, even with random data, would impart Hockey Stick-ness to any resulting composite
despite this severe ex post screening (in both PAGES 2013 and PAGES 2017), the composite of all data other than stripbark bristlecones had no noticeable Hockey Stick-ness and does not resemble a temperature proxy.
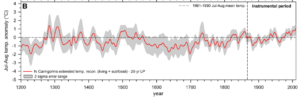
The climate of the pre-industrial past is of greatest importance to the ongoing climate discussion. Current climate can only be understood when interpreting it in the paleoclimatological context of the past few thousand years. Until not too long ago it was thought that the pre-industrial climate was monotonous and constant. This idea was e.g. promoted by Mann et al. whose famous hockey stick curve featured prominently in the IPCC report of 2001. Over the last 15 years, however, a large number of studies changed this view by providing robust evidence for the existence of significant natural climate variability. Of particular interest are the past 1000 years which commenced with the generally warm ‘Medieval Climate Anomaly’ (MCA, aka ‘Medieval Warm Period’, MWP), that eventually passed into the ‘Little Ice Age’ (LIA), before returning to the warm climate of the current ‘Modern Warm Period’ of the 20th and early 21st centuries.
There have been controversial debates about the existence of the MWP, …
The large-scale syntheses of global mean temperatures in IPCC fourth report suggested that the Northern Hemisphere temperature in the second half of the 20th century was likely the highest in at least the past 1,300 years and the 1990s was likely the warmest decade. However, this remains debated and the controversy is centered on whether temperatures during the recent half century were higher than those during the Medieval Climate Anomaly (MCA, AD 800–1300) and the Roman Warm Period (RWP, BC 200–AD 400), the most recent two natural warm periods of the late Holocene. Here the high resolution sea surface temperatures (SSTs) of two time windows around AD 990 (±40) and AD 50 (±40), which located in the MCA and RWP respectively, were reconstructed by the Sr/Ca ratio and δ18O of Tradacna gigas shells from the northern South China Sea. The results suggested that the mean SSTs around AD 990 (±40) and AD 50 (±40) were 28.1 °C and 28.7 °C, 0.8 °C and 1.4 °C higher than that during AD 1994–2005, respectively. These records, together with the tree ring, lake sediment and literature records from the eastern China and northwest China, imply that the temperatures in recent decades do not seem to exceed the natural changes in MCA, at least in eastern Asia from northwest China to northern SCS.
This post provides updates of the values for the three primary suppliers of global land+ocean surface temperature reconstructions—GISS through September 2018 and HADCRUT4 and NOAA NCEI (formerly NOAA NCDC) through August 2018—and of the two suppliers of satellite-based lower troposphere temperature composites (RSS and UAH) through September 2018. It also includes a few model-data comparisons.
This is simply an update, but it includes a good amount of background information for those new to the datasets. Because it is an update, there is no overview or summary for this post. There are, however, simple monthly summaries for the individual datasets. So for those familiar with the datasets, simply fast-forward to the graphs and read the summaries under the headings of “Update”.
A new paper documents “remarkably different” land temperatures from one instrumental data set to another. In some regions there is as much as an 0.8°C conflict in recorded temperature anomalies for CRU, NASA, BEST, and NOAA. The relative temperature trend differences can reach 90% when comparing instrumental records. Consequently, the uncertainty in instrumental temperature trends — “0.097–0.305°C per decade for recent decades (i.e., 1981–2017)” — is as large or larger than the alleged overall warming trend itself for this period.
Century-scale climate variability was enhanced when the Earth was warmer during the Last Interglacial period (129-116 thousand years ago) compared to the current interglacial (the last 11,700 years), according to a new UCL-led study.
The findings, published today in Nature Communications and funded by the Natural Environment Research Council (NERC) and the Australian Research Council (ARC), reveal that the Last Interglacial period was punctuated by a series of century-scale arid events in southern Europe and cold water-mass expansions in the North Atlantic.
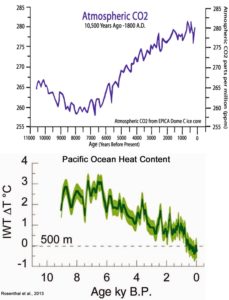
The significance of course is that the warming of the oceans began long before any impact from CO2 emissions.
HH Lamb has written extensively about how sea temperatures in the Atlantic fell radically during the LIA. Is the warming trend since then merely a return to earlier conditions?
by P. Homewood, October 10, 2018 in NotaLotofPeopleKnowThat
Contrary to recent press reports that the oceans hold the still-undetected global atmospheric warming predicted by climate models, ocean warming occurs in 100-year cycles, independent of both radiative and human influences.
At a press conference in Washington, D.C., on March 24, 2000, Dr. James Baker, Administrator of the U.S. National Oceanic and Atmospheric Administration (NOAA), announced that since the late 1940s, there “has been warming to a depth of nearly 10,000 feet in the Atlantic, Pacific, and Indian Oceans.” “In each ocean basin, substantial temperature changes are occurring at much deeper depths than we previously thought,” Dr. Baker said, as indicated by research conducted at NOAA’s Ocean Climate Laboratory. He was referring to a paper published in Science magazine that day, prepared by Sydney Levitus, John Antonov, Timothy Boyer, and Cathy Stephens, of the NOAA Center.
For 15 years, modellers have tried to explain their lack of success in predicting global warming. The climate models had predicted a global temperature increase of 1.5°C by the year 2000, six times more than that which has taken place. Not discouraged, the modellers argue that the heat generated by their claimed “greenhouse warming effect” is being stored in the deep oceans, and that it will eventually come back to haunt us. They’ve needed such a boost to prop up the man-induced greenhouse warming theory, but have had no observational evidence to support it. The Levitus, et al. article is now cited as the needed support.
How do today’s temperatures fit into the climate-historical context?
This is one of the main tasks of today’s climate research. A group of researchers led by Milos Rydval have presented a reconstruction of summer temperatures in Scotland over the past 800 years. The results were produced from tree ring examinations.
Surprisingly, the scientists found that the current level of heat in Scotland had been reached and even exceeded several times in the past. These heat spells occurred in the 14th, 16th, and 18th centuries and each spanned over several decades (Figure 1). In between there were cold phases that fit well into the context of the Little Ice Age.
What follows is the abstract of the study published in November 2017 in the journalClimate Dynamics:
95% of the model runs predicted more warming than the RSS data since 1988… And this is the Mears-ized RSS data, the one in which the measurements were influenced to obtain key information (erase the pause and more closely match the surface data).
Their “small discrepancy” would be abject failure in the oil & gas industry.
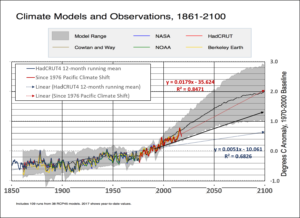
The observed warming has been less than that expected in a strong mitigation scenario (RCP4.5).
Output of 38 RCP4.5 models vs observations. The graph is originally from Carbon Brief. I updated it with HadCRUT4, shifted to 1970-2000 baseline, to demonstrate the post-El Niño divergence.
by Anne Dolhein, 2 october 2018 in Reinformation.TV
La NASA – peu suspecte de climato-scepticisme – s’appuie sur de nouveaux résultats d’observations de température aux confins de l’atmosphère terrestre pour annoncer un refroidissement notable dans ces zones, lié à l’un des minima solaires les plus importants de l’ère spatiale. Il s’agit très clairement d’un refroidissement climatique entraîné par la baisse de l’activité solaire, confirmant le rôle important sinon prépondérant du soleil sur les variations de température de la planète.
« Nous constatons une tendance au refroidissement », vient ainsi de déclarer Martin Mlynczak, chercheur principal associé du centre de recherches Langley de la NASA. « Très loin de la surface de la terre, près du bord de l’espace, notre atmosphère perd de l’énergie calorifique. Si les tendances actuelles se poursuivent, on pourrait bientôt atteindre un record de froid pour notre ère spatiale », a-t-il affirmé.
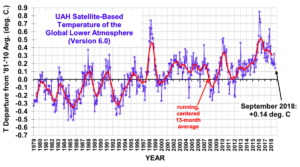
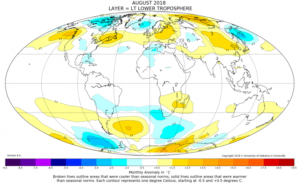
Globally, the coolest September in the last 10 years.
The Version 6.0 global average lower tropospheric temperature (LT) anomaly for September, 2018 was +0.14 deg. C, down a little from +0.19 deg. C in August:
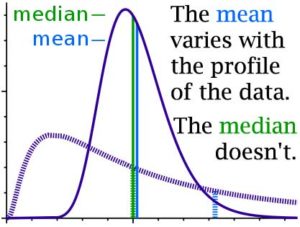
In the comment section of my most recent essay concerning GAST (Global Average Surface Temperature) anomalies (and why it is a method for Climate Science to trick itself) — it was brought up [again] that what Climate Science uses for the Daily Average temperature from any weather station is not, as we would have thought, the average of the temperatures recorded for the day (all recorded temperatures added to one another divided by the number of measurements) but are, instead, the Daily Maximum Temperature (Tmax) plus the Daily Low Temperature (Tmin) added and divided by two. It can be written out as (Tmax + Tmin)/2.
Anyone versed in the various forms of averages will recognize the latter is actually the median of Tmax and Tmin — the midpoint between the two …
It seems that every time we turn around, we are presented with a new Science Fact that such-and-so metric — Sea Level Rise, Global Average Surface Temperature, Ocean Heat Content, Polar Bear populations, Puffin populations — has changed dramatically — “It’s unprecedented!” — and these statements are often backed by a graph illustrating the sharp rise (or, in other cases, sharp fall) as the anomaly of the metric from some baseline. In most cases, the anomaly is actually very small and the change is magnified by cranking up the y-axis to make this very small change appear to be a steep rise (or fall).
doubling in a general circulation model results from a complex
system of parameterizations in combination with the underlying model structure. We refer to this as the model’smajor hypothesis, and we assume it to be testable. We explain four criteria that a valid test should meet: measurability, specificity, independence, and uniqueness. We argue that temperature change in the
tropical 200- to 300-hPa layer meets these criteria. Comparing modeled to observed trends over the past
60 years using a persistence-robust variance estimator shows that all models warm more rapidly than
observations and in the majority of individual cases the discrepancy is statistically significant. We argue that
this provides informative evidence against the major hypothesis in most current climate models.
One final gem from Davis’ work is a pronouncement that follows a discussion on the lack of correlation between CO2 and temperature across the historical record, where he aptly reminds us that “correlation does not imply causality, but the absence of correlation proves conclusively the absence of causality.” Consequently, there should be no more doubt regarding the ineffectiveness of atmospheric CO2 to control or drive climate change. It is simply nothing more than a bit player, whose influence has been continually overestimated by climate alarmists. The big question now is whether or not 500 million years of these data will convince them otherwise!
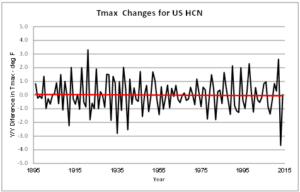
Given the impending global warming crisis declared by scientists, it should be easy to unambiguously demonstrate the crisis from the instrumental record. Unfortunately, when looking at the high temperature record for the US, it does not show any warming.
Figure 1 illustrates the incremental changes in surface air temperatures based on year to year differences in station average Tmax. The data is from all active stations in the US Historical Climatology Network (USHCN) from 1895 to 2014.
The classic heat equation defines changes in heat content as being proportional to changes in temperature (ΔQ = ƒ{ΔT} ).
Thus, Figure 1 amounts to a depiction of incremental changes in heat content, without scaling in energy units. The overall net temperature change is 0, which means the net change in heat content is also zero (ΔQ = ƒ{ΔT} = ƒ{0} = 0).
Figure 1 Year to Year Heat Changes (ΔT) for the USHCN
The question is how does the Intergovernmental Panel on Climate Change (IPCC) determine that an increase in atmospheric CO2 causes an increase in global temperature? The answer is they assumed it was the case and confirmed it by increasing CO2 levels in their computer climate models and the temperature went up. Science must overlook the fact that they wrote the computer code that told the computer to increase temperature with a CO2 increase. Science must ask if that sequence is confirmed by empirical evidence? Some scientists did that and found the empirical evidence showed it was not true. Why isn’t this central to all debate about anthropogenic global warming?
Even though CO2 concentrations hovered well below 300 ppm throughout most of the Holocene, newly published paleoclimate reconstructions affirm that today’s surface temperatures are only slightly warmer (if at all) than the coldest periods of the last 10,000 years. This contradicts the perspective that temperatures rise in concert with CO2 concentrations.