Archives par mot-clé : Temperature

High geothermal heat flux in close proximity to the Northeast Greenland Ice Stream

by Rysgaard et al., January 22, 2018 in NatureSci.Reports


The Greenland ice sheet (GIS) is losing mass at an increasing rate due to surface melt and flow acceleration in outlet glaciers. Currently, there is a large disagreement between observed and simulated ice flow, which may arise from inaccurate parameterization of basal motion, subglacial hydrology or geothermal heat sources. Recently it was suggested that there may be a hidden heat source beneath GIS caused by a higher than expected geothermal heat flux (GHF) from the Earth’s interior.

Un El Niño hors norme ne signifie pas la reprise du réchauffement mondial

by Uzbek, 24 janvier 2018 in ClimatEnv&Energie


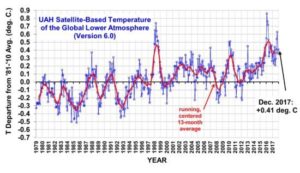
Dans un communiqué du 18 janvier 2018, l’OMM (Organisation météorologique mondiale) classe 2017 dans les trois années les plus chaudes depuis le début des mesures. Le record reste détenu par l’année 2016 (+ 1,2° C au-dessus des températures de la période pré industrielle) suivie par l’année 2015 (+ 1,1° C) toutes deux influencées par un épisode El Niño intense.

L’année 2017 serait ainsi l’année la plus chaude sans influence d’un phénomène El Niño. L’OMM suggère ainsi une reprise du réchauffement mondial après une pause des températures de plus de 17 ans.

(…)

Why 2017’s “Third Warmest Year on Record” is a Yawner

by E. Calvin Beisner, January 29, 2018 in WUWT


The National Oceanic and Atmospheric Administration’s (NOAA) press release headline January 18 was blunt: “NOAA: 2017 was 3rd warmest year on record for the globe.” The tagline that followed made the inference obligatory for all climate alarmists: “NOAA, NASA scientists confirm Earth’s long-term warming trend continues” (emphasis added).

The New York Times trumpeted, “2017 Was One of the Hottest Years on Record,” adding, “Scientists at NASA on Thursday ranked last year as the second-warmest year since reliable record-keeping began in 1880, trailing only 2016. The National Oceanic and Atmospheric Administration, which uses a different analytical method, ranked it third, behind 2016 and 2015.”

The UK Guardian likewise proclaimed, “2017 was the hottest year on record without an El Niño, thanks to global warming.”

Similar headlines appeared around the world. (…)

Greenland Is Getting Colder–New Study

by P Homewood, January 29, 2018 in NotaLotofPeopleKnowThat


Using satellite data, a group of scientists has studied the development of temperature over the past 15 years in a large part of Greenland.

More precisely, they looked at surface temperatures (the temperature close to the Earth’s surface) in a part of the country that is not covered by ice—around one fifth of the surface area of Greenland.

Intuitively, you may think that temperature throughout all of Greenland has been increasing, but that is not the case. When you look at the yearly average, the ice-free parts of Greenland show a slight drop in temperature between 2001 and 2015. With swings in temperature from year to year.

However, these results should not be interpreted as “proof” that the Earth is not warming, say the scientists behind the research, which is published in the journal Scientific Reports.

Global SST data confirms cooling is on the way

by P Homewood, January 27, 2018 in NotaLotofPeopleKnowThat


I see that reality is beginning to intrude upon the dangerous global warming team. They say ” it is plausible, if not likely, that the next 10 years of global temperature change will leave an impression of a ‘global warming hiatus’.”
Climate is controlled by natural cycles. Earth is just past the 2003+/- peak of a millennial cycle and the current cooling trend will likely continue until the next Little Ice Age minimum at about 2650.See the Energy and Environment paper at
http://journals.sagepub.com/doi/full/10.1177/0958305X16686488
and an earlier accessible blog version at http://climatesense-norpag.blogspot.com/2017/02/the-coming-cooling-usefully-accurate_17.html

Le climat et son histoire

by Emmanuel Le Roy Ladurie, 2012 in CairnInfo


Beaucoup de gens, à juste titre, sont impressionnés par les prédictions pessimistes du GIEC  relativement à la fin du xxie siècle, et il est fort possible que ces prédictions soient justifiées. La tâche de l’historien, c’est plutôt de resituer l’histoire du climat dans des périodes récentes ou moins récentes et de réfléchir, ensuite, en toute indépendance, en toute objectivité, sur ce qui nous attend, tant en fonction de ce qui s’est passé déjà, qu’en fonction des résultats impressionnants que nous proposent, avec raison sans doute, les sciences exactes.

TAO Sea and Air Temperature Differences

by Willis Eschenbach, January 24, 2018 in WUWT


(…) I like the TAO buoy data because we can be sure that it is free of urban heat islands, changes in location, instrumentation changes, and many of the other problems that plague land-based stations. It is also measured very frequently, typically every ten minutes. This lets us explore the daily cycles of air and sea temperature, solar radiation, longwave radiation, humidity, and the like.

Alarmist Retreat Begins: Natural Factors May Cause New Global Warming Hiatus

by Dr Benny Peiser, January 24, 2018 in ClimateChangeDispatch


The solar variability is not negligible in comparison with the energy imbalance that drives global temperature change.

Therefore, because of the combination of the strong 2016 El Niño and the phase of the solar cycle, it is plausible, if not likely, that the next 10 years of global temperature change will leave an impression of a ‘global warming hiatus.’ —James Hansen et al, 18 January 2018

The Global Warming Policy Foundation (GWPF) has lodged a new complaint with the BBC about its misleading reporting on global warming.

See also here

Worse than we thought’ – climate models underestimate future polar warming

by  FLORIDA MUSEUM OF NATURAL HISTORY,  January 23, 2018, in WUWT, A. Watts


The researchers published their findings this week in the Proceedings of the National Academy of Sciences.

Scientists frequently look to the Eocene to understand how the Earth responds to higher levels of carbon dioxide. During the Eocene, the concentration of carbon dioxide in the atmosphere was more than 560 parts per million, at least twice preindustrial levels, and the epoch kicked off with a global average temperature more than 8 degrees Celsius – about 14 degrees Fahrenheit – warmer than today, gradually cooling over the next 22 million years. These characteristics make the Eocene a good period on which to test our understanding of the climate system, said Laura Cotton, study co-author and curator of micropaleontology at the Florida Museum of Natural History.

Emergent constraint on equilibrium climate sensitivity from global temperature variability

by P.M. Cox et al., January 18, 2018 in Nature


Equilibrium climate sensitivity (ECS) remains one of the most important unknowns in climate change science. ECS is defined as the global mean warming that would occur if the atmospheric carbon dioxide (CO2) concentration were instantly doubled and the climate were then brought to equilibrium with that new level of CO2.

(…)

This metric of variability can also be calculated from observational records of global warming3, which enables tighter constraints to be placed on ECS, reducing the probability of ECS being less than 1.5 degrees Celsius to less than 3 per cent, and the probability of ECS exceeding 4.5 degrees Celsius to less than 1 per cent.

Rare Weather Station: Unchanged Over 138 Years, Data Show No CO2 Impact On Temperature!

by P Gosselin, January 19, 2018 in NoTricksZone


In Germany there is one weather station that has be intact and unchanged for some 138 years.

It has never been moved and never been corrupted by the urban heat island (UHI) effect. Moreover it has consistently used the same instrumentation and computation method over the entire period, thus making it rare indeed. Few station can boast having those instrumentation qualities.

That measurement station is one operated at the Klostergarten of the St. Stephan Abbey in Augsburg just northwest of Munich.

The Antarctic Centennial Oscillation: A Natural Paleoclimate Cycle in the Southern Hemisphere That Influences Global Temperature

by W.J. Davis et al., January 8, 2018 in Climate


We report a previously-unexplored natural temperature cycle recorded in ice cores from Antarctica—the Antarctic Centennial Oscillation (ACO)—that has oscillated for at least the last 226 millennia. Here we document the properties of the ACO and provide an initial assessment of its role in global climate.

See also here

New Study Identifies Thermometer for the Past Global Ocean

by UC San Diego, January 4, 2018


There is a new way to measure the average temperature of the ocean thanks to researchers at Scripps Institution of Oceanography at the University of California San Diego. In an article published in the Jan. 4, 2018, issue of the journal Nature, geoscientist Jeff Severinghaus and colleagues at Scripps Oceanography and institutions in Switzerland and Japan detailed their ground-breaking approach.

Study: Climate models underestimate cooling effect of daily cloud cycle

by Princeton University, January 10, 2018 in WUWT


Princeton University researchers have found that the climate models scientists use to project future conditions on our planet underestimate the cooling effect that clouds have on a daily — and even hourly — basis, particularly over land.

The researchers report in the journal Nature Communications Dec. 22 that models tend to factor in too much of the sun’s daily heat, which results in warmer, drier conditions than might actually occur. The researchers found that inaccuracies in accounting for the diurnal, or daily, cloud cycle did not seem to invalidate climate projections, but they did increase the margin of error for a crucial tool scientists use to understand how climate change will affect us.

GLOBAL TEMPERATURE IN 2017: NOT A RESURGENCE OF GLOBAL WARMING

by Dr David Whitehouse, January 17, 2018 in GWPF


It is clear that 2017 was a very warm year. Tomorrow, NOAA, NASA and the UK Met Office will announce by how much. It won’t be a record-breaker, but it will be in the top five, and that has already started comments about why it has been so hot. After all, the record-setting El Niño temperatures of the 2015-16 are over – so why did it remain so hot? The reason, according to some, is clear: the resurgence of global warming. The year 2017 is the hottest non-El Niño year ever and therefore signifies a dramatic increase of global warming after 20-years or so when the global temperature hasn’t done very much.

See also here

Further proof El Ninos are fueled by deep-sea geological heat flow

by Janes E Kamis, January, 27 in CliateChangeDispatch


The 2014-2017 El Nino “warm blob” was likely created, maintained, and partially recharged on two separate occasions by massive pulses of super-heated and chemically charged seawater from deep-sea geological features in the western North Pacific Ocean. This strongly supports the theory all El Ninos are naturally occurring and geological in origin. Climate change / global warming had nothing to do with generating, rewarming, intensifying, or increasing the frequency of the 2014-2017 El Nino or any previous El Nino.

If proven correct, this would revolutionize climatology and key aspects of many interrelated sciences such as oceanography, marine biology, glaciology, biogeochemistry, and most importantly meteorology. Information supporting a geological origin of El Ninos is diverse, reliable, and can be placed into five general categories as follows: (…)

See also here

Extinction and global warming 250 million years ago

by U. of Bristol, January 10, 2018 in A Watts, WUWT


One of the key effects of the end-Permian mass extinction, 252 million years ago, was rapid heating of tropical waters and atmospheres.

How this affected life on land has been uncertain until now.

In a new study published today, Dr Massimo Bernardi and Professor Mike Benton from the School of Earth Sciences at the University of Bristol show how early reptiles were expelled from the tropics.

Evaluating biases in Sea Surface Temperature records using coastal weather stations

by C Kevin, January 8, 2018 in SkepticalScience


Science is hard. Some easy problems you can solve by hard work, if you are in the right place at the right time and have the right skills. Hard problems take the combined effort of multiple groups looking at the problem, publishing results and finding fault with eachother’s work, until hopefully no-one can find any more problems. When problems are hard, you may have to publish something that even you don’t think is right, but that might advance the discussion.

The calculation of an unbiased sea surface temperature record is a hard problem. Historical sea surface temperature observations come from a variety of sources, with early records being measured using wooden, canvas or rubber buckets (figure 1), later readings being taken from engine room intakes or hull sensors, and the most recent data coming from drifting buoys and from satellites.

See alos here