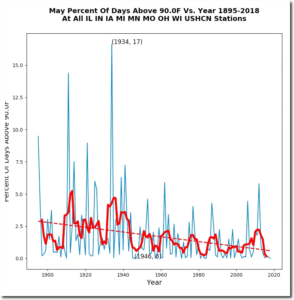
by Tony Heller, May 12, 2012 in TheDeplorableClimSciBlog
Ninety-five degree temperatures were common in the Midwest during May prior to 1940, but almost never happen any more. May afternoon temperatures have been declining in the Midwest since the 19th century. The hottest May (by far) was 1934, when 100 degree temperatures were widespread across the Midwest, including 101 degrees at Algona, Iowa on May 7th, 1934.
Why do U.S. climate forecasters pay so much attention to a pattern that operates in the remote tropical Pacific? Because the Pacific is the world’s biggest ocean, and disruptions to its climate have a long reach. The seesawing changes in tropical rainfall, winds, and ocean temperature that accompany La Niña and its warm-phase partner, El Niño, trigger a cascade of potentially predictable impacts on seasonal climate in the United States and beyond.
Scientists drilling deep into ancient rocks in the Arizona desert say they have documented a gradual shift in Earth’s orbit that repeats regularly every 405,000 years, playing a role in natural climate swings. Astrophysicists have long hypothesized that the cycle exists based on calculations of celestial mechanics, but the authors of the new research have found the first verifiable physical evidence. They showed that the cycle has been stable for hundreds of millions of years, from before the rise of dinosaurs, and is still active today. The research may have implications not only for climate studies, but our understanding of the evolution of life on Earth, and the evolution of the Solar System. It appears this week in the Proceedings of the National Academy of Sciences.
As global oil markets shift their attention from U.S. shale oil production back to a resurgent Saudi Arabia and Russia and geopolitical concerns bearing down on oil prices, Citigroup said last Wednesday that the U.S. is poised to surpass Saudi Arabia next year as the world’s largest exporter of crude and oil products.
The U.S. exported a record 8.3 million barrels per day (bpd) last week of crude oil and petroleum products, the government also said Wednesday. Top crude oil exporter Saudi Arabia’s, for its part, exported 9.3 million bpd in January, while Russia exported 7.4 million bpd, the bank added.
However, it should also be noted that the Citi projection is for both crude and finished (refined) petroleum products, not only crude oil. Saudi Arabia remains the world’s largest exporter of crude, though since January amid the OPEC/non-OPEC production cut agreement that figure has fallen. On April 10, the Saudi oil minister said that the kingdom planned to keep its crude oil shipments in May below 7 million bpd for the 12th consecutive month (…)
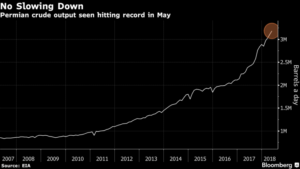
The Permian shale play is all about setting records. Now, the region may even become the world’s largest oil patch over the next decade.
Output in the basin is forecast to reach 3.18 million barrels a day in May, according to the Energy Information Administration. That’s the highest since the agency began compiling records in 2007. By 2023, the basin may produce 4 million barrels a day, according to the International Energy Agency. The Ghawar field in Saudi Arabia is currently the world’s biggest oil field, with capacity of 5.8 million barrels a day, according to a 2017 EIA report.
by Tony Heller, April 20, 2018 in TheDeplorableClimSciBlog
The first half of April was third coldest in the past 110 years in the US, and the coldest since 1975. The three warmest first fifteen days of April occurred in 1910, 1930 and 1925, when about 80% of days were over 60 degrees.
Global mean sea level (GMSL) has increased by about 8–9 inches since 1880, with about 3 inches occurring since 1993. As discussed in Part VI, scientists expect that GMSL will continue to rise well beyond the 21st century because of global warming that has already occurred and warming that is yet to occur.
The recent NOAA Report Global and Regional Sea Level Rise Scenarios for the United States has stated that even the relatively small increases in sea level over the last several decades have been associated greater storm impacts at many places along the U.S. coast. Further, the frequency of intermittent flooding associated with unusually high tides has increased rapidly in response to increases in local sea level, becoming a recurrent and disruptive problem.
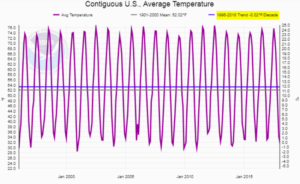
The chart above was produced by NOAA at their ‘Climate at a Glance’ web page. In the upper right corner of the chart, NOAA shows its calculated per decade trend of -0.02°F for a period that spans 1996-2018.
After posting this chart and an accompanying article, it just seemed that something was likely wrong with the trend calculation produced by NOAA’s web site.
Utica Midstream conference gives update on Utica Shale production and development.
NORTH CANTON Ohio has produced more natural gas than it uses since early 2015. Driven by prolific Utica Shale wells, the state produced a record 1.7 trillion cubic feet of natural gas last year.
Much of the regional economic development around that production has been in the form of pipelines and processing facilities.
Two interstate natural gas pipelines — Energy Transfer’s Rover project and the NEXUS Gas Transmission pipeline — cross Stark and neighboring counties.
by tonyheller, March 20, 2018 in TheDeplorableClimSciBlog
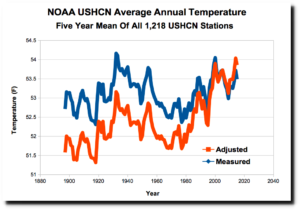
NOAA’s US temperature record shows that US was warmest in the 1930’s and has generally cooled as CO2 has increased. This wrecks greenhouse gas theory, so they “adjust” the data to make it look like the US is warming.
U.S. exported more natural gas in 2017 than it imported for the first time in 60 years, according to the Energy Department.
Natural gas production has boomed in recent years, particularly in Pennsylvania and other parts of Appalachia, thanks to hydraulic fracturing or fracking and horizontal drilling. The boom has offset Canadian imports and allowed U.S. companies to ship more fuel abroad.
Grâce à une production de pétrole en plein boom, les États-Unis exportent désormais sans complexe leur or noir dans le monde, entraînant une refonte des infrastructures sur leur territoire et rebattant les cartes sur le marché mondial. En pompant actuellement plus de 10 millions de barils par jour, le pays est devenu le deuxième producteur de brut au monde, derrière la Russie et devant l’Arabie saoudite. Un essor lié aux nouvelles techniques permettant d’extraire à moindre coût du pétrole de schiste
by P. Homewood, March 15, 2015 in NotaLotofPeopleKnowThat
According to the heavily adjusted NOAA data, last month was the fifth warmest February on record in the Central Lakes Division of NY State, with an average mean temperature of 31.4F.
Prior to 1981, the warmest was February 1954, which averaged 29.8F. In other words, NOAA claim that February 1954 was 1.6F colder than last month.
Which all looks very suspicious, because the opposite picture is shown at the high quality station of Ithaca Cornell University (…)
Scientists have revised an estimate of snow volume for the entire continent, and they’ve discovered that snow accumulation in a typical year is 50 percent higher than previously thought. Researchersplace the yearly estimate at about 1,200 cubic miles of snow. If spread evenly across the surface of the continent from Canada to Mexico, the snow would measure a little over 7.5 inches deep.
In the journal Geophysical Research Letters, researchers at The Ohio State University place the yearly estimate at about 1,200 cubic miles of snow accumulation. If spread evenly across the surface of the continent from Canada to Mexico, the snow would measure a little over 7.5 inches deep. If confined to Ohio, it would bury the state under 150 feet of snow.
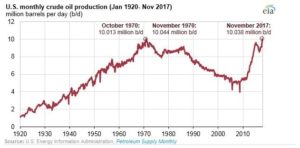
U.S. crude oil production reached 10.038 million barrels per day (b/d) in November 2017, according to EIA’s latest Petroleum Supply Monthly. November’s production is the first time since 1970 that monthly U.S. production levels surpassed 10 million b/d and the second-highest U.S. monthly oil production value ever, just below the November 1970 production value of 10.044 million b/d.
Within the Lower 48 states, November 2017 production reached a record high in Texas at 3.89 million b/d, followed by North Dakota at 1.18 million b/d. Production in the Federal Gulf of Mexico reached 1.67 million b/d, up 14% from the October 2017 level as the region recovered from Hurricane Nate.
The widespread adoption of fracking in the U.S. opened billions of barrels of oil and trillions of cubic feet of natural gas to production and transformed the global energy sector in a matter of a few years. Now, a leading global energy agency says U.S. natural gas is about to do it again.
The International Energy Agency (IEA) said in a new forecast this week that growth in U.S. oil production will cover 80% of new global demand for oil in the next three years. U.S. oil production is expected to increase nearly 30% to 17 million barrels a day by 2023 with much of that growth coming from oil produced through fracking in West Texas.
Well, I’m amazed and impressed. Tight oil production has pushed total United States petroleum output to more than 10 million barrels a day, a rate last seen almost a half-century ago. It’s a new U.S. record. Fifteen years ago I was traveling the world with a Powerpoint presentation featuring a graph of U.S. oil production history. That graph showed a clear peak in 1970 and a long bumpy decline thereafter. (…)
Continental United States (CONUS) hurricane-related inflation-adjusted damage has increased significantly since 1900. However, since 1900 neither observed CONUS landfalling hurricane frequency nor intensity show significant trends, including the devastating 2017 season.
Two large-scale climate modes that have been noted in prior research to significantly impact CONUS landfalling hurricane activity are El Niño-Southern Oscillation on interannual timescales and the Atlantic Multi-decadal Oscillation on multi-decadal timescales. La Niña seasons tend to be characterized by more CONUS hurricane landfalls than do El Niño seasons, and positive Atlantic Multi-decadal Oscillation phases tend to have more CONUS hurricane landfalls than do negative phases.
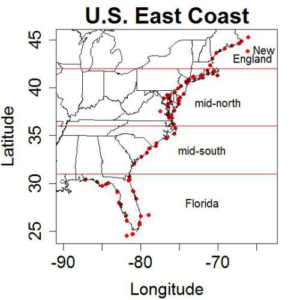
Earlier this month, the authors of a new paper (Partridge et al., 2018) published in Geophysical Research Letters promulgated the term “warming hole” to describe the cooling temperatures gripping most of the Eastern half of the United States from the late 1950s through 2015
by Eck, February 15, 2018 in K. Richard NoTricksZone
A new scientific study says surface temperatures in the Northeastern U.S. (Appalachian Mountains) have undergone a significant long-term cooling trend since the early 20th century, complicating the detection of a clear anthropogenic global warming (AGW) signal for the region.
According to Eck (2018), the two coldest Appalachian winters since 1910 were recorded in recent years (2009-’10 and 2010-’11), and 9 of the 10 warmest winters occurred prior to 1960.
In the early 1930s, Appalachian winters were 4.7°C warmer than they have been during the last 30 years (1987-2017).
by Julian Lee, February 11, 2018 in BloombergGadlfy
The latest surge in U.S. oil output will probably hasten the country’s rise to the top of the producer pile. More important, it’s starting to look as though at least half of OPEC’s nightmare scenario for 2018 — a surge in shale output and slowdown in demand growth — is coming true.
Last week’s avalanche of releases from the U.S. Department of Energy showed daily oil production above 10 million barrels a day for the first time since 1970.
La géologie, une science plus que passionnante … et diverse