THE UN ADMITS THAT THE PARIS CLIMATE DEAL WAS A FRAUD

by Poppallov, February 24, 2020 in Electroverse


In an editorial piece published in the Investor’s Business Daily Saturday 11th February 2017, we are told about a United Nations climate report that environmentalists undoubtedly don’t want anybody to read. It states in plain English “that even if every country abides by the grand promises they made last year in Paris to reduce greenhouse gases, the planet would still be doomed…”

When President Obama hitched America to the Paris accords in 2016, he declared that it was “the moment that we finally decided to save our planet.” And when Trump pulled out of the deal this year, he was berated by legions of environmentalists for killing it.

But it turns out that the Paris accord was little more than a sham that will do nothing to “save the planet.”

According to the latest annual UN report on the “emissions gap,” the Paris agreement will provide only a third of the cuts in greenhouse gas that environmentalists claim is needed to prevent catastrophic warming. If every country involved in those accords abides by their pledges between now and 2030 — which is a dubious proposition — temperatures will still rise by 3 degrees Celsius by 2100. The goal of the Paris agreement was to keep the global temperature increase to under 2 degrees.

The measures submitted included: “Boosting renewable energy’s share to 30%. Pushing electric cars to 15% of new car sales, up from less than 1% today. Doubling mass transit use. Cutting air travel CO2 emissions by 20%. And coming up with $1 trillion for “climate action.”

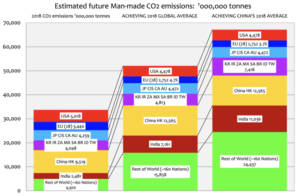
Central to the report, “phasing out coal consumption … is an indispensable condition for achieving international climate change targets.” That means halting all new coal plants shutting down those currently in use.

Which is quite a big ask, as there are currently 273 gigawatts of coal capacity under construction around the world, and another 570 gigawatts in the pipeline, according to the UN. That’s a 42% increase in global energy production from coal. Which doesn’t consider the 22 coal-fired power stations to be built at 17 locations in Japan to replace their aging nuclear plants. These new installations will on their own produce more carbon dioxide annually than all the passenger cars sold in the United States each year.

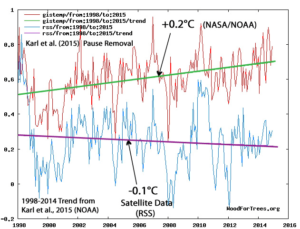
So, with all the hype in the media about “climate change” and with NOAA admitting to data manipulation, as well as acknowledging that the climate has been cooling for the past 10 years, when is the UN going to shut-up shop and call an end to this panhandling charade?

Melanie Phillips: The Real Western Civilisation Emergency

by Melanie Phillips, February 22, 2020 in GWPF


The “climate emergency”, which we are told threatens the imminent collapse of civilisation and the extinction of humanity, is a dogma being enforced by a culturally totalitarian tyranny. Threatening the living standards of millions, permitting no challenge and wrecking the livelihoods and reputations of any who dares dissent, it has been created by a repudiation of science, humanity and reason: the very markers of modernity and the west. This is the real emergency.

Unexpected ice

by N. Vizcarra, February 2020 in EarthData/NASA


Paul Holland, a climate modeler with the British Antarctic Survey, has spent the last ten years studying Antarctica’s sea ice and the Southern Ocean. Lately, he has been scrutinizing the seasons of Antarctica and how fast the ice comes and goes. Holland thinks these seasons may be a key to a conundrum: If Earth’s temperatures are getting warmer and sea ice in the Arctic has been shrinking fast, why then is sea ice in the Antarctic slowly increasing?

Spring surprise

Holland used data from NASA’s National Snow and Ice Data Center Distributed Active Archive Center (NSIDC DAAC) to calculate the ice concentration rate of growth for each single day, which he called intensification; and the total ice area rate of growth, which he called expansion. “I did that for all thirty years of data and plotted the trends,” he said. Holland’s plots showed that the different regions in the Southern Ocean contributed to the overall increase, but they had very diverse trends in sea ice growth. This suggested that geography and different wind patterns played a role. So to gain more insight Holland looked at seasonal wind trends for the different regions.

Holland found that winds were spreading sea ice out in some regions and compressing or keeping it intact in others and that these effects began in the spring. It contradicted a previous study in which, using ice drift data, Holland and Ron Kwok from the NASA’s Jet Propulsion Laboratory (JPL) found that increasing northward winds during the autumn caused the variations.

“I always thought, and as far as I can tell everyone else thought, that the biggest changes must be in autumn,” Holland said. “But the big result for me now is we need to look at spring. The trend is bigger in the autumn, but it seems to be created in spring.”

“Paul has created two more sea ice metrics that we can use to assess how Antarctic sea ice is responding,” said researcher Sharon Stammerjohn, referring to the measures of intensification and expansion. The new metrics help assess how the system is responding as opposed to simply monitoring the state of the system. “Say your temperature is at 99.2 degrees Fahrenheit,” Stammerjohn said. “You don’t have any insight to that temperature unless you take it again an hour later and you see that it changed to 101 degrees. Then you can say, okay, my system is responding to something.”

Expert: German Coal Exit Will Cost 80 Billion Euros, But “Changes Europe CO2 Emissions By 0”

by P. Gosselin, February 22, 2020 in NoTricksZone


The German government recently decided to exit from coal generated power by 2038, and now one expert says that the exit is going to cost handsomely, and bring zero result. Still, that 2038 target is too slow for some.

That’s how German politicians make decisions on things that concern the economy and environment. The German government’s aim of a coal phaseout is to contribute to protecting the climate. In reality, it will have no impact at all.

German online FOCUS magazine reports here: “80 billion euros are to be given to the affected regions and companies in the coming years as aid and compensation.”

But for some experts, the 2018 target date for completing the coal exit is too late, and thus risks seeing Germany emitting another 140 million tonnes of extra CO2 between 2020 and 2040 by exiting so slowly, so claims the German Institute for Economic Research (DIW).

To keep that 140 million ton figure in a global perspective, it is barely a drop in the bucket when compared to the 33 billion tonnes emitted globally and annually. The climate is not even going to notice it.


Continuer la lecture de Expert: German Coal Exit Will Cost 80 Billion Euros, But “Changes Europe CO2 Emissions By 0”

Quantifying Futility: an estimate of future Global CO2 emissions

by C. Rotter, February 21, 2020 in WUWT


Reposted from edmhdotme

Following the thinking of the late Prof David Mackay using “back of the envelope calculations”, this post makes estimates of the likely future growth in global CO2 emissions to put the efforts at CO2 emissions reduction in the Western World into the context of a probable and inevitable future for Global CO2 emissions.

Two scenarios are considered.  They set the range of outcomes:

  1. The Underdeveloped world and India presently at a level of ~1.9tonnes/head/annum attain the global average level of CO2 emissions/head/annum of 2018:  4.46tonnes/head/annum.  This results in Global CO2 emissions growing by 18.5Gigatonnes/annum to reach ~52Gigatonnes/annum.  This level is close to the current CO2 emissions/head/annum in France.
  2. The Underdeveloped world and India eventually attain the level of CO2 emissions/head current in China:  6.78tonnes/head/annum.  This level is also close to the average 2018 CO2 emissions/head/annum in the EU(28). This would result in Global CO2 emissions growing by ~33.5Gigatonnes/annum to reach ~67Gigatonnes/annum.

These values set a range of estimates and show how the inevitable CO2 emissions growth in the Developing World would swamp any savings made by Western nations in the name of controlling climate.  This point was amply made by Berkley Professor Richard  Muller in 2010, before he set up the BEST temperature record.  His graph is shown below:  this post just puts some more precise values on the extent that the Underdeveloped world will wholly overwhelm any efforts in the West to reduce Global  CO2 emissions and thus attempt to influence Global temperature.

Study: Large Part Of 20th-Century Warming Caused By CFCs

by Prof. F. Vahrenholtz, February 20, 2020 in ClimateChaneDispatch


A few days ago, an international research group from the USA, Canada, and Switzerland led by Lorenzo Polvani of Columbia University (New York) published a sensational study in Nature climate change, which attributes a large part of the warming of the 20th century to CFCs (“Substantial twentieth-century Arctic warming caused by ozone-depleting substances“).

Using ten climate models, the researchers calculated the global and Arctic temperature development, once with CFCs (chlorofluorocarbons) in the atmosphere and once without.

According to these models, from 1955 to 2005, global temperatures increase by 0.59°C with CFCs and by 0.39°C without CFCs. One-third of the warming is therefore not caused by CO2 but by the CFCs.

If the remaining warming for CO2 is converted over the five decades, average warming of 0.08°C per decade remains. Not exactly a lot. CFCs have a 19,000-23,000 times stronger forcing than CO2.

Half of Arctic warming due to CFCs

Continuer la lecture de Study: Large Part Of 20th-Century Warming Caused By CFCs

RETOUR SUR 2019

by Samuel Furfari, 21 février 2020, in ScienceClimatEnergie


L’année 2019 aurait été celle de l’hystérie climatique. Les manifestations des jeunes qui ont suivi avec enthousiasme les conseils d’une jeune suédoise ont donné à des politiciens en quête de raison d’être une opportunité pour montrer qu’ils s’occupent de la jeunesse, mais aussi de l’environnement ou plus précisément de « sauver la Planète ».
Qui n’est pas en faveur de la protection de l’environnement ?
Qui n’est pas attentif à la santé ?
L’occasion rêvée pour redonner du sens à la politique était trop belle, d’autant plus qu’il y avait en 2019 l’élection d’un nouveau parlement européen. L’inflation de promesses inconsidérées ne s’est pas fait attendre. Elle a abouti le 11 décembre 2019 à la publication d’une nouvelle stratégie de la Commission européenne appelée « Green Deal » et à son adoption par le Conseil européen le 13 décembre, avec un parlement européen qui en veut encore plus.

L’inflation des promesses est à son comble, tout comme le budget qu’il va falloir débourser pour atteindre ces promesses, destinées en fait à redonner une raison d’être à une Union européenne en manque de projets enthousiasmants pour ses citoyens et ignorée par les pays qui dirigent  les grands enjeux géopolitiques comme l’a manifestement montré le camouflet infligé à Angel Merkel lors de la conférence sur la Libye à  Berlin le 21 janvier 2020 .

Pourtant, sur le front de l’énergie, et non des politiques énergétiques, le début de la révolution annoncée n’a même pas commencé. Au contraire, la toute-puissance des énergies fossiles a été confirmée voire renforcée. La nouvelle géopolitique de l’énergie, qui a été créée grâce à l’abondance des énergies fossiles, s’est affermie et est entérinée par une grande partie du business de l’ énergie.

Britain’s Floods Have Nothing To Do With Climate Chang

by J. Delingpole, February 19, 2020 in ClimateChangeDispatch


Boris Johnson’s Greenest Government Evah has come up with a brilliant new excuse to duck its responsibilities for all the floods now swamping parts of Britain: climate change ate our homework.

From Hereford to Shrewsbury and South Wales to North Yorkshire, swathes of Britain are underwater thanks to flooding in the aftermath of Storm Dennis, which so far has claimed five lives.

There are currently more than 400 flood warnings around Britain, with more heavy rain forecast to come.

But the government has effectively absolved itself of responsibility by pinning the blame on ‘climate change.’

Environment Secretary George ‘Useless’ Eustice has said in an interview with LBC radio that the scale of the flooding is due to the ‘nature of climate change.’

Sir James Bevan, the chief executive of the Environment Agency, has gone a step further by blaming ‘the climate emergency.’

None of this is true. There is no evidence whatsoever to suggest that these floods are anything other than an entirely normal, cyclical event which has been repeated many times over many centuries — with or without the contribution of anthropogenic CO2.

Also : TWO NAMED STORMS HIT THE UK WITHIN TWO SUCCESSIVE WEEKENDS — “CLIMATE CHANGE TO BLAME!” BARK THE ILL-INFORMED

Sea Level Rise Is Accelerating (If You Ignore Pre 1970 Data!)

by P. Homewood, February 19, 2020 in NotaLotofPeopleKnowThat


This has to go down as one of the most fraudulent climate studies yet!

Want to know how sea level in your area is changing due to global warming and other factors? Our ‘report cards’ can help. Updated by the Virginia Institute of Marine Science each year as annual tide-gauge data become available, they display recent sea-level trends and project sea-level height to the year 2050 for 32 localities along the U.S. East, Gulf, West, and Alaskan coasts.

Report Card Components

Our report cards have 3 components: the 2050 projection, recent trends in the rates of sea-level change, and an explanation of processes affecting sea level at each locality.

The annotated chart below, using the latest data from Norfolk, Virginia, briefly explains the data and statistical approaches we use in our 2050 projections. Visit an individual locality for details on all its report-card components. You can also compare sea-level trends, projections and processes among localities and by region. For full technical details, read our report.

https://www.vims.edu/research/products/slrc/index.php

The UN’s Planet Saving Delusion

by Donna Laframboise, February 19, 2020 in BigPictureNews


The UN couldn’t help Haiti recover from an earthquake. But it imagines we’d all perish without it.

UNESCO is supposed to be about cultural preservation. Toward the end of last year, its in-house magazine nevertheless published a special issue on climate change. The official editorial employs the usual cliches. Catastrophic consequences. The “greatest global challenge of our times.” Blah, blah.

Hilariously, this editorial implies that, without a UN plan, the planet simply won’t survive. Earth to UNESCO: could we spend five minutes talking about how the UN has failed – tragically and comprehensively – to save Haiti?

That nation has less than 12 million people. It’s slightly smaller than the US state of Maryland. Because it comprises half of an island, its borders are well-defined. The UN has had a significant presence there since 2004, yet Haiti remains a basket case.

After a devastating earthquake struck in 2010, rebuilding was a huge job at which the UN was spectacularly inept. But that isn’t the half of it. UN peacekeepers then infected the already traumatized local population with cholera.

The peacekeepers were from Nepal, which had just experienced a cholera outbreak. The UN took no steps to ensure its personnel weren’t carrying the disease. Nor did it establish proper sanitation at their encampment. Untreated sewage got dumped into the country’s most important river, contaminating water that was used for drinking, cooking, and bathing.

Is “All-Time Antarctic 20.75C Record High Temperature” Just A Sensational Hoax? Station Data Show Only 16C

by P. Gosselin, February 17, 2020 in NoTricksZone


In Germany there have been rumors that the alleged Antarctic Seymour Island “all-time Antarctic record high” of 20.75°C set on February 9th is a hoax – originating by the AFP news agency and then spread by The Guardian.

The alleged 20.75°C was supposedly logged by Brazilian scientists and was supposedly almost a full degree higher than the previous record of 19.8C, taken on Signy Island in January 1982, The Guardian blared with much alarm, citing its own rush job chart.

Currently the WMO is seeking to obtain the actual temperature data for Seymour Island, part of a chain of islands off the Antarctic peninsula.

WMO cites media as source!

The WMO website itself is citing the media as its source, writing: “Media reports say that researchers logged a temperature of 20.75°C. Mr Cerveny cautioned that it is premature to say that Antarctica has exceeded 20°C for the first time.”

Thermometer data show only 16°C!

According to German Facebook site Klima.Wissen here and its readers, the “all-time record high reading” of 20.75°C appears to have its origins from the AFP news agency. It was then picked up by the always climate sensational The Guardian. But now the whole story is beginning to appear as just big sensational hoax.

First, WetterOnline.de here shows that the high temperature on February 9th at the Seymour Island station (Base Murambio) was merely 16°C!

HEAVY SNOW AND FREEZING TEMPERATURES HIT SOUTH KOREA — AT LEAST 3 PEOPLE KILLED IN SEOUL

by Cap Allon, February 17, 2020 in Electroverse


Seoul received its largest single-day snowfall of the season on Monday as 4.1cm (1.6 inches) settled in South Korea’s capital city, adding to the 3.9cm (1.54 inches) from the previous day, the Korea Meteorological Administration (KMA) said.


The Monday morning mercury plunged to -5.5C 22.1F) in Seoul, with a harsh windchill making it feel more like –10.5C (13.1F). The KMA added that temps will dip even further tomorrow (Tues), to -8C (17.6F).

Icy roads resulted in a 20 vehicle pile-up inside a tunnel connecting Suncheon and Wanju in North Jeolla on Monday, leaving three people dead and another 38 others injured, according to police.

A chemical truck carrying sodium hydroxide was one of the vehicles involved in the accident. Police said the truck caught fire and caused a toxic gas leak in the tunnel, hindering rescue efforts.

Plausible scenarios for climate change: 2020-2050

by Judith Curry, February 13, 2020 in WUWT


A range of scenarios for global mean surface temperature change between 2020 and 2050, derived using a semi-empirical approach. All three modes of natural climate variability – volcanoes, solar and internal variability – are expected to act in the direction of cooling during this period.

In the midst of all the angst about 1.5oC or 2.0oC warming or more, as defined relative to some mythical time when climate was alleged to be ‘stable’ and (relatively) uninfluenced by humans, we lose sight of the fact that we have a better baseline period – now. One advantage of using ‘now’ as a baseline for future climate change is that we have good observations to describe  the climate of  ‘now’.

While most of the focus of climate projections is on 2100, the period circa 2020-2050 is of particular importance for several reasons:

  1. It is the period for meeting UNFCCC targets for emissions reductions

  2. Many financial and infrastructure decisions will be made on this time scale

  3. The actual evolution of the climate over this period will influence 1) and 2) above; ‘surprises’ could have adverse impacts on decisions related to 1) and 2).

Figure 1: CO2-induced warming as a function of cumulative emissions and TCRE. Millar et al


Continuer la lecture de Plausible scenarios for climate change: 2020-2050

Polar bear habitat at mid-winter as extensive as 2013 & better than 2006

by S. Crockford, February 14, 2020 in PolarbearScience


Arctic sea ice at the middle of winter (January-March) is a measure of what’s to come because winter ice is the set-up for early spring, the time when polar bears do most of their feeding on young seals.

[Mid-winter photos of polar bears are hard to come by, partly because the Arctic is still dark for most hours of the day, it’s still bitterly cold, and scientists don’t venture out to do work on polar bears until the end of March at the earliest]

At 12 February this year, the ice was similar in overall extent to 2013 but higher than 2006.

Bjorn Lomborg Fighting Australia’s Fire Myths

by P. Homewood, January 29, 2020 in NotaLotofPeopleKnowThat


https://www.facebook.com/bjornlomborg/photos/a.221758208967/10158703983303968/?type=3&theater

As he points out in the article:

Australia is the world’s most fire-prone continent. In 1900, 11 per cent of its surface burned annually. These days, 5 per cent of the country burns every year. By the end of the century, if we do not stop climate change, higher temperatures and an increase in aridity will likely mean a 0.7 percentage point increase in burnt area, an increase from 5.3 per cent of Australia to 6 per cent.

Unfortunately, many reports on Australia’s fires have exploited the carnage to push a specific agenda, resting on three ideas: that bushfires are worse than ever, that this is caused by global warming, and that the only solution is for political leaders to make even bigger carbon-cut promises.

Globally, bushfires burn less land than it used to. Since 1900, global burnt area has reduced by more than one-third because of agriculture, fire suppression and forest management. In the satellite era, NASA and other groups document significant decreases.

Surprisingly, this decrease is even true for Australia. Satellites show that from 1997 to 2018 the burnt area declined by one-third. Australia’s current fire season has seen less area burned than in previous years. Up to January 26, bushfires burned 19.4 million hectares in Australia — about half the average burn over the similar timeframe of 37 million hectares in the satellite record. (Actually the satellites show 46 million hectares burnt, but 9 million hectares are likely from prescribed burns.)

When the media suggests Australia’s fires are “unprecedented in scale”, it is wrong. Australia’s burnt area declined by more than a third from 1900 to 2000, and has declined across the satellite period. This fire season, at the time of writing, 2.5 per cent of Australia’s area has burned compared with the past 10 years’ 4.8 per cent average by this point.

What is different this year is that fires have been mostly in NSW and Victoria. These are important states with a little more than half the country’s population — and many of its media outlets.

But suggesting fires are caused by global warming rests on cherrypicking these two regions with more fire and ignoring the remaining 87 per cent of Australia’s landmass, where burned area has declined.

I certainly would take issue with the claim aridity will increase, as we know that rainfall has generally been greater since the 1970s than before.

Lomborg goes on to make the points I have made regularly, that there are many practical ways to reduce the risk of severe fires, and that even if Australia went totally net zero, it would have no effect whatsoever on their climate.

Well worth a read though.

The Rise and Fall of Central England Temperatures; Part 3 2000-2019

by Tony Brown, February 15, 2020 in WUWT


This is the third examination of Central England Temperatures (CET) in a series that commenced in 2015 and which has charted the recent decline in temperatures from their highest values. The two previous articles in this series are referenced here;

The Rise and Fall of Central England Temperatures; Part 1 covering 2000 to 2015

https://judithcurry.com/2015/11/25/the-rise-and-fall-of-central-england-temperature/

The Rise and Fall of Central England Temperatures; Part 2 covering 2000 to 2017

https://wattsupwiththat.com/2018/03/04/the-rise-and-fall-of-central-england-temperatures-help-needed-to-find-missing-data/

When referencing any ‘decline’ we need to put that into context against CET’s overall substantial rise in recent decades. The official CET dataset used in this article, which is compiled by the UK Met office is linked here and shown in Figure A);

https://www.metoffice.gov.uk/hadobs/hadcet/

It should be noted that the values between 1538 and 1658 are my own reconstruction and are not used at all in this current paper.

Note: Weather comprises the day to day events that we all experience. Climate is officially the trend of the weather (often temperature and rainfall) taken over a continuous thirty year period. The two terms have sometimes been used in an interchangeable manner here, when a period of more than a year is being examined.

Figure A

According to the Met office; ‘Since 1974 the data have been adjusted to allow for urban warming: currently a correction of -0.2 °C is applied to mean temperatures.’

Greta’s, The Guardian’s Latest Panic Attack Over Antarctica Record Ignores Cooling Trends Of Recent Decades

by P. Gosselin, February 15, 2020 in NoTricksZone


In her latest panic attack, teenage Swedish climate activist Greta Thunberg – citing the Guardian –  once again appeared to be proclaiming the end of the world was a step closer when she tweeted Antarctica has set a new record high temperature:


Two new warm records

According to the Guardian, “The 20.75C logged by Brazilian scientists at Seymour Island on 9 February was almost a full degree higher than the previous record of 19.8C, taken on Signy Island in January 1982.”

That reading, the Guardian reports, follows the February 6 record of 18.3C recorded at the Argentinian research station, Esperanza measured.

As is the case with most alarmists, every warm single datapoint anomaly gets uncritically accepted with open arms as solid evidence of man-made global warming while cold trends get dismissed or downgraded as “natural variability”.

Seymour Island has been cooling for over a quarter century

So we have two recent warm records set at and near the Antarctic peninsula over the past week or so and that means the region there is heating up, alarmists like Greta and the Guardian want us to believe. But what are the real TRENDS there? Do the 2 recent warm records mean the region is heating up.

Looking at official data from NASA, it turns out that warming isn’t true. And because climate is always changing, the temperature in the region in question has also not remained completely steady. The only possibility left? COOLING.

Also here

Physics Professor: CO2’s 0.5°C Impact After Rising To 700 ppm Is So Negligible It’s ‘Effectively Unmeasurable’

by P. Stallinga, February 13, 2020 in NoTricksZone


Dr. Peter Stallinga has published a comprehensive analysis of the Earth’s greenhouse effect. He finds an inconsequential role for CO2.

Doubling CO2 from 350 to 700 ppm yields a warming of less than 0.5°C (500 mK).

Feedbacks to warming are likely negative, as adding CO2 may only serve to speed up natural return-to-equilibrium processes.

As for absorption-reemission perturbation from CO2, “there is nothing CO2 would add to the current heat balance in the atmosphere.”

A portion of Dr. Stallinga’s paper worth highlighting – which he mentions only in passing – refers to the early history of the Earth’s greenhouse effect paradigm.

K. Ångström receives little attention as a pioneer of the conceptualization that warming and cooling resul from radiative imbalances within a planetary greenhouse effect.

About 120 years ago, Ångström (1900) contradicted the oft-cited Arrhenius (1896) – the atmospheric physicist referred to by proponents of anthropogenic global warming.

Ångström suggested Earth’s greenhouse effect is already saturated in its current (1900) state, and therefore increasing CO2 will have “no effect whatsoever” on climate (Stallinga, 2020).

Ångström’s conclusions were largely ignored.

..

Bad news for climate alarmists: global carbon dioxide emissions flatlined in 2019

by A. Watts, February 13, 2020 in WUWT


From the inconvenient data department and the IEA comes this press release.


Despite widespread expectations of another increase, global energy-related carbon dioxide emissions stopped growing in 2019, according to IEA data released today.

After two years of growth, global emissions were unchanged at 33 gigatonnes in 2019 even as the world economy expanded by 2.9%. This was primarily due to declining emissions from electricity generation in advanced economies, thanks to the expanding role of renewable sources (mainly wind and solar), fuel switching from coal to natural gas, and higher nuclear power generation. Other factors included milder weather in several countries, and slower economic growth in some emerging markets.

Continuer la lecture de Bad news for climate alarmists: global carbon dioxide emissions flatlined in 2019

Climate Crisis Update–England As Warm As 1736 Last Month!

by P. Homewood, February 13, 2020 in NotaLotofPeopleKnowThat


https://www.metoffice.gov.uk/hadobs/hadcet/cet_info_mean.html

It’s been a mild start to the year here in England. In fact, according to the CET, it’s been the 14th warmest January since the start of records in 1659.

No doubt fingers will be pointed at global warming, but as the above chart shows, we have simply had mild weather of the commonly seen before. The difference is that it lasted virtually all month.

Moreover we have had warmer Januaries way back in the past. The warmest was in 1916, followed by 1921, 1796 and 1834.

https://www.metoffice.gov.uk/hadobs/hadcet/mly_cet_mean_sort.txt

Continuer la lecture de Climate Crisis Update–England As Warm As 1736 Last Month!

Mille milliards pour atteindre la neutralité carbone ?

by Samuel Furfari, 11 février 2020 in L’Echo


On perçoit que cette résolution est la prémisse qui va permettre d’amplifier les politiques keynésiennes en vue de relancer une économie européenne poussive par les dépenses publiques, c’est-à-dire in fine par la levée de nouvelles taxes, qu’elles soient appelées ” carbone ” ou autrement.

La majorité du parlement européen (les partis social-chrétien, socialiste et écologiste) a adopté le 15 janvier 2020 le pacte vert pour l’Europe, une résolution en 120 points qui vise la neutralité carbone d’ici 2050. Ils auraient d’ailleurs pu appeler cette résolution “transition juste” puisque cette expression s’y retrouve 15 fois. Qui peut s’opposer à quelque chose de juste? On peut observer que d’après cette majorité parlementaire, il n’y aura pas de justice sans financement.

Ces députés européens sont en faveur d’un plan d’investissement durable ambitieux pour parvenir à la “transition juste”. On retrouve d’ailleurs 49 fois les mots ” financement ” et ses dérivés. Or les critères de Maastricht ne permettent pas aux États membres de dépenser de manière inconsidérée l’argent qu’ils n’ont pas. On perçoit que cette résolution est la prémisse qui va permettre d’amplifier les politiques keynésiennes en vue de relancer une économie européenne poussive par les dépenses publiques, c’est-à-dire in fine par la levée de nouvelles taxes, qu’elles soient appelées “carbone” ou autrement. Pour preuve, cette résolution “se félicite de la proposition prévue d’une révision de la directive sur la taxation de l’énergie”.

La Commission européenne propose un plan sur dix ans visant à accélérer la transition climatique de l’Europe, plan financé à hauteur de mille milliards, tout en reconnaissant que c’est insuffisant. “Mille milliards de mille sabords”, aurait sans doute juré le capitaine Haddock. Mille milliards c’est ce qu’on appelle un “trillion” : c’est 1 000.000.000.000 euros. Oui, un trillion c’est énormément d’argent.

Climate Change is not a problem: Unless we make it one.

by Martin Capages Jr., February 11, 2020 in WUWT


INTRODUCTION

As long as humans have been on Earth, they have been adapting to changes in regional climates. A regional climate is the average of the weather for a relatively long period of time, usually 30+ years, at a particular location on the planet. The natural periodicity of prolonged regional weather variations has been documented in various ways by humans for eons. For a comparison of human civilization in the northern hemisphere to Greenland ice core temperatures for the last 18,000 years see here. Some of the means of documenting changes in long term weather patterns, i.e. climate change, include crude prehistoric cave drawings of the animals and plants, paintings of frozen rivers (see Figure 1 of ice skating on the River Thames in 1684), and archaeological digs. There are also written records of climatic conditions as early as 5,000 years ago, perhaps even earlier. Ice, subsea, peat and lake bed cores are also used, for a more detailed discussion of the methods used see here and the links therein.

Figure 1. Ice skating on the River Thames in London in January 1684, during the Little Ice Age. Museum of London, link.


Continuer la lecture de Climate Change is not a problem: Unless we make it one.

Storm Of The Century? Don’t Be Silly, Met Office

by P. Homewood, February 10, 2020 in NotaLotofPeopleKnowThat


Britain is facing further mayhem over the next 48 hours in the wake of Storm Ciara which battered Britain with winds of up to 100mph causing widespread flooding and travel chaos.

Hundreds of flights were grounded, motorways and main roads shut and trains cancelled and delayed in the wake of a storm that threatens further disruption.

The Met Office warned that ‘exceptional’ gusts of up to 70mph would strike again on Monday and issued snow and ice warnings for large swathes of northern England and almost all of Scotland. The south of England will also be hit for a second day by heavy winds.

Gusts of 97mph were recorded at the Needles off the Isle of Wight while Manchester Airport was buffeted by winds of up to 86mph.

Continuer la lecture de Storm Of The Century? Don’t Be Silly, Met Office

OFFICIAL DATA REVEALS JANUARY 2020’S ANTARCTIC SEA ICE EXTENT TRACKED 1979-1990 AVERAGE

by Cap Allon, February 10, 2020 in Electroverse


According to official government data from the National Snow & Ice Data Center (NSIDC), Antarctic Sea Ice Extent is currently tracking the 1979-1990 average:

In addition, Jan 2020’s extent exceeded that of 2019, 2018, 2017, 2016, 2011, 2007, 2006, 2005, 2000, 1997, 1993, 1992, 1988, 1985, 1984, 1981, and 1980.


NO CORRELATION BETWEEN CO2 AND SEA ICE EXTENT

Since 1979 — the year sea ice satellite measurements began — CO2 readings taken at the Mauna Loa Observatory in Hawaii have been on an unnaturally linear rise. While, during the same period, Antarctic Sea Ice Extent has been “extremely variable” with “the yearly minimum hitting both record highs and lows” — NOAA (climate.gov)

Media’s Horribly Dishonest Antarctica Propaganda

by Jim Steele, February 9, 2020 in WUWT


The current context for the Antarctica Peninsula is that for over a decade it has experienced cooling temperatures driven by natural variability. In fact, glaciers in Esperanza’s region have also expanded. Esperanza’s record temperature simply happened due to foehn winds despite a cooling trend. Unfortunately, the media would rather scare the public to promote a climate crisis, than honestly educate them about the causes of natural climate variability.

La géologie, une science plus que passionnante … et diverse