by D. Whitehouse, June 19,2020 in ClimateChangeDispatch
Ten days ago the journal Science issued an embargoed press release about a forthcoming paper that suggested the warming observed in West Antarctica was due to natural climatic variability.
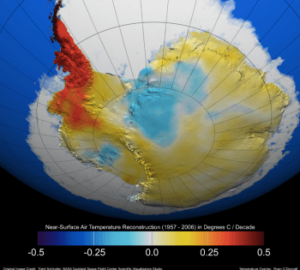
West Antarctica has always been looked on by alarmists as being the southern example of polar temperature amplification – a phenomenon predicted by most climate change models.
The Arctic temperature amplification is very apparent so there must be an Antarctic equivalent, and there it is.
But while scientists have been well aware that Antarctica is warming asymmetrically, with West Antarctica experiencing more than East Antarctica and frequently attributed to climate change, the underlying causes of this phenomenon have been poorly understood, and the suggestion that West Antarctica may be experiencing natural warming has been suggested before though not taken up very enthusiastically, if at all.
This new paper, “The internal origin of the west-east asymmetry of Antarctic climate change”, expresses the dilemma well.
….