by Andy May, October 30, 2018 in WUWT
Here, for the first time in public, is Javier’s entire collection of massive, “consensus” climate science prediction failures. This collection is carefully selected from only academics or high-ranking officials, as reported in the press or scientific journals. Rather than being exhaustive, this is a list of fully referenced arguments that shows that consensus climate science usually gets things wrong, and thus their predictions cannot be trusted.
To qualify for this list, the prediction must have failed. Alternatively, it is also considered a failure when so much of the allowed time has passed that a drastic and improbable change in the rate of change is required for it to be true. Also, we include a prediction when observations are going in the opposite way. Finally, it also qualifies when one thing and the opposite are both predicted.
A novelty is that I also add a part B that includes obvious predictions that consensus climate science did not make. In science you are also wrong if you fail to predict the obvious.
A. Failed predictions
…
by Steve McIntyre, October 24, 2018 in ClimatAudit
The PAGES (2017) North American network consists entirely of tree rings. Climate Audit readers will recall the unique role of North American stripbark bristlecone chronologies in Mann et al 1998 and Mann et al 2008 (and in the majority of IPCC multiproxy reconstructions). In today’s post, I’ll parse the PAGES2K North American tree ring networks in both PAGES (2013) and PAGES (2017) from two aspects:
…
Conclusions
-
ex post screening based on recent proxy trends necessarily biases the resulting data towards a Hockey Stick shape – a criticism made over and over here and at other “ske;ptic” blogs, but not understood by Michael (“I am not a statistician”) Mann and the IPCC paleoclimate “community”;
-
the PAGES 2017 North American tree ring network has been severely screened ex post from a much larger candidate population: over the years, approximately 983 different North American tree ring chronologies have been used in MBH98, Mann et al 2008, PAGES 2013 or PAGES 2017. I.e. only ~15% of the underlying population was selected ex post – a procedure which, even with random data, would impart Hockey Stick-ness to any resulting composite
-
despite this severe ex post screening (in both PAGES 2013 and PAGES 2017), the composite of all data other than stripbark bristlecones had no noticeable Hockey Stick-ness and does not resemble a temperature proxy.
- …
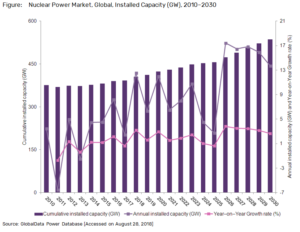
by GlobalData Energy, October23, 2018
Nuclear technology is a major base-load power-generating source and accounted for 10.5% of global power generation in 2017 as per GlobalData, a leading data and analytics company.
The nuclear power sector is growing in many countries as demand for electricity increases. The company’s latest report ‘Nuclear Power – Thematic Report’ reveals that some 31 countries are currently operating nuclear reactors for their electricity generation. Countries with significant nuclear power capacity are the US, France, Japan, China, Russia, South Korea, Canada, and Ukraine, with more than ten gigawatts (GW) installed capacity each. Germany, the UK, Sweden, India, Spain, Belgium, and Taiwan have five to ten GW installed nuclear power capacity each.
The global cumulative installed nuclear power capacity in 2010 was 376GW, of which more than 100GW was in the US alone.
…
by Anthony Watts, October 24, 2018 in WUWT
18 volcanoes in the USA are classified as “very high threat”, many are in the Pacific Northwest.
Here the .pdf (USGS, 2018)
The United States has 161 young, active volcanoes within its borders. Since 1980, there have been 120 eruptions and 52 episodes of notable volcanic unrest at 44 U.S. volcanoes.
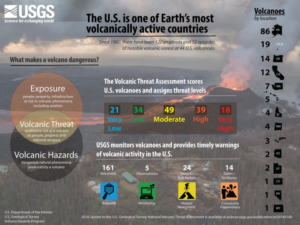
The U.S. Geological Survey systematically assesses U.S. volcanoes considered to be active or potentially active, and publishes a volcanic threat assessment that ranks the volcanoes based on 24 hazard and exposure factors. Last published in 2005, this 2018 update considers (1) field and laboratory research that adds or removes volcanoes from the list of potentially active volcanoes, and (2) updates the hazard and exposure factors used to produce a relative threat ranking of volcanoes.
…
La géologie, une science plus que passionnante … et diverse
