Stronger oil and natural gas prices combined with continuing development of shales and low permeability formations drove producers of crude oil and natural gas in the United States to report new all-time record levels of proved reserves for both fuels in 2017. Total U.S. oil reserves in 2017 exceeded a brief, one-year, 47-year-old record, highlighting the importance of crude oil development in shales and low permeability plays, mainly in the Southwest. The new record for natural gas extends a longer-term trend of development, mainly in shale plays in the Northeast. Both U.S. proved reserves of crude oil and natural gas are approximately double their levels from a decade ago. These new proved reserves records were established in 2017 despite production of crude oil at levels not seen since 1972, and record natural gas production.
The unexpected results of a 20-year study into reef fisheries published in the journal Nature Ecology and Evolution this week showed fisheries being maintained despite extreme coral bleaching. Remarkably, rapid proliferation of fishes with low dependence on corals led to catches remaining stable or even increasing.
But the results also showed fishing success was ‘patchy’ and more dependent on fewer species.
Around six million people fish on coral reefs. Each year their catch — estimated to be between 1.4 and 4.2 million tonnes — provides a critical source of food and income for many millions more.
Here, we reconstructed Phanerozoic PCO2 from a single proxy: the stable carbon isotopic fractionation associated with photosynthesis (Ɛp) that increases as PCO2 increases. This concept has been widely applied to alkenones, but here, we expand this concept both spatially and temporally by applying it to all marine phytoplankton via a diagenetic product of chlorophyll, phytane. We obtained data from 306 marine sediments and oils, which showed that Ɛp ranges from 11 to 24‰, agreeing with the observed range of maximum fractionation of Rubisco (i.e., 25 to 28‰). The observed secular PCO2 trend derived from phytane-based Ɛp mirrors the available compilations of PCO2over the past 420 Ma, except for two periods in which our higher estimates agree with the warm climate during those time periods. Our record currently provides the longest secular trend in PCO2 based on a single marine proxy, covering the past 500 Ma of Earth history
…
Fig. 2Ɛp calculated from phytane in Witkowski et al., 2018
by H. Schreuder, November 28, 2018 in ClimateChangeDipsatch
After decades of alarm calls over the impact of human emissions of carbon dioxide (CO2) on global temperatures and climate change, a glaring lack of factually demonstrated and scientifically proven evidence remains.
The evidence presented has been based on computer modeling of temperatures from global weather stations, a larger percentage of which are sited in towns and cities and no data, numerous studies show.
For the 70% of oceans, seas, and lakes, satellite measurements are routinely adjusted to take account of anomalies and sea level rise alarm, expressed in measurements of millimeters per century, does not quantify in that tidal gauges are subjected to landmass upheavals and/or subsidence, none of which can be taken to represent empirical evidence.See Also: New study shows coastlines gaining land despite sea level alarmism) …
This report reflects 18 months of work on this topic. Why have I devoted so much time to the sea level rise issue? First, I regard sea level rise to be the most consequential potential impact of predicted global warming. Second, there is a great deal of public confusion about the issue, including decision makers. Third, a number of CFAN’s clients have queried me about a range of specific concerns that they have regarding sea level rise (and I have been doing consulting on this topic).
Why do I think an independent assessment of the sea level rise issue by yours truly is needed, given the plethora of international and national assessment reports? My clients are concerned about the alarmist predictions they have encountered. I have seen various ‘experts’ make public statements projecting 21stcentury sea level to be as high as 9 m [30 feet]. My clients are looking for someone that they trust to provide an objective assessment that focuses on their issues of concern.
The levels of oxygen dramatically rose in the atmosphere around 2.4 billion years ago, but why it happened then has been debated. Some scientists think that 2.4 billion years ago is when organisms called cyanobacteria first evolved, which could perform oxygen-producing (oxygenic) photosynthesis.
Other scientist think that cyanobacteria evolved long before 2.4 billion years ago but something prevented oxygen from accumulating in the air.
Cyanobacteria perform a relatively sophisticated form of oxygenic photosynthesis — the same type of photosynthesis that all plants do today. It has therefore been suggested that simpler forms of oxygenic photosynthesis could have existed earlier, before cyanobacteria, leading to low levels of oxygen being available to life.
Now, a research team led by Imperial College London have found that oxygenic photosynthesis arose at least one billion years before cyanobacteria evolved. Their results, published in the journal Geobiology, show that oxygenic photosynthesis could have evolved very early in Earth’s 4.5-billion-year history.
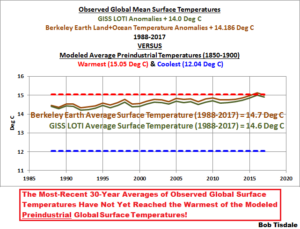
And What Have the Average Temperatures of Earth’s Surfaces Been Recently in Absolute Terms, Not Anomalies?
The answers may surprise you.
THIS POST HAS BEEN UPDATED. The update is near the end of the post.
…
So, for the purpose of this very simple illustration and comparison, and for the discussions it will generate, I’ve added 14 deg C to the annual GISS LOTI data available here, and added 14.186 deg C to the annual Berkeley Earth data. I also compared them to the 12.04 deg C to 15.05 deg C range of hindcast preindustrial global mean surface temperatures from the climate model ensemble members discussed earlier. See Figure 3. Not too surprisingly, the Berkeley Earth and GISS global mean surface temperatures, in absolute form, are very similar, with only a 0.1 deg C difference during the most recent 30-years.
Winter has arrived much earlier than normal this year, particularly across North America, where cold records have been shattered.
This Thanksgiving is in fact going down as one of the coldest ever on record across the Northeast. The Washington Post here, for example, reports that Thanksgiving and Black Friday 2018 will be remembered for a record-shattering cold snap across the Northeast United States.”
…
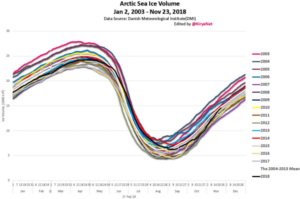
Arctic sea ice, snow and ice cover rebound
Arctic sea ice volume has rebounded and is near normal levels. The sea ice trend has remained stable over the past decade and thus defy all the climate alarmist predictions of an Arctic meltdown.
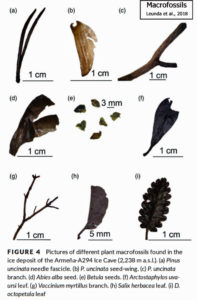
Newly published macrofossil discoveries from 4 papers strongly suggest that modern warmth may still be about 3°C colder than nearly all of the last 10,000 years.
Talk about cold turkey! The coldest Thanksgiving in 100 years, and quite possibly the coldest Thanksgiving ever, has hit the Northeast United States today.
The unprecedented cold snap comes courtesy of a large Canadian chill working its way across the country on its way to the Atlantic. According to the Weather Network, the deep freeze is the result of a large, low pressure system moving south from the Arctic across the Great Lakes. Combine that with a wicked wind chill, and many Americans are looking at the coldest Thanksgiving in a century.
La raison d’être de la taxe carbone qui pèse sur les carburants est qu’en augmentant le prix des carburants en France, cette taxe va diminuer la consommation de carburant, et les rejets de CO2 qui vont avec. Le raisonnement est solide. Mais la question est : de combien ? C’est l’enjeu. L’augmentation de cette taxe met le pays à feu et à sang. C’est la chandelle. Le jeu en vaut-il bien la chandelle ?
Pour y répondre il faut connaître la sensibilité de la consommation au prix, ce qu’on appelle l’élasticité-prix. C’est le rapport de l’effet, la variation de consommation (mesurée en %) sur la cause, la hausse de prix (également mesurée en %). Si une hausse des prix de 10% entraîne une diminution de consommation de 8%, l’élasticité est de -0,8.
Fossil fuels helped humanity improve our health, living standards and longevity in just 200 years.
…
Then, suddenly, a great miracle happened! Beginning around 1800, health, prosperity and life expectancy began to climb … slowly but inexorably at first, then more rapidly and dramatically. Today, the average American lives longer, healthier and better than even royalty did a mere century ago.
How did this happen? What was suddenly present that had been absent before, to cause this incredible transformation?
Humanity already possessed the basic scientific method (1250), printing press (1450), corporation (1600) and early steam engine (1770). So what inventions, discoveries and practices arrived after 1800, to propel us forward over this short time span?
by Toi Staff, November 24, 2018 in TheTimes.of.Israel
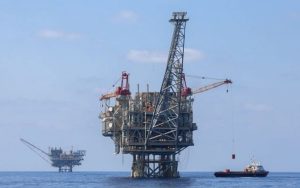
HE LONGEST, DEEPEST UNDERWATER GAS NETWORK IN THE WORLD
Greece, Italy, and Cyprus have reached an agreement with Israel to lay a pipeline connecting the Jewish state’s gas reserves to the three countries, in a major project estimated at costing over $7 billion that will supply gas from the eastern Mediterranean to Europe, as the continent seeks to diversify its energy supply.
According to Hadashot TV, the European Union agreed to invest $100 million in a feasibility study for the project before the agreement was reached over the laying of the longest and deepest underwater gas pipeline in the world.
Indonesia’s consumption of domestic coal for power generation will almost double from 84 million t in 2018 to 157 million t by 2027. This increases power generation’s share of domestic consumption from 18.5% to 33.6%, which is likely to displace export tonnage.
Another factor contributing to the higher coal consumption is that Indonesia’s new power plants are designed to consume lower energy coal. This means more coal will be required per unit of electricity generated.
This increase in domestic consumption combined with potential government efforts to conserve coal reserves represents a downside risk for Indonesian exports.
Indonesia’s electrification programme to drive domestic coal demand
Chapter 6 – Temperature Changes in the United States of the U.S. Global Change Research Program’s recently published Climate Science Special Report (2017) clearly shows and discusses, under the heading of “6.1.2 Temperature Extremes”, how temperature extremes for the contiguous United States have become more moderate over the last 118 years, with the coldest daily temperatures warming and the warmest daily temperatures cooling. In other words, temperature-extreme-related climate in the United States has improved.
New research disputes a long-held view that our earliest tool-bearing ancestors contributed to the demise of large mammals in Africa over the last several million years. Instead, the researchers argue that long-term environmental change drove the extinctions, mainly in the form of grassland expansion likely caused by falling atmospheric carbon dioxide (CO2) levels.
The study is published today in the journal Science.
“Despite decades of literature asserting that early hominins impacted ancient African faunas, there have been few attempts to actually test this scenario or to explore alternatives,” Faith says. “We think our study is a major step towards understanding the depth of anthropogenic impacts on large mammal communities, and provides a convincing counter-argument to these long-held views about our early ancestors.”
To test for ancient hominin impacts, the researchers compiled a seven-million-year record of herbivore extinctions in eastern Africa, focusing on the very largest species, the so-called ‘megaherbivores’ (species over 2,000 lbs.) Though only five megaherbivores exist in Africa today, there was a much greater diversity in the past. For example, three-million-year-old ‘Lucy’ (Australopithecus afarensis) shared her woodland landscape with three giraffes, two rhinos, a hippo, and four elephant-like species at Hadar, Ethiopia.
One of the most basic things about journalism, especially BBC journalism, is that anyone should be able to find out what the corporation reported on a particular day about a particular story. Imagine wanting to find out about what Parliament voted for or what was the content of a UN speech, or the conclusions of a report, and not having full confidence that what you are able to look up is what was actually broadcast or written.
The public does not have access to data held in TV and Radio News archives, but they do to the articles published by BBC News Online. Sadly if you want to know what article was published about a certain subject on a particular day you cannot be sure the BBC Online News website is telling you the truth for history might have been rewritten 1984 style if recent antics in its Environment section are anything to go by.
A number of environmental groups in Canada and other countries have recently endorsed the “100% Clean and Renewable Wind, Water and Sunlight (WWS)” vision articulated in reports written by MarkJacobson, Mark Delucci and others. This vision seeks to eliminate the use of all fossil fuels (coal, oil and natural gas) in the world by 2050. Jacobson, Delucci et. al. have published “all-sector energy roadmaps”in which they purport to show how each of 139 countries could attain the WWS goal. The purpose of this paper is to examine whether the 100% goal is feasible.
While a range of renewable energy technologies (e.g. geothermal, hydroelectric, tidal, and wave energy) could play a role in the global transformation, the world foreseen in the WWS vision would be dominated by wind and solar energy. Of 53,535 gigawatts (GW) of new electrical energy generation sources to be built, onshore and offshore wind turbines would supply 19,000 GW (35.4%), solar photovoltaic (PV) plants would supply 17,100 GW (32%) and Concentrated Solar Power plants (CSP) would supply 14,700 GW (27.5%). This would cost $100 trillion, or $3,571 for every household on the planet.
What do you think are the biggest challenges right now in your field?
Some of the challenges are too hard for me even to pursue them. In the climate world, we don’t know about the role of clouds. And I don’t know how to pursue this, so I don’t pursue it. Do clouds have a cooling effect, and what is the response from clouds to warming? Will they slow or accelerate the warming? We don’t know. The role of clouds is certainly a big, big question. Although I do not work on this, I think about it, but I don’t see what to do.
One of the problems I do work on is what brought us Ice Ages. How did we go through 300 My years without much ice in the northern hemisphere and then suddenly, beginning 3My years ago or so, we had 5 big Ice Ages? Why? An easy answer is that now CO2 is higher. But it’s really hard to measure, determining CO2 in the past is a big question.
Another big question for me is how does the convection in the mantle connect with deformation in the lithosphere? How do these connect to one another?
by Paul Berth, 22 novembre 2018, in ScienceClimatEnergie
Les microbulles de gaz emprisonnées dans les carottes de glace sont fréquemment utilisées pour estimer le taux de CO2 de l’atmosphère du passé. Il s’agit de méthodes de mesure indirectes. Par exemple la carotte de glace EPICA Dome C en Antarctique nous suggère que le CO2 de l’atmosphère a varié entre 180 et 300 ppmv pendant les derniers 650 000 ans (Brook 2005). Cependant, le taux de CO2 observé dans ces carottes de glace représente-il vraiment l’atmosphère du passé? Nous allons montrer ici qu’un paramètre est souvent négligé par les glaciologues, et que ce paramètre pourrait avoir un effet considérable sur le résultat des analyses : il s’agit de la présence de micro-organismes dans la glace et les microbulles.
The evidence that “global” warming has not been global in scale continues to accumulate. Two more new reconstructions from the Western Pacific (He et al., 2018) and subpolar North Atlantic (Orme et al., 2018) indicate that modern temperatures have continued to decline since the onset of the Little Ice Age.
These add to the nearly 300 graphs published in the scientific literature since 2017 showing that there is nothing unusual, unprecedented, or remarkable about the temperatures changes in the last 150 years.
The Camp Fire that struck the northern California town of Paradise and vicinity is a profoundly disturbing environmental disaster of first magnitude. Nearly 100 people have lost their lives, approximately 10,000 homes have been lost, a major community has essentially been destroyed, and millions of people have been exposed to high concentrations of smoke. Tens of thousands of people have been displaced and lives of millions substantially affected.
And beyond the heart-wrenching losses noted above, it is doubly tragic that this disaster was both foreseeable and avoidable, resulting from a series of errors, poor judgment, lack of use of available technology, and poor urban planning.
It is more than unfortunate that some politicians, environmental advocacy groups, and activist scientists are attempting to use this tragedy as a tool for their own agenda, make the claim that the Camp Fire was result of global warming.
The Lancaster university-led research, which is featured in Scientific Reports, is the first published field study to show methane release from glaciers on this scale.
“This is a huge amount of methane lost from the glacial meltwater stream into the atmosphere,” said Dr Peter Wynn, a glacial biogeochemist from the Lancaster Environment Centre and corresponding author of the study. “It greatly exceeds average methane loss from non-glacial rivers to the atmosphere reported in the scientific literature. It rivals some of the world’s most methane-producing wetlands; and represents more than twenty times the known methane emissions of all Europe’s other volcanoes put together.”
In the climate alarmists’ worldwide crusade against carbon dioxide gas, only the most delusional still believe that wind and solar power add anything to their arsenal.
As we have said repeatedly, nuclear power is the only stand-alone power generation source which is capable of delivering power on demand, without CO2 emissions being generated in the process.
Perversely, notwithstanding that Australia is in the top three uranium exporters, it’s the only G20 country with a legislated prohibition on nuclear power generation…
A few news items from The Shale Gas News, by Bill desRosiers of Cabot Oil & Gas. The main paragraphs below are adapted from desRosiers, but I’ve added some detail. Things are looking very good for the U.S. oil, gas and coal industries.
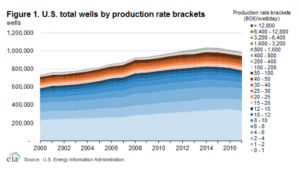
U.S. crude oil and natural gas production increased in 2017, with fewer wells. The total number of wells producing crude oil and natural gas in the United States fell to 991,000 in 2017, down from a peak of 1,039,000 wells in 2014. This recent decline in the number of wells reflects advances in technology and drilling techniques. EIA’s updated U.S. Oil and Natural Gas Wells by Production Rate report shows how daily production rates of individual wells contributed to U.S. total crude oil and natural gas production in 2017.
The well efficiency gains, in part, reflect an increase in the proportion of horizontal wells. The number of vertical wells decreased from 940,000 in 2014 to 864,000 in 2017. The number of horizontal wells increased from 99,000 in 2014 to 127,000 in 2017, an increase of 28%. This is important since only one percent of vertical wells produce 100 barrels of oil per day (BOPD) or more, but 30% of horizontal wells do. Typically, a horizontal well costs about twice as much as a vertical well to the same reservoir.
U.S. oil production grew from 10 million BOPD to 11 million BOPD between December 2017 and July 2018. Over the same period natural gas production grew from 97 BCF (billion cubic feet) to 100 BCF. Figures 1, 2, and 3 show the total number of wells drilled and the total oil and natural gas production.
…
La géologie, une science plus que passionnante … et diverse