by F. Muschitiello et al., March 20, 2019 in Nature
Abstract
Constraining the response time of the climate system to changes in North Atlantic Deep Water (NADW) formation is fundamental to improving climate and Atlantic Meridional Overturning Circulation predictability. Here we report a new synchronization of terrestrial, marine, and ice-core records, which allows the first quantitative determination of the response time of North Atlantic climate to changes in high-latitude NADW formation rate during the last deglaciation. Using a continuous record of deep water ventilation from the Nordic Seas, we identify a ∼400-year lead of changes in high-latitude NADW formation ahead of abrupt climate changes recorded in Greenland ice cores at the onset and end of the Younger Dryas stadial, which likely occurred in response to gradual changes in temperature- and wind-driven freshwater transport. We suggest that variations in Nordic Seas deep-water circulation are precursors to abrupt climate changes and that future model studies should address this phasing.
…
by F. Bosse and F. Vahrenholt, March 29, 2019 in NoTricksZone
The sun was also very sub-normally active in February. Although we are in the middle of the minimum, the sunspot number of 0.8 for the 123rd month into the cycle is very low. On 26 days of the month no spots were visible, only on 2 days was there a little, symmetrically distributed over both solar hemispheres.The only exciting question currently: When will the minimum be finished and will solar cycle 25 begin? Although 6 spots of the new cycle were already visible in February with a significantly higher resolution, estimates are difficult.March again was dominated by some spots of the “old” SC24. The rule: “weaker cycles often last longer than stronger cycles” could hold.
…
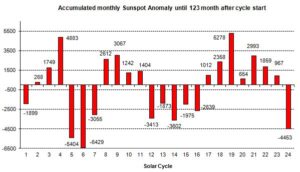
Figure 2: The strength of the sunspot activity of each cycle in comparison. The numbers in the diagram are obtained by adding up the monthly deviations between the observed values and the mean value (blue in Fig.1) up to the current 123rd cycle month.
Figure 2 shows that five cycles (No. 8, 15, 16, 18, 22) did not have a month 123 at all. Instead the following cycle started. In this respect, the picture is now somewhat distorted towards the end of the cycle.
…
See also here in GWPF
by U. of California – Berkeley, March 29, 2019 in ScienceDaily
-
Paleontologists have found a fossil site in North Dakota that contains animals and plants killed and buried within an hour of the meteor impact that killed the dinosaurs 66 million years ago. This is the richest K-T boundary site ever found, incorporating insects, fish, mammals, dinosaurs and plants living at the end of the Cretaceous, mixed with tektites and rock created and scattered by the impact. The find shows that dinosaurs survived until the impact.
…
by Charles the moderator, March 29, 2019 in WUWT
Chalmers University of Technology
A sixth of all emissions resulting from the typical diet of an EU citizen can be directly linked to deforestation of tropical forests. Two new studies, from Chalmers University of Technology, Sweden, shed new light on this impact, by combining satellite imagery of the rainforest, global land use statistics and data of international trade patterns.
“In effect, you could say that the EU imports large amounts of deforestation every year. If the EU really wants to achieve its climate goals, it must set harder environmental demands on those who export food to the EU,” says Martin Persson from Chalmers, one of the researchers behind the studies.
The link between production of certain foods and deforestation has been known before. But what Martin Persson and Chalmers colleague Florence Pendrill have now investigated is the extent to which deforestation in the tropics is linked to food production, and then where those foods are eventually consumed. In the first study, they focused on how the expansion of cropland, pastures, and forestry plantations has taken place at the expense of the rainforest.

Emissions sources for deforestation-related carbon dioxide emissions are diverse and vary by region. Emissions embodied in production are shown for each commodity group within each region. A region’s width on the x-axis corresponds to the embodied emissions produced in that region, while the y-axis shows the share of emission attributed to each commodity group within each region, implying that the rectangles within the plot are scaled according to the emissions embodied in each region-commodity combination. The percentages within the rectangles indicate the share of the total embodied emissions; 2.6?gigatonnes of carbon dioxide due to tropical deforestation during the period 2010-2014.
Credit: Florence Pendrill, Chalmers University of Technology
…
La géologie, une science plus que passionnante … et diverse
