Bjorn Lomborg Fighting Australia’s Fire Myths

by P. Homewood, January 29, 2020 in NotaLotofPeopleKnowThat


https://www.facebook.com/bjornlomborg/photos/a.221758208967/10158703983303968/?type=3&theater
As he points out in the article:

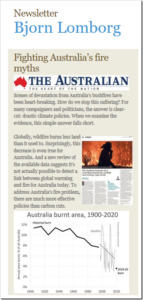
Australia is the world’s most fire-prone continent. In 1900, 11 per cent of its surface burned annually. These days, 5 per cent of the country burns every year. By the end of the century, if we do not stop climate change, higher temperatures and an increase in aridity will likely mean a 0.7 percentage point increase in burnt area, an increase from 5.3 per cent of Australia to 6 per cent.

Unfortunately, many reports on Australia’s fires have exploited the carnage to push a specific agenda, resting on three ideas: that bushfires are worse than ever, that this is caused by global warming, and that the only solution is for political leaders to make even bigger carbon-cut promises.

Globally, bushfires burn less land than it used to. Since 1900, global burnt area has reduced by more than one-third because of agriculture, fire suppression and forest management. In the satellite era, NASA and other groups document significant decreases.

Surprisingly, this decrease is even true for Australia. Satellites show that from 1997 to 2018 the burnt area declined by one-third. Australia’s current fire season has seen less area burned than in previous years. Up to January 26, bushfires burned 19.4 million hectares in Australia — about half the average burn over the similar timeframe of 37 million hectares in the satellite record. (Actually the satellites show 46 million hectares burnt, but 9 million hectares are likely from prescribed burns.)

When the media suggests Australia’s fires are “unprecedented in scale”, it is wrong. Australia’s burnt area declined by more than a third from 1900 to 2000, and has declined across the satellite period. This fire season, at the time of writing, 2.5 per cent of Australia’s area has burned compared with the past 10 years’ 4.8 per cent average by this point.

What is different this year is that fires have been mostly in NSW and Victoria. These are important states with a little more than half the country’s population — and many of its media outlets.

But suggesting fires are caused by global warming rests on cherrypicking these two regions with more fire and ignoring the remaining 87 per cent of Australia’s landmass, where burned area has declined.

I certainly would take issue with the claim aridity will increase, as we know that rainfall has generally been greater since the 1970s than before.

Lomborg goes on to make the points I have made regularly, that there are many practical ways to reduce the risk of severe fires, and that even if Australia went totally net zero, it would have no effect whatsoever on their climate.

Well worth a read though.

The Rise and Fall of Central England Temperatures; Part 3 2000-2019

by Tony Brown, February 15, 2020 in WUWT


This is the third examination of Central England Temperatures (CET) in a series that commenced in 2015 and which has charted the recent decline in temperatures from their highest values. The two previous articles in this series are referenced here;

The Rise and Fall of Central England Temperatures; Part 1 covering 2000 to 2015

https://judithcurry.com/2015/11/25/the-rise-and-fall-of-central-england-temperature/

The Rise and Fall of Central England Temperatures; Part 2 covering 2000 to 2017

https://wattsupwiththat.com/2018/03/04/the-rise-and-fall-of-central-england-temperatures-help-needed-to-find-missing-data/

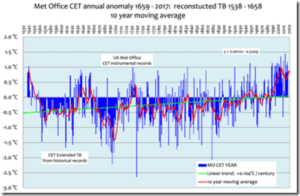
When referencing any ‘decline’ we need to put that into context against CET’s overall substantial rise in recent decades. The official CET dataset used in this article, which is compiled by the UK Met office is linked here and shown in Figure A);

https://www.metoffice.gov.uk/hadobs/hadcet/

It should be noted that the values between 1538 and 1658 are my own reconstruction and are not used at all in this current paper.

Note: Weather comprises the day to day events that we all experience. Climate is officially the trend of the weather (often temperature and rainfall) taken over a continuous thirty year period. The two terms have sometimes been used in an interchangeable manner here, when a period of more than a year is being examined.

Figure A

According to the Met office; ‘Since 1974 the data have been adjusted to allow for urban warming: currently a correction of -0.2 °C is applied to mean temperatures.’

Greta’s, The Guardian’s Latest Panic Attack Over Antarctica Record Ignores Cooling Trends Of Recent Decades

by P. Gosselin, February 15, 2020 in NoTricksZone


In her latest panic attack, teenage Swedish climate activist Greta Thunberg – citing the Guardian –  once again appeared to be proclaiming the end of the world was a step closer when she tweeted Antarctica has set a new record high temperature:


Two new warm records

According to the Guardian, “The 20.75C logged by Brazilian scientists at Seymour Island on 9 February was almost a full degree higher than the previous record of 19.8C, taken on Signy Island in January 1982.”

That reading, the Guardian reports, follows the February 6 record of 18.3C recorded at the Argentinian research station, Esperanza measured.

As is the case with most alarmists, every warm single datapoint anomaly gets uncritically accepted with open arms as solid evidence of man-made global warming while cold trends get dismissed or downgraded as “natural variability”.

Seymour Island has been cooling for over a quarter century

So we have two recent warm records set at and near the Antarctic peninsula over the past week or so and that means the region there is heating up, alarmists like Greta and the Guardian want us to believe. But what are the real TRENDS there? Do the 2 recent warm records mean the region is heating up.

Looking at official data from NASA, it turns out that warming isn’t true. And because climate is always changing, the temperature in the region in question has also not remained completely steady. The only possibility left? COOLING.

Also here

Physics Professor: CO2’s 0.5°C Impact After Rising To 700 ppm Is So Negligible It’s ‘Effectively Unmeasurable’

by P. Stallinga, February 13, 2020 in NoTricksZone


Dr. Peter Stallinga has published a comprehensive analysis of the Earth’s greenhouse effect. He finds an inconsequential role for CO2.

Doubling CO2 from 350 to 700 ppm yields a warming of less than 0.5°C (500 mK).

Feedbacks to warming are likely negative, as adding CO2 may only serve to speed up natural return-to-equilibrium processes.

As for absorption-reemission perturbation from CO2, “there is nothing CO2 would add to the current heat balance in the atmosphere.”

A portion of Dr. Stallinga’s paper worth highlighting – which he mentions only in passing – refers to the early history of the Earth’s greenhouse effect paradigm.

K. Ångström receives little attention as a pioneer of the conceptualization that warming and cooling resul from radiative imbalances within a planetary greenhouse effect.

About 120 years ago, Ångström (1900) contradicted the oft-cited Arrhenius (1896) – the atmospheric physicist referred to by proponents of anthropogenic global warming.

Ångström suggested Earth’s greenhouse effect is already saturated in its current (1900) state, and therefore increasing CO2 will have “no effect whatsoever” on climate (Stallinga, 2020).

Ångström’s conclusions were largely ignored.

..