Il faut prolonger la durée de vie des centrales nucléaires belges

by Furfari S. & Mund E., 31 janvier 2020 in ScienceClimatEnergie


Les plus chauds partisans de l’énergie nucléaire sont convaincus que la technologie actuelle des réacteurs à eau légère sous pression (PWR) est loin d’être parfaite. Mais elle dispose d’énormes qualités qui rendent son utilisation indispensable. Au nombre de celles-ci, principalement une absence d’émission de CO2 [1] la sécurité d’approvisionnement au sens où la production d’électricité et de chaleur peut satisfaire la demande à tout instant, hormis bien sûr les périodes de maintenance des installations et les pannes éventuelles, et la rentabilité économique au sens où les importants investissements en capitaux peuvent être amortis en des temps beaucoup plus courts que la durée de vie fonctionnelle de ces installations, etc… Dernière qualité, moins évidente pour les non-initiés : la mise en œuvre de la technologie PWR peut revêtir des formes très variées dont certaines (les SMR, petits réacteurs modulaires) renforcent la sûreté déjà très élevée  du nucléaire actuel, considérée néanmoins comme insuffisante par les opposants.

Over 440 Scientific Papers Published In 2019 Support A Skeptical Position On Climate Alarm

by K. Richard, January 30, 2020 in NoTricksZone


In 2019,  more than 440 scientific papers were published that cast doubt on the position that anthropogenic CO2 emissions function as the climate’s fundamental control knob…or that otherwise serve to question the efficacy of climate models or the related “consensus” positions commonly endorsed by policymakers and mainstream media sources.


CLINTEL Group Blasts Climate Doomsters; There Is No ‘Emergency’

by D. Wojick, Jan 29, 2020 in ClimateChangeDispatch


There is NO climate emergency. Preaching doom and gloom is a crime against the young generation. These are the key points of a new manifesto from the Climate Intelligence Group or CLINTEL.

CLINTEL is a rapidly growing international group, led by prominent scientists, that opposes the ill-founded attempts to scare people into hasty climate policy actions.

They also oppose the terrorizing of children as part of the false climate alarm. CLINTEL recently issued a World Climate Declaration denouncing scaremongering and this new manifesto provides detailed scientific backup for the WCD for a wide public.

The manifesto is authored by Professor Guus Berkhout, the President of CLINTEL.

The focus of the Berkhout manifesto is on climate-related modeling, which it says is “unfit for purpose.” The purpose, in this case, is predicting future climate change. Modeling dominates climate science.

It also provides the scary scenarios that drive hugely expensive and disruptive climate emergency action policies. That the models are faulty is a very important finding.

The manifesto says there are at least four strong reasons why today’s models are no good.

Emissions – the ‘business as usual’ story is misleading

by Z. Hausfather & G. Peters, January 29, 2020 in Nature


Stop using the worst-case scenario for climate warming as the most likely outcome — more-realistic baselines make for better policy.

More than a decade ago, climate scientists and energy modellers made a choice about how to describe the effects of emissions on Earth’s future climate. That choice has had unintended consequences which today are hotly debated. With the Sixth Assessment Report (AR6) from the Intergovernmental Panel on Climate Change (IPCC) moving into its final stages in 2020, there is now a rare opportunity to reboot.


Green Energy: German Electricity Prices Skyrocket To Record Highs

by P. Gosselin & H. Douglas, Jan 27, 2020 in ClimateChangeDispatch


For a long time, electricity prices have known only one direction: upwards! Ever faster, ever more clearly.

Now the shock for many families: The Federal Government has presented official figures in an answer to an inquiry from the FDP Free Democrats parliamentary group in the Bundestag and announced the true extent of the electricity price increase.

320 euros extra annually per household

In the past ten years, the price of electricity for households and industry has risen by a third.

According to the Augsburger Allgemeine, which quotes from the paper, the price of electricity rose by 35 percent between 2009 and 2019.

For a typical household with 4,000 kWh per year, this means 320 euros in additional costs for electricity alone.

This is even more than the various comparison websites had previously calculated.

China Thermal Power Up 2.4% Last Year

by P. Homewood, January 28, 2020 in NotaLotofPeopleKnowThat


Provisional figures from the China Energy Portal indicate that thermal generation continues to rise in China, albeit at a slower rate then the last few years

https://chinaenergyportal.org/en/2019-electricity-other-energy-statistics-preliminary/

As I noted in November, there are three factors behind the slower rise in thermal (which is almost certainly predominantly coal-fired):

  • Overall demand for electricity has increased at a much slower rate in 2019 – 4.7% against 8.4% in 2019. This reflects the dramatic slowdown in Chinese economic growth.
  • New nuclear capacity has been added in the last two years.
  • Better hydro generation, presumably due to wetter weather.

Significantly, thermal generating capacity has continued to grow in 2019, by 4.1%. Just as significant is the dramatic slowdown in new solar power capacity being added. In 2018, 45GW was added, but this dropped to 26GW last year, following the restriction of subsidies.

New wind capacity increased marginally in 2019, from 21GW in 2018 to 25GW.

Also  China’s Coal Power To Remain Dominant Till At Least 2035

Patterns of thinning of Antarctica’s biggest glacier are opposite to previously observed

by University of Bristol, January 27, 2020 in ScienceDaily


Using the latest satellite technology from the European Space Agency (ESA), scientists from the University of Bristol have been tracking patterns of mass loss from Pine Island — Antarctica’s largest glacier.

They found that the pattern of thinning is evolving in complex ways both in space and time with thinning rates now highest along the slow-flow margins of the glacier, while rates in the fast-flowing central trunk have decreased by about a factor of five since 2007. This is the opposite of what was observed prior to 2010.

Pine Island has contributed more to sea level rise over the past four decades than any other glacier in Antarctica, and as a consequence has become one of its most intensively and extensively investigated ice stream systems.

However, different model projections of future mass loss give conflicting results; some suggesting mass loss could dramatically increase over the next few decades, resulting in a rapidly growing contribution to sea level, while others indicate a more moderate response.

Identifying which is the more likely behaviour is important for understanding future sea level rise and how this vulnerable part of Antarctica is going to evolve over the coming decades.

The results of the new study, published in the journal Nature Geoscience, suggest that rapid migration of the grounding line, the place where the grounded ice first meets the ocean, is unlikely over that timescale, without a major change in ocean forcing. Instead, the results support model simulations that imply that the glacier will continue to lose mass but not at much greater rates than present.

Lead author Professor Jonathan Bamber from the University of Bristol’s School of Geographical Sciences, said: “This could seem like a ‘good news story’ but it’s important to remember that we still expect this glacier to continue to lose mass in the future and for that trend to increase over time, just not quite as fast as some model simulations suggested.

“It’s really important to understand why the models are producing different behaviour in the future and to get a better handle on how the glacier will evolve with the benefit of these new observations.

“In our study, we didn’t make projections but with the aid of these new data we can improve model projections for this part of Antarctica.”

DEEP DIVING SCIENTISTS DISCOVER “SODA SPRINGS” — AN UNDERWATER ENVIRONMENT WHERE HIGH CO2 CONCENTRATIONS (UP TO 95,000 PPM) BUBBLE-UP FROM THE OCEAN FLOOR

by Cap Allon, January 27, 2020 in Electroverse


University of Texas at Austin Professor, Bayani Cardenas, has discovered an underwater environment of bubbling carbon dioxide with readings some 200x the concentration of CO2 in the atmosphere.

Cardenas discovered the region –which he calls “Soda Springs”– while studying how groundwater from a nearby island could affect the ocean environment of the Verde Island Passage in the Philippines. The passage is one of the most diverse marine ecosystems in the world and is home to thriving coral reefs.

The amazing bubbling location, which Cardenas captured on video, is not a climate change nightmare, reads part of the press release issued by utexas.edu on Jan 22, 2020. It is instead linked to a nearby volcano that vents out the gases through cracks in the ocean floor, and has probably been doing so for decades or even millennia.

Continuer la lecture de DEEP DIVING SCIENTISTS DISCOVER “SODA SPRINGS” — AN UNDERWATER ENVIRONMENT WHERE HIGH CO2 CONCENTRATIONS (UP TO 95,000 PPM) BUBBLE-UP FROM THE OCEAN FLOOR

World Leading Alps Glaciologist Shows “Today’s Climate, Vegetation And Glacier Situation Nothing Special”

by H.J. Lüdecke & K.E. Puls, January 25, 2020 in NoTricksZone


Prof. Gernot Patzelt is an internationally renowned glaciologist with numerous publications and lectures. Now he has, as it were, presented his life’s work with the book “Gletscher: Klimazeugen von der Eiszeit bis zur Gegenwart“ (Glaciers: Climate Witnesses from the Ice Age to the Present” (Hatje Cantz-Verlag, Berlin, 2019, 266 pages). It combines the overwhelming artistic aesthetics of Alpine glaciers in painting with scientific glaciology.

Gernot Patzelt, Professor of High Altitude Research at the University of Innsbruck and Head of the Alpine Research Centre Obergurgl in Tyrol, was not and is not retired after his retirement in 2004. His lectures, especially those at EIKE climate conferences (here, here) and his writings, which are listed here, bear witness to this. He was also co-author of the book “A. Fischer und G. Patzelt: Gletscher im Wandel: 125 Jahre Gletscher-Meßdienst des Alpenvereins, Springer, 2018″.

His book “Klimazeugen von der Eiszeit bis zur Gegenwart” (Climate Witnesses from the Ice Age to the Present), which is discussed here, breaks new ground by making the otherwise rarely attempted connection between natural aesthetics and scientific description. The Austrian glaciologist  has convincingly succeeded in this attempt, namely the connection of painting history with Ice Age history, glacier history, landscape history, vegetation history, climate history, cultural history … and more!

Jakarta is not an Exemplar of Sea Level Rise

by K. Hansen, January 25, 2020 in WUWT


Ted Nordhaus has an excellent article in the Wall Street Journal titled “Ignore the Fake Climate Debate”.

[  It may or may not be pay-walled for you — if it is, try searching the title in your search engine and use the link provided by Google/Bing/whatever — it may let you in or see here. ]


Jakarta, Indonesia, is not an exemplar of rising sea levels    

 Jakarta is a good proxy for many of the problems that Asian cities are having with sea levels — relative sea levels.   Is Relative Sea Level a problem specific to Asian cities?  No, but it is a common problem to Asian mega-cities as can be seen in this figure:

Negative CO2 Emissions

by Kevin Kilty, January 24, 2020 in WUWT


An article in the January 2020 Issue of Physics Today (1) presents an interesting and very readable overview of methods to capture and store away CO2 emissions. The purpose of this guest blog is to summarize a few key points the paper makes, and add some commentary. WUWT has covered some of this same territory recently here and here.

Motivation

Of course, the motivation for negative emissions technologies (NETs), or CO2 capture, is to bring atmospheric CO2 back to safe levels. Although the article fails to mention what safe means in this context, and what levels are unsafe, it alludes to melting polar ice and methane escaping from melting permafrost as consequences of unsafe climate. Nothing unusual here. Despite relegating its case for an unsafe future to such enterprises as the IPCC, the article does provide some insight into the cause of what seems to be the current “crisis” mentality. It is 1.5°C temperature rise goal of the 2015 Paris agreement. As readers of WUWT already know, this is not a 1.5°C increase from now, but rather from an estimated pre-industrial level — meaning that two-thirds of that margin is already gone and we have but 0.5°C left to work with. I suspect most people do not understand this subtle point.

Eventually the article makes a brief excursion into more phenomena by which climate change would become unsafe — forest fires, droughts, and sea level rise. All of this is also familiar to WUWT readers.


Technologies Involved

Why The Current Interglacial Might Be Coming To An End

by W. Jones, January 22, 2020 in ClimateChangeDispatch


Did you know that over the last 450,000 years there have been four Ice Ages lasting around 100,000 years each?

And five interglacial periods lasting around 12,000 years each?

Look at this graph of temperature data derived from the Vostok ice core from Antarctica.


What it means is that for around 90 percent of the last 450,000 years Earth has been in an Ice Age, where global temperatures have slumped to as low as 10 deg C colder than in the relatively brief interglacial periods.

The current interglacial period (the fifth) began about 11,600 years ago, suggesting it may not last much longer. It corresponds to the time when human beings began farming and building cities and civilizations.

It is notably cooler than the previous four interglacial periods. If we ‘zoom in’ on it (see the upper graph, below)

Des réchauffements répétitifs sans CO2 ?

by P. Berth & A. Préat, 24 janvier 2020 in ScienceClimatEnergie


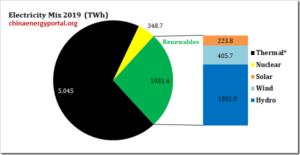
Depuis le début des mesures thermométriques directes, les 4 principales séries de température  que nous possédons (thermomètres terrestres et satellites) nous montrent que la température globale de la basse troposphère a augmenté de ± 0,8°C en 138 ans (entre 1880 et 2018). Cela correspond à ± 0,28°C en 50 ans soit 0,006°C/an(actuellement environ 0,01°C/an pour les 30 dernières années). Les médias nous rappellent chaque jour que cette hausse est exceptionnelle et que le CO2 anthropique en est à l’origine, c’est-à-dire est le grand coupable suivant la terminologie consacrée.

Mais cette vitesse d’augmentation de la température, est-elle vraiment exceptionnelle? Dans les lignes qui suivent, nous allons vous démontrer qu’il n’en est rien. Au cours de la dernière période glaciaire, alors que l’espèce humaine existait déjà, la température moyenne a parfois augmenté à une vitesse vingt fois plus élevée, et ce à de nombreuses reprises. Ces phénomènes particuliers, qui n’ont pas fait disparaître la vie sur Terre, et que nous vous avions déjà mentionnés sur SCE (ici), sont appelés évènements de Dansgaard-Oeschger ou ‘DO’ (des noms des deux scientifiques -danois et suisse-  qui furent les premiers à les mettre en évidence) et sont reconnus par le GIEC. Comme nous allons vous le montrer dans le présent article, le taux de CO2 n’aurait qu’un rôle mineur dans ces évènements.

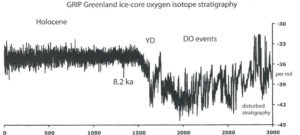
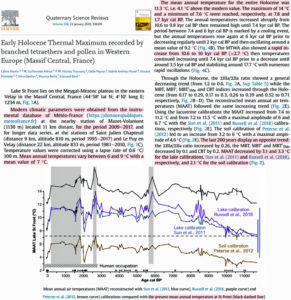
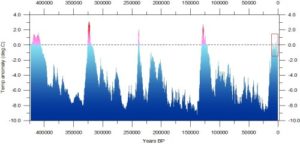
Figure 1. Stratigraphie isotopique de l’oxygène à partir des glaces du forage GRIP (Groenland).
En ordonnée valeurs du δ
18O en ‰ et en abscisse profondeur en mètres du forage (Cronin, 2010). Les compositions isotopiques de l’oxygène sont un indicateur de la température. La figure montre de manière très claire que l’interglaciaire actuel (Holocène, moitié gauche du graphique) est caractérisé par des fluctuations thermiques de faible amplitude (si l’on excepté un épisode plus froid vers 8,2 ka) alors que le Dernier Glaciaire (moitié droite du graphique) montre des changements climatiques fréquents, rapides et de grandes amplitudes (de 8°C à 16°C suivant les δ18O) enregistrés pas les événements ou ‘cycles’ DO (Dansgaard-Oeschger events). Nb: YD pour Younger Dryas, correspondant à un refroidissement il y a 12800 ans BP (non discuté dans cet article).


Extreme Arctic melting has a new suspect: The same powerful gases screwing over the ozone

by B.L. Beckman, January 21, 2020 in Mashable/Nature


They were once abundant, in our hairsprays, bug sprays, and refrigerators. And then scientists figured out these substances ripped a hole in the ozone layer, leading to a 1987 plan to phase them out that over time would be agreed to by every country in the world.

More than three decades later, researchers have made a new discovery.

Ozone-depleting substances do more than just gnaw at Earth’s protective layer. They’re also greenhouse gases, so they contribute to the planet’s overall warming by trapping heat, too. And now we may know just how much these substances have contributed to Arctic warming, thanks to a study published in the science journal Nature on Monday.

Between 1955 and 2005, ozone-depleting gases caused half of Arctic climate change (and a third of overall global warming), the study finds. This is primarily due to their heat-trapping qualities, not their ozone munching. The Arctic has seen rapidly melting sea ice for years and is warming faster than the rest of the world.

HISTORICAL DATA DESTROYS THE GLOBAL WARMING MYTH, AND PEOPLE ARE WAKING TO IT…

by Cap Allon, January 22, 2020 in Electroverse


According to NOAA’s own historical data, of the 50 U.S. state all-time record high temperatures, 23 were set during the 1930s, while 36 occurred prior to 1960 — climate change proponents are feeding us a fairy tale, and I’m sick of it…

The maniacal sociopaths of the world may have won control of the narrative, but they seemingly have little sway over the will of the people. You need only browse the comment section below any “climate change” article or social media post to see the wave of folks resoundingly rejecting the scam-of-a-world-view assembled before them (one of the few positives of SM).

The man-made global warming rejection is likely down to two things: the first being that the so called “scientific consensus” has been failing for far too long — you can’t start warning people in the 1980s that we have 10 years left to save the planet, only to keep repeating that prophecy for the next 4 decades. This is probably the reason our youth have become the new target — kids don’t have this history of failure to draw-upon when browsing the bullet points of the latest IPCC report -for example- meaning they’re far easier to manipulate.


Learning The Lessons From The Waroona Bushfires

by P. Homewood, January 22, 2020 in NotaLotofPeopleKnowThat


It has surely now been established beyond any possible doubt the major role that poor fire hazard management has played in the severity of recent Australian bushfires, despite disinformation campaigns from the BBC/Guardian/Met Office.

Back in 2016, a Special Inquiry was held following the catastrophic Waroona bushfire, just south of Perth that year. Their report not only reemphasised the crucial role of controlled burning, but also gives an insight into the evolution of such practices in recent decades:

Below is the key segment of the report. [The data relates to Western Australia, and P&W refers to the Department of Parks and Wildlife].

North Atlantic Sea Levels Have Been Falling At A Rate Of 7.1 mm/yr Since 2004…In Tandem With 2°C Cooling

by K. Richard/Chafik et al. 2019, January 20, 2020 in NoTricksZone


Rapid cooling in the North Atlantic has reversed regional sea level changes and has apparently spread to the Greenland ice sheet

Image Source: Chafik et al. (2019)

Despite stressing global sea level rise is worrisome and due to anthropogenic warming, Chafik et al. (2019) report a distinct cooling trend in the North Atlantic that coincides with a transition to falling regional sea levels since 2004.

Doomsday Climate Predictions: Wrong Then, Wrong Now

by CFACT, January 20, 2020, in ClimateChangeDispatch


How many doomsday predictions about the Earth’s climate must fail before they finally get broadly ignored and dismissed out of hand?

Considering the track record of climate predictions that turned out to be false, we are well passed the moment of ridicule.

The latest climate prediction fiasco, about glaciers disappearing in Glacier National Park by 2020, is the latest reminder of the falsity of the man-made global warming movement.  It’s 2020; the glaciers remain.

Predictions of climate catastrophe drone on, and get more hysterical, including many from the same people whose credibility was destroyed long ago.

Yet, the climate alarmists remain undaunted and impervious to embarrassment.

Instead, they simply move the goalposts by predicting more planetary weather Armageddon in the future and proposing more insanely expensive solutions to “address” it (notice they rarely promise to reverse assumed man-made warming).

It is not just actors like Ted Danson or Jane Fonda who make absurd climate predictions, but scientists, government bureaucrats and especially politicians continue this longstanding racket.

In the years leading up to the first “Earth Day” in 1970, there were so many climate predictions that ended up being laughably wrong, it’s hard to pick favorites.

Stanford University biologist, Paul Ehrlich, author of The Population Bomb, is perhaps the best-known alarmist of that period.


Continuer la lecture de Doomsday Climate Predictions: Wrong Then, Wrong Now

2019 Science Refutes Climate Alarm On Every Front… Shrinking Deserts, Growing Islands, Crumbling Consensus, Weaker Storms, Cooler Arctic Etc. Etc. Etc.

by P. Gosselin, December 31, 2019 in NoTricksZone


2019 science: Absolutely no climate alarm 

No alarm on every aspect: stable polar ice, normal sea level rise, no consensus, growing snow cover, less tropical storms, tornadoes, shrinking deserts, global greening, predictions wrong, models flawed, climate driven by sun, ocean cycles, biodiversity, warmer 1000 years ago…etc…


2019 saw a great amount of new science emerge showing that there’s nothing alarming or catastrophic about our climate. 

Some 2019 scientific findings

Need to make a presentation showing there is no climate alarm? The following findings we reported on in 2019 will put many concerns to rest.

Hundreds of peer-reviewed papers ignored by media

What follows are some selected top science-based posts we published here at NoTricksZone in 2019. These new findings show there is absolutely no climate alarm.

Hundreds of new peer-reviewed papers, charts, findings, etc – which the IPCC, activists and media ignore and even conceal. No wonder they’ve gotten so shrill.


‘Melting rock’ models predict mechanical origins of earthquakes

by Duke University, January 17, 2019 in ScienceDaily/Nature


Engineers at Duke University have devised a model that can predict the early mechanical behaviors and origins of an earthquake in multiple types of rock. The model provides new insights into unobservable phenomena that take place miles beneath the Earth’s surface under incredible pressures and temperatures, and could help researchers better predict earthquakes — or even, at least theoretically, attempt to stop them.

The results appear online on January 17 in the journal Nature Communications.

“Earthquakes originate along fault lines deep underground where extreme conditions can cause chemical reactions and phase transitions that affect the friction between rocks as they move against one another,” said Hadrien Rattez, a research scientist in civil and environmental engineering at Duke. “Our model is the first that can accurately reproduce how the amount of friction decreases as the speed of the rock slippage increases and all of these mechanical phenomena are unleashed.”

For three decades, researchers have built machines to simulate the conditions of a fault by pushing and twisting two discs of rock against one another. These experiments can reach pressures of up to 1450 pounds per square inch and speeds of one meter per second, which is the fastest underground rocks can travel. For a geological reference point, the Pacific tectonic plate moves at about 0.00000000073 meters per second.

Hadrien Rattez, Manolis Veveakis. Weak phases production and heat generation control fault friction during seismic slip. Nature Communications, 2020; 11 (1) DOI: 10.1038/s41467-019-14252-

Comprehensive Data, Recent Studies In Top Journals: Antarctica Stable, Temps Falling, Ice Mass Growing!

by P. Gosselin, January 14, 2020 in NoTricksZone


The ice in Antarctica, how is it doing? Is it melting, is it growing? In the following we wishto present the latest literature on the subject. There is a lot to report.

Fasten your seat belt, there’s a lot to cover.

Let’s start with the temperature development because along with snowfall, this is the most important control factor for Antarctic inland ice.

At NoTricksZone, Kirye shows ten coastal stations of Antarctica. None have been warming over the past 10 years. An example follows:


And here’s the temperature development of the entire Antarctic according to UAH and RSS satellite measurements (from Climate4You, via NoTricksZone):

NASA: 2020 Will Mark the Lowest Solar Activity in 200 Years

by James Murphy, January 16, 2020 in NewAmerican


With all of the pseudo-scientific propaganda being peddled about anthropogenic climate change, people sometimes forget that there are other, far more important drivers of the Earth’s climate than mankind’s carbon dioxide emissions. For example, that big ball of yellow light in the sky (aka the sun) has a huge effect on climate. And according to NASA, this year will mark the lowest level of solar activity in 200 years.

“Research now underway may have found a reliable new method to predict this solar activity. The Sun’s activity rises and falls in an 11-year cycle. The forecast for the next solar cycle says it will be the weakest of the last 200 years. The maximum of this next cycle — measured in terms of sunspot number, a standard measure of solar activity level — could be 30-50 percent lower than the most recent one. The results show that the next cycle will start in 2020 and reach its maximum in 2025.”

According to a growing number of scientists, the coming lower solar cycle — number 25 — may simply be a precursor to a period of prolonged solar minima such as the Maunder and Spörer minimums of the past millennium.


Major Greenland Glacier Is Growing

by NASA (Earth Observatory), June 6, 2019 in NASA.E.Observ.


Jakobshavn Glacier in western Greenland is notorious for being the world’s fastest-moving glacier. It is also one of the most active, discharging a tremendous amount of ice from the Greenland Ice Sheet into Ilulissat Icefjord and adjacent Disko Bay—with implications for sea level rise. The image above, acquired on June 6, 2019, by the Operational Land Imager (OLI) on Landsat 8, shows a natural-color view of the glacier.

Jakobshavn has spent decades in retreat—that is, until scientists observed an unexpected advance between 2016 and 2017. In addition to growing toward the ocean, the glacier was found to be slowing and thickening. New data collected in March 2019 confirm that the glacier has grown for the third year in a row, and scientists attribute the change to cool ocean waters.

“The third straight year of thickening of Greenland’s biggest glacier supports our conclusion that the ocean is the culprit,” said Josh Willis, an ocean scientist at NASA’s Jet Propulsion Laboratory and principal investigator of the Oceans Melting Greenland (OMG) mission

Gavin’s Falsifiable Science

by Willis Eschenbach, January 18, 2020 in WUWT


Folks are interested in why the temperature of the planet changes over time. That’s at the center of modern climate science. My theory, on the other hand, arose from my being interested in a totally different question about climate—why is the temperature so stable? For example, over the 20th Century, the temperature only varied by ± 0.3°C. In the giant heat engine that is the climate, which is constantly using solar energy to circulate the oceans and the atmosphere, this is a variation of 0.1% … as someone who has dealt with a variety of heat engines, I can tell you that this is amazing stability. The system is ruled by nothing more solid than waves, wind, and water. So my question wasn’t why the climate changes as it does.

My question was, why is the climate so stable?

And my answer is, there are a host of what are called “emergent phenomena” that arise when local temperatures go above some local threshold. They include the timing and strength of the daily emergence of the cumulus cloud field in the tropics; the development of thunderstorms; the emergence of dust devils when temperatures get hot; the action of the El Nino/La Nina pump moving warm water to the poles; and various “oscillations” like the Pacific Decadal Oscillation.

These emergent phenomena arise out of nowhere, last for some length of time, and then disappear completely. And acting together, they all work to prevent both the overcooling and the overheating of the planet. And as mentioned above, I say that these phenomena acted to reduce the length and the depth of the effect of the Pinatubo volcano. See my post called “When Eruptions Don’t” for another look at how the climate system responds to a decrease in incoming solar energy due to volcanic eruptions.


I originally published this theory in the journal Energy and Environment. I followed that up with a posting of the same ideas here at Watts Up With That in a post called The Thermostat Hypothesis.

Figure 2. Global stratospheric temperatures measured from space.