Global Fossil Fuel Emissions Up 0.6% In 2019

by P. Homewood, February 6, 2020 in NotaLotofPeopleKnowThat


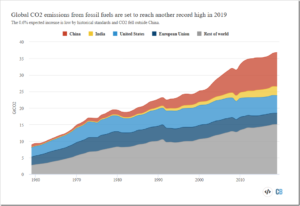
Emissions from fossil fuel and industry (FF&I) are expected to reach 36.81bn tonnes of CO2 (GtCO2) in 2019, up by only 0.24GtCO2 (0.6%) from 2018 levels, according to the latest estimates from the Global Carbon Project (GCP).

The data is being published in Earth System Science Data Discussions, Environmental Research Letters and Nature Climate Change to coincide with the UN’s COP25 climate summit in Madrid, Spain.

The growth of global emissions in 2019 was almost entirely due to China, which increased its CO2 output by 0.26GtCO2. The rest of the world actually reduced its emissions by -0.02GtCO2, thanks to falling coal use in the US and Europe, as well as much more modest increases in India and the rest of the world, compared to previous years.

The GCP researchers say that “a further rise in emissions in 2020 is likely” as global consumption of natural gas is “surging”, oil use continues to increase and, overall, energy demand rises.

Despite the rapid rise and falling costs of renewables in many parts of the world, the majority of increases in energy demand continue to be met by fossil fuels. For example, gas met around two-fifths of the increase in demand in 2018, against just a quarter coming from renewables.

Overall, human-caused CO2 emissions, including those from FF&I and land use, are projected to increase by 1.3% in 2019. This is driven by a 0.29GtCO2 (5%) increase in land-use emissions – including deforestation –  which is the fastest rate in five years. While land use only represents around 14% of total 2019 emissions, it will contribute more than half the increase in emissions in 2019.

While more modest than in recent years, the increase in emissions in 2019 puts the world even further away from meeting its climate change goals under the Paris Agreement.

Nature Has Been Removing Excess CO2 4X Faster than IPCC Models

by Dr. Roy Spencer, February 5, 2020 in WUWT


Note: What I present below is scarcely believable to me. I have looked for an error in my analysis, but cannot find one. Nevertheless, extraordinary claims require extraordinary evidence, so let the following be an introduction to a potential issue with current carbon cycle models that might well be easily resolved by others with more experience and insight than I possess.

Summary

Sixty years of Mauna Loa CO2 data compared to yearly estimates of anthropogenic CO2 emissions shows that Mother Nature has been removing 2.3%/year of the “anthropogenic excess” of atmospheric CO2 above a baseline of 295 ppm. When similar calculations are done for the RCP (Representative Concentration Pathway) projections of anthropogenic emissons and CO2 concentrations it is found that the carbon cycle models those projections are based upon remove excess CO2 at only 1/4th the observed rate. If these results are anywhere near accurate, the future RCP projections of CO2, as well as the resulting climate model projection of resulting warming, are probably biased high.


Introduction

My previous post from a few days ago showed the performance of a simple CO2 budget model that, when forced with estimates of yearly anthropogenic emissions, very closely matches the yearly average Mauna Loa CO2 observations during 1959-2019. I assume that a comparable level of agreement is a necessary condition of any model that is relied upon to predict future levels of atmospheric CO2 if it is have any hope of making useful predictions of climate change.

In that post I forced the model with EIA projections of future emissions (0.6%/yr growth until 2050) and compared it to the RCP (Representative Concentration Pathway) scenarios used for forcing the IPCC climate models. I concluded that we might never reach a doubling of atmospheric CO2 (2XCO2).

But what I did not address was the relative influence on those results of (1) assumed future anthropogenic CO2 emissions versus (2) how fast nature removes excess CO2 from the atmosphere. Most critiques of the RCP scenarios address the former, but not the latter. Both are needed to produce an RCP scenario.

I implied that the RCP scenarios from models did not remove CO2 fast enough, but I did not actually demonstrate it. That is the subject of this short article.

What Should the Atmospheric CO2 Removal Rate be Compared To?

Continuer la lecture de Nature Has Been Removing Excess CO2 4X Faster than IPCC Models

The Insignificance of Greenland’s Ice Mass Loss in Five Easy Charts…

by David Middleton, February 5, 2020 in WUWT


This is a sort of a spin-off of Rutgers University Global Snow Lab and “the Snows of Yesteryear” and A Geological Perspective of the Greenland Ice Sheet. And, yes, there are a lot more than five charts in this post… And, none of them were all that easy.

Introduction

There is a general scientific consensus that the Greenland Ice Sheet (GrIS) has been losing ice mass since the Little Ice Age (LIA). This should come as no surprise, since the LIA was quite likely the coldest climatic episode of the Holocene Epoch. Although it does appear that the GrIS may have gained ice mass during the mid-20th century global cooling crisis.

According to Mouginot et al, 2019, the GrIS was gaining an average of +47 ± 21 Gt/y from 1972–1980, then began to lose ice mass after 1980:

  • -51 ± 17 Gt/y from 1980–1990

  • -41 ± 17 Gt/y from 1990–2000

  • -187 ± 17 Gt/y from 2000–2010

  • -286 ± 20 Gt/y from 2010–2018


Figure 4. Central Greenland temperature reconstruction (Alley, 2000).