World’s Largest Meteorite

by Geology Page, January 8, 2017


Name: Hoba “This is an OFFICIAL meteorite name”
Abbreviation: There is no official abbreviation for this meteorite.
Observed fall: No
Year found: 1920
Country: Namibia
Mass: 60 tons

The Hoba or Hoba West meteorite lies on the farm “Hoba West”, not far from Grootfontein, in the Otjozondjupa Region of Namibia. It has been uncovered but, because of its large mass, has never been moved from where it fell. The main mass is estimated at more than 60 tons, making it the largest known meteorite (as a single piece) and the most massive naturally occurring piece of iron known on Earth’s surface.

Impact

The Hoba meteorite impact is thought to have occurred more recently than 80,000 years ago. It is inferred that the Earth’s atmosphere slowed the object to the point that it impacted the surface at terminal velocity, thereby remaining intact and causing little excavation.

Assuming a drag coefficient of about 1.3, the meteor would have been slowed to about 720 miles per hour (0.32 km/s) from its speed on entering the Earth’s atmosphere, typically in excess of 10 km/s for similar objects. The meteorite is unusual in that it is flat on both major surfaces, possibly causing it to have skipped across the top of the atmosphere like a flat stone skipping on water.

Read more : http://www.geologypage.com/2017/01/worlds-largest-meteorite.html#ixzz6U2Q7UUR8
Follow us: @geologypage on Twitter | geologypage on Facebook

First Time In 70 Years No Pacific Typhoon Forms In July… Alarmists Alarmed Typhoon Trend Falling!

by P. Gosselin, Ausgust 1, 2020 in NoTricksZone


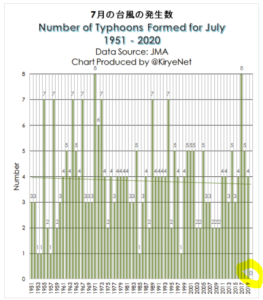
This year is the first time since 1951 the Pacific sees no typhoons in the month of July. Typhoons have seen downward trend since 1951. 

Global warming alarmists like to claim that tropical storms will intensify and become more frequent unless people stop using fossil fuels.

And recently these alarmists have had our attention steered to the Atlantic basin, where tropical storms this year have seen quite an active season thus far.

Another reason the focus has been on the Atlantic is because very little has been happening in terms of Pacific typhoons, and the alarmists don’t want to talk about that.

In fact this July is the first July to have seen no typhoons formed in the Pacific at all since statistics on this began in 1951, according to the data from the Japan Meteorological Agency (JMA).

Data source: JMA, here and here

Normally between 3 to 4 typhoons form in the Pacific in July. Up to 8 have formed in the past, e.g. on 2017 and 1971. But this year July failed to see a single typhoon form – the first time this has occurred since 1951.

Satellite survey shows California’s sinking coastal hotspots

by Arizona State University, August 2, 2020 in WUWT


A majority of the world population lives on low lying lands near the sea, some of which are predicted to submerge by the end of the 21st century due to rising sea levels.

The most relevant quantity for assessing the impacts of sea-level change on these communities is the relative sea-level rise – the elevation change between the Earth’s surface height and sea surface height. For an observer standing on the coastland, relative sea-level rise is the net change in the sea level, which also includes the rise and fall of the land beneath observer’s feet.

Now, using precise measurements from state-of-the-art satellite-based interferometric synthetic aperture radar (InSAR) that can detect the land surface rise and fall with millimeter accuracy, an Arizona State University research team has, for the first time, tracked the entire California coast’s vertical land motion.

They’ve identified local hotspots of the sinking coast, in the cities of San Diego, Los Angeles, Santa Cruz and San Francisco, with a combined population of 4 to 8 million people exposed to rapid land subsidence, who will be at a higher flooding risk during the decades ahead of projected sea-level rise.

“We have ushered in a new era of coastal mapping at greater than 1,000 fold higher detail and resolution than ever before,” said Manoochehr Shirzaei, who is the principal investigator of the NASA-funded project. “The unprecedented detail and submillimeter accuracy resolved in our vertical land motion dataset can transform the understanding of natural and anthropogenic changes in relative sea-level and associated hazards.”

The results were published in this week’s issue of Science Advances (DOI link here).

NASA “CLIMATE PROPHET” JAMES HANSEN SAID THE ARCTIC WOULD BE “FREE OF SUMMER ICE” BY 2018

by Cap Allon, August 2, 2020 in Electroverse


Bolstered by the sycophantic-praise he received following his 1988 Congressional testimony on man-made global warming, NASA climate scientist/activist James Edward Hansen continued his prophesies well into the 2000s–despite his ever-growing list of climate fails.

“The greenhouse effect is here,” pronounced doomsayer Hansen back on June 23, 1988.

“We’re [still] toast,” he repeated with a straight face 20 years later, in 2008.

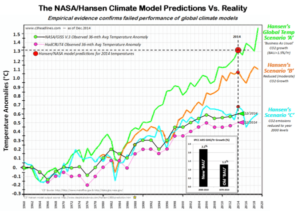
in preparation for his 1988 Congressional testimony, scientists/activist Hansen produced three potential scenarios regarding the future trend for global average temperatures:

A) “Business As Usual” — if human’s did nothing regarding rising CO2 levels.

B) If we “moderately” reduced CO2 emissions.

C) If atmospheric carbon dioxide was reduced to year 2000 levels.


Real-world observations reveal Hansen’s projections were way off. Scenarios A and Bsignificantly over-predict the warming trend. And digging into the data, A overstates CO2 and other greenhouse gas growth and rejects against the observations; Scenario B slightly understates CO2 growth, overstates methane and CFCs and zeroes-out other greenhouse gas growth, and it too significantly overstates the warming.

The scenario that best-matches the observations is C — the one where Hansen has CO2 topping-out at 368 ppm in 2000 but then sees it fixed at that level thereafter–something that obviously didn’t happen. It’s this drastic “halt the industrial revolution” scenario that ended up with a warming trend most like the real-world observations.

Here is one thought, proposed by climate scientist John Christy:

Suppose Hansen had offered a Scenario D, in which greenhouse gases continue to rise, but after the 1990s they have very little effect on the climate. That would play out similarly in his modeled Scenario C, and it would match the data — this hypothetical Scenario D is the reality we’re living today.

James Edward Hansen is still considered a “climate prophet” by many, but his 1988 scenarios simply DO NOT FIT THE DATA–speaking of which, let’s look at his Arctic sea ice predictions.