Data From 2 Independent Studies Show No Correlation Between CO2 And Temperature

by P. Gosselin, July 29, 2020 in NoTricksZone


German climatologist Professor Dr. Horst-Joachim Lüdecke recently took data from two independent studies and superimposed them. The result shows  the long claimed atmospheric CO2-global temperature correlation doesn’t exist. 

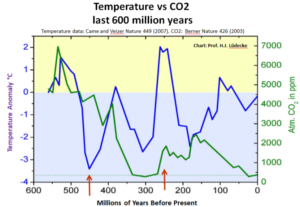
The first data set was global temperature anomaly going back 600 million years, taken from the results of a paper by Came and Veizer, appearing in Nature (2007) and plotted below (blue):

The second data set was of atmospheric CO2 going back 600 million years, taken from a published study by Berner (2003), also appearing in Nature. These data are plotted in the above chart in blue.

No correlation

The plots were combined in the above chart to see how well they correlated, if at all. The result: no correlation.

For example, as the chart shows, 150 million years ago the atmospheric CO2 concentration was over 2000 ppm, which is 5 times today’s atmospheric concentration of 410 ppm – a level that some climate scientists say is already “dangerously high”. Yet, the global temperature 150 million years ago was more than 2°C below the long-term mean.

450 million years ago the relationship was even far more on its head: atmospheric CO2 concentrations were more than 10 times today’s level, yet the global temperature was a frigid 3.5°C below the mean!

“There’s no correlation between earth temperature and CO2,” Prof. Lüdecke concludes, observing recorded data.

EARTH’S ATMOSPHERE HAS NO “WALLS” OR “LID” — GREENHOUSE GAS THEORY IS BOTH MATHEMATICALLY AND PHYSICALLY WRONG

by Cap Allon, July 30, 2020 in Electroverse


“The CO2 greenhouse effect of the Earth’s atmosphere is a pure fiction of people who like to use large computers, without physical bases.” — Gerhard Gerlich ph.D.

Over the years, scientific paper after scientific paper has contended the entire foundation of the man-made global-warming theory is wrong. However, those in control of the agenda selectively choose which papers/theories the public can hear about, and, in turn, which get swept under the rug.

One such paper the ill-informed street-sheep have likely never heard of is that published in the journal “Environment Pollution and Climate Change” back in 2017–the “door-opener to a new paradigm,” former IPCC reviewer Nils-Axel Mörner is quoted as calling it (Mörner left the UN after realizing it was not truly interested in science).

New Insights on the Physical Nature of the Atmospheric Greenhouse Effect Deduced from an Empirical Planetary Temperature Model” argues that concentrations of CO2 and other supposed “greenhouse gases” in the atmosphere have virtually no effect on the earth’s temperature — it concludes the entire greenhouse gas theory is incorrect.

As reported by wnd.com, the prevailing theory on the earth’s temperature is that heat from the Sun enters the atmosphere, and then greenhouse gases such as CO2, methane, and water vapor trap part of that energy by preventing it from escaping back into space.

That theory, which underpins the anthropogenic global-warming hypothesis and the climate models used by the United Nations, was first proposed and developed in the 19th century.

New evidence that an extraterrestrial collision 12,800 years ago triggered an abrupt climate change for Earth

by C. Rotter, July 27, 2020 in WUWT


Christopher R. Moore, University of South Carolina

What kicked off the Earth’s rapid cooling 12,800 years ago?

In the space of just a couple of years, average temperatures abruptly dropped, resulting in temperatures as much as 14 degrees Fahrenheit cooler in some regions of the Northern Hemisphere. If a drop like that happened today, it would mean the average temperature of Miami Beach would quickly change to that of current Montreal, Canada. Layers of ice in Greenland show that this cool period in the Northern Hemisphere lasted about 1,400 years.

This climate event, called the Younger Dryas by scientists, marked the beginning of a decline in ice-age megafauna, such as mammoth and mastodon, eventually leading to extinction of more than 35 genera of animals across North America. Although disputed, some research suggests that Younger Dryas environmental changes led to a population decline among the Native Americans known for their distinctive Clovis spear points.

A collision from space would leave its mark on Earth. Vadim Sadovski/Shutterstock.com

What would an Earth impact leave behind?

Peter Ridd loses, we all lose

by J. Marohasy, July 23, 2020 in TheSpectator


On 2 May 2018, Professor Peter Ridd was sacked by James Cook University for serious misconduct. It all started when he called-out his colleague Terry Hughes for falsely claiming healthy inshore coral reefs were dead from climate change and deteriorating water quality.

Ignoring the first censure in April 2016, Professor Ridd went on television in August 2017 and explained in an interview with Alan Jones and Peta Credlin why so much said and written about the Great Barrier Reef, including by scientists at the Australian Institution of Marine Science, is ‘untrustworthy’.

The interview was to promote a book that I edited, Climate Change: The Facts 2017. The book, published by the Institute of Public Affairs, begins with a chapter about the Great Barrier Reef in which the orthodoxy on Great Barrier Reef science is challenged, in particular reporting on coral calcification rates. In that interview – that contributed directly to Peter Ridd’s sacking – the main argument was, and continues to be, for better quality assurance of coral reef science.

It is a fact that the Australian Institute of Marine Science refuses to release 15 years of coral growth data – because it contradicts the claims of high-profile activists that coral growth rates are in decline. They are not. But the false claims are central to their fundraising strategy. Never mind the truth.

Also: from GWPF, July 27 2020

Climate Hysteria Has Killed Academic Freedom

Censorship Universities May Not Receive Bail Out Funding

Greenpeace Cofounder: ‘There Is No Climate Catastrophe – It’s A Lie’

by 21Wire, July 24, 2020 in ClimateChangeDispatch


Power Hour host Alex Epstein  discusses the alleged ‘climate catastrophe’ with Dr. Patrick Moore, ecologist and co-founder of Greenpeace. 

Incredibly, Moore completely eviscerates the concept of “climate catastrophism,” and dismantles the claim that man-made CO2 levels are warming the planet beyond a tipping point of human survival.

Moore makes a number of strong arguments that debunk the IPCC’s increasingly problematic pseudo-scientific and anti-human narrative which is being parroted by climate change activists and the likes of Greta Thunberg.

He explains:

  • Why Moore left Greenpeace.

  • The beginnings of the climate catastrophe movement.

  • Why Moore believes human beings would not only survive but survive better at far higher average temperatures (which would be concentrated toward the poles).

  • Why Moore believes that contrary to being in a Sixth Extinction, we are actually at an unprecedented time of biodiversity with no end in sight.

  • Why Moore believes “ocean acidification” claims are totally meritless.

  • The commonality among the opposition to plastics, GMOs, nuclear energy, and fossil fuels.

  • Moore’s unrefuted theory that human beings actually saved life on Earth from a terminal decline in CO2 levels.

Watch this highly informative interview:

Modern Ancient Temperatures

by W. Eschenbach, July 24, 2020 in WUWT


OK, no need to torture me, I confess it—I’m a data junkie.

And when I see a new (to me at least) high-resolution dataset, my knees get weak. Case in point? The temperature dataset of the Colle Gnifetti ice core. It has a two-year resolution thanks to some new techniques. Better, it stretches clear back to the year 800. And best, it extends up to near the present, 2006. This lets us compare it to modern datasets. The analysis of the ice core dataset is described in Temperature and mineral dust variability recorded in two low-accumulation Alpine ice cores over the last millennium by Pascal Bohleber et al.

Let me start with where Colle Gnifetti is located. Unusual among ice core records, it’s from Europe, specifically in the Alps on the border of Switzerland and Italy.

Figure 1. Location of the ice cores in the study.

This is good because some of the longest thermometer-based temperature records are in Europe.

One interesting thing about the site is that usually, ice core drilling occurs at the literal ends of the earth, in Antarctica and Greenland and the like. But this site is not far from the foot of the Margherita Hut, which is at over 4500 metres elevation.


Further Reading: It’s instructive to compare the listed temperatures with the data in A Chronological Listing of Early Weather Events.

Settled Science? New Climate Study Shifts the Goalposts to 2.6-3.9C

by Eric Worall, July 24, 2020 in WUWT


A new climate study has dismissed utterly implausible high end climate models. But the new study also seeks to raise the low end of the range of estimated climate sensitivity into the discomfort zone.

The treatment of cloud feedback is interesting. The study acknowledges large cloud feedback uncertainties, mentions the Lindzen et al. (2001) “iris effect”, and admits GCMs cannot be trusted to reproduce observed cloud response, yet still appears to attempt to derive a cloud feedback factor based on satellite observations, and mix this observational cloud factor with model predictions.

The treatment of clouds may turn out to be one of the most controversial assumptions in the study – as Pat Frank has pointed out on a number of occasions, the magnitude of model cloud response error is significantly greater than the CO2 driven warming which models attempt to project, which calls into question whether climate models have any predictive skill whatsoever.

To the author’s credit they have described their method in great detail, so I’m looking forward to detailed responses to this study.

Persistent warm Mediterranean surface waters during the Roman period

by Margaritelli G. et al., June20, 2020 in Nature OPEN ACESS


Abstract

Reconstruction of last millennia Sea Surface Temperature (SST) evolution is challenging due to the difficulty retrieving good resolution marine records and to the several uncertainties in the available proxy tools. In this regard, the Roman Period (1 CE to 500 CE) was particularly relevant in the socio-cultural development of the Mediterranean region while its climatic characteristics remain uncertain. Here we present a new SST reconstruction from the Sicily Channel based in Mg/Ca ratios measured on the planktonic foraminifer Globigerinoides ruber. This new record is framed in the context of other previously published Mediterranean SST records from the Alboran Sea, Minorca Basin and Aegean Sea and also compared to a north Hemisphere temperature reconstruction. The most solid image that emerges of this trans-Mediterranean comparison is the persistent regional occurrence of a distinct warm phase during the Roman Period. This record comparison consistently shows the Roman as the warmest period of the last 2 kyr, about 2 °C warmer than average values for the late centuries for the Sicily and Western Mediterranean regions. After the Roman Period a general cooling trend developed in the region with several minor oscillations. We hypothesis the potential link between this Roman Climatic Optimum and the expansion and subsequent decline of the Roman Empire.

See also  Roman Warm Period Was 3.6°F Warmer Than Today, New Study Shows

 See also here (GWPF)

Giant waves of sand are moving on Mars

by K. Kornei, July 23, 2020 in ScienceAAAS


Researchers have spotted large waves of martian sand migrating for the first time. The discovery dispels the long-held belief that these “megaripples” haven’t moved since they formed hundreds of thousands of years ago. They’re also evidence of stronger-than-expected winds on the Red Planet.

It’s pretty staggering that humans can detect these changes on Mars, says Ralph Lorenz, a planetary scientist at the Johns Hopkins University Applied Physics Laboratory who was not involved in the research. “We can now measure processes on the surface of another planet that are just a couple times faster than our hair grows.”

Megaripples are found in deserts on Earth, often between dunes. Waves in the sand spaced up to tens of meters apart, they’re a larger version of ripples that undulate every 10 centimeters or so on many sand dunes.

The researchers focused on two sites near the equator of Mars. They analyzed roughly 1100 megaripples in McLaughlin crater and 300 in the Nili Fossae region. They looked for signs of movement by comparing time-lapse images of each site—taken 7.6 and 9.4 years apart, respectively. Megaripples in both regions advanced by about 10 centimeters per year, the team reports in the Journal of Geophysical Research: Planets. That’s about how fast megaripples move in the Lut Desert of Iran.

It’s a surprise that megaripples move at all on Mars, says Jim Zimbelman, a planetary geologist at the Smithsonian Institution’s Air and Space Museum. Just a few decades ago, there was no evidence that sands on Mars were mobile, he says. “None of us thought that the winds were strong enough.”

Megaripples near a sand dune on Mars.

NASA/JPL/UNIVERSITY OF ARIZONA

China’s Pandemic Recovery Drives Massive Boom In Coal Plants

by H. Pearl, July 22, 2020 in ClimateChangeDispatch


China is in the midst of a new coal boom, as approvals for coal-energy projects have accelerated this year in response to the coronavirus outbreak.

Far from treating the coronavirus pandemic as a once-in-a-lifetime opportunity to speed up decarbonization and lock in climate goals, there are signs China is falling back on its old playbook of pumping cheap credit into fossil-fuel-heavy energy projects to help the economy recover from a historic first-quarter contraction.

Following a dramatic plunge in energy consumption and greenhouse gas emissions at the start of the year, China’s energy sector is roaring back to life.

Daily consumption of coal, oil, and gas in June was on par with the previous year, according to the government, and analysts say carbon emissions have bounced back to pre-coronavirus levels.

It may still be too early to say where energy use and emissions are heading in 2020, but the environmental detox that followed months of sweeping lockdowns appears to be over.

China has 249.6 gigawatts of coal-fired power capacity either under construction or in planning, according to Global Energy Monitor and the Centre for Research on Energy and Clean Air – which is larger than the current coal fleets of the United States or India.


Continuer la lecture de China’s Pandemic Recovery Drives Massive Boom In Coal Plants

Latest Polar Bear Scare Shredded By Susan Crockford

by P. Homewood, July 22, 2020 in NotaLotofPeopleKnowThat


Apparently, a prediction that polar bears could be nearly extinct by 2100 (which was first suggested back in 2007) is news today because there is a new model. As for all previous models, this prediction of future polar bear devastation depends on using the so-called ‘business as usual’ RCP8.5 climate scenario, which has been roundly criticized in recent years as totally implausible, which even the BBC has mentioned. This new model, published today as a pay-walled paper in Nature Climate Change, also did something I warned against in my last post: it uses polar bear data collected up to 2009 only from Western Hudson Bay – which is an outlier in many respects – to predict the response of bears worldwide. The lead author, Peter Molnar, is a former student of vocal polar bear catastrophist Andrew Derocher – who himself learned his trade from the king of polar bear calamity forecasts, Ian Stirling. Steven Amstrup, another co-author of this paper, provided the ‘expert opinion’ for the failed USGS polar bear extinction model featured in my book, The Polar Bear Catastrophe That Never Happened.

Well, these authors and their supporters got the headlines they crave, including coverage by outlets like the BBC and New York Times (see below) but I have to say that the combination of using out-of-date Western Hudson Bay information on when polar bears come ashore in summer and leave for the ice in fall (only to 2009) to make vague projections (‘possible’, ‘likely’, ‘very likely’) about all other subpopulations in addition to depending on the most extreme and now discredited RCP8.5 climate scenario (Hausfather and Peters 2020) for this newest polar bear survival model is all that’s needed to dismiss it as exaggerated-fear-mongering-by-proxy. Why would anyone believe that the output of this new model describes a plausible future for polar bears?

Meanwhile, polar bear populations worldwide continue to thrive despite declines in sea ice. And as I have pointed out on numerous occasions, the ice free period for WH has not continued to decline since 1998 but rather has remained stable (with yearly variation) at about 3 weeks longer than it was in the 1980s (Castro de la Guardia et al 2017). Moreover, for the last five years at least, including this one, the ice-free season for WH bears has been better (only 1-2 weeks longer than the 1980s), although no official data on this phenomenon has yet been published. Oddly, this more recent data for Hudson Bay was not used for the Molnar model.


Susan’s full account is here.

The Dutch have decided: Burning biomass is not sustainable

by D. Janssen, July 21, 2020 in Euractiv


The Netherlands should phase out the use of biomass for generating electricity as soon as possible, the advisory board of the Dutch government said in a report presented earlier this month.

Biomass is an “indispensable” resource for the circular economy, but burning it is wasteful.

That is the main message of the report issued on 8 July by the Socio-Economic Council (SER), an independent advisory board of the Dutch government consisting of entrepreneurs, employees and independent experts.

In the chemical industry, the building sector and agriculture, biological materials are crucial for the transition to a circular economy, the council writes. But sustainably produced biomass is too scarce to keep using it for the production of heat or electricity, for which other low-carbon and renewable alternatives exist, the report states.

Accordingly, the billions worth of subsidies that were intended for biomass combustion plants should be phased out as well, the advisors say, calling however for measures to preserve “investment security” when designing a phase-out plan.

This means compensation should be handed out to companies who stand to lose out from the abrupt end of bioenergy subsidies.

EU member states are increasingly turning their coal plants into biomass plants in an effort to cut carbon emissions. [Mizzou CAFNR / Flickr]

How climate change alarmists are actually endangering the planet

by Bjorn Lomborg, July 11, 2020 in CO2Coalition


“You’ll die of old age, I’ll die of climate change,” reads a typical poster held by teenagers in climate rallies across the world. The media, activists and even politicians are unabashedly indulging in climate alarmism, stoking the fears of millions.

Books on the impending implosion of civilization due to climate change line shelves in bookstores across the world. Media outlets have changed the name of climate change, calling it the “climate emergency” or even “climate breakdown.” The cover of Time magazine tells us: “Be worried. Be very worried.”

Unsurprisingly, this causes most of us to brood about a future that we’re being told will be calamitous. Children are growing up terrified, with six in ten American teenagers now afraid of climate change. The scaremongering has reached such a crescendo that now half the world’s population really believes climate change will likely end the human race.

This alarmism is not only false but morally unjust. It leads us to make poor decisions based on fear, when the world not only has gotten better, but will be even better over the century.

Remember that the world today is much better in almost every measurable way. In 1900, the average life expectancy was 32. Today, it has more than doubled to 72. The disparity in health between the rich and poor has reduced, the world is much more literate, child labor has been dropping and we are living in one of the most peaceful times in history. Indoor air pollution, previously the biggest environmental killer, has halved since 1990. Four out of five people were extremely poor in 1900 and today — despite the intense impact of the coronavirus — less than one in five is.

The UN Climate Panel’s middle-of-the-road estimate for the end of the century is that we will be even better off. There will be virtually no one left in extreme poverty, everyone will be much better educated, and the average income per person in the world will be 450 percent of what it is today. Yet, because climate is a real challenge, it will leave us less well off. Based on three decades of studies, the UN and the world’s only Nobel climate economist estimate global warming will reduce the 21st century welfare increase from 450 percent to “only” 434 percent of today’s income.


Continuer la lecture de How climate change alarmists are actually endangering the planet

A new forecast says the world’s population will peak at 9.7bn in 2064

by The Economist, July 17, 2020


THE WORLD’S population may never grow as large as many had previously assumed. In a new paper, researchers at the Institute of Health Metrics and Evaluation at the University of Washington project that the global population will top out in 2064 and then fall steadily. Current estimates by the UN’s Population Division reckon it will continue to grow until at least 2100. As a result, the IHME estimates a total population of 8.9bn in 2100; the UN places the number at about 10.9bn.

NCEP Analysis: Northern Hemisphere Surface Temperature Falls 1°C Since February

by P. Gosselin, July 18, 2020 in NoTricksZone


Also the Danish Meteorological Institute (DMI) projects a sturdy Arctic sea ice extent for this July, meaning no falling summer ice extent trend since 2007! The climate alarms are being muffled. 

Snowfan here gives us the latest on global mean temperature and Arctic sea ice.

After the year’s low in June 2020, with an anomaly of +0.48°C from the 1981-2010 WMO climate mean, the global 2-meter temperatures (black line) depicted below shows the July 16, 2020 analysis and forecast up to July 23.

Source: here


Source: DMI

A surprising DMI forecast was issued on July 14, 2020 which projects strong growth of Arctic sea ice areas for July 2020. If this expert forecast is correct, it would mean there’s been a strongly positive summer trend since 2007 – instead of the ridiculous Al Gore complete meltdown.

NOAA Bureaucrats Falsely Claim ‘Extraordinary’ Sea Level Rise

by H.S. Burnett, July 18, 2020 in ClimateRealism


The National Oceanic and Atmospheric Administration, which relies on perpetuation of the Climate Delusion to maintain high funding, is falsely claiming there has been “extraordinary” sea level rise since 2000. Fox News and other media outlets are devoting substantial attention to the assertion by NOAA bureaucrats. However, there is simply nothing extraordinary about recent sea level rise.

According to Fox News, NOAA claims “Communities in coastal areas of the U.S. saw record-setting high-tide flooding last year, part of a trend of rising seas … [and an] ‘extraordinary’ rise in high-tide flooding since 2000.”

“Damaging floods that decades ago happened only during a storm now happen more regularly, even without severe weather,” Nicole LeBoeuf, acting assistant administrator for NOAA’s National Ocean Service, told reporters in a conference call.

Even if high-tide flooding has increased in recent years, natural factors are the primary cause.

As detailed in Climate at a Glance: Sea Level Rise: Data shows global sea level has been rising at a relatively steady pace of approximately one foot per century since at least the mid-1800s, which was long before coal power plants and SUVs. Moreover, the United Nations Intergovernmental Panel on Climate Change (IPCC) confirms here has been no significant recent acceleration.

Global sea level has risen approximately 400 feet since the beginning of the end of the most recent ice age—approximately 20,000 years ago. The rate of sea level rise has risen and fallen at various times since then, slowing and increasing on the order of tens, hundreds, and thousands of years over the past 20,000 years. All of that variance had  nothing to do with human activities. Indeed, as NASA reports, sea level always rises between ice ages as ice sheets retreat. During the last interglacial period between ice ages, seas were four to six meters higher than we are experiencing today….

More Proof That Geologic Forces Are Melting Thwaites and Pine Island Glaciers

by J.E. Kamis, July 20, 2020 in ClimateChangeDispatch


As previously explained before, increased melting/ice loss of Antarctica’s Pine Island and Thwaites glaciers is the result of geologically induced heat flow emitted from underlying bedrock “hotspots,” not climate change (Figure 1).

All but a very minor amount of Antarctica’s glacial ice melting occurs in the western portion of this continent. The most rapid and greatest ice mass loss areas are in West Antarctica.

They are positioned directly above geographically extensive and high heat flow geological features. This association is thought to be strong evidence of a cause and effect relationship.

Discussion of evidence supporting the contention that the melting of Pine Island and Thwaites glaciers is the result of bedrock heat flow begins with a review of the regional geology (refer to Figure 1).

The Pluton Rich “hotspot” is a 61,000-thousand-square-mile area that is home to numerous high-heat-flow lava pockets that are bounded and fueled by deep earth reaching faults.

Several detailed research studies document the existence and configuration of this area. This lies along the West Antarctic Rift.

The Mount Erebus Volcanic Complex “Hotspot” is the most geologically active portion of Antarctica. It is a 25,000-square-mile high-heat-flow area, much of which is absent of glacial ice.

The absence of glacial ice across a huge portion of West Antarctica is extremely unusual and exceedingly difficult to explain by invoking global warming.

Figure 1. NASA map of Antarctica’s ice sheet thickness 1992-2017. Greatest ice thickness losses shaded red. The outline of three regional sub-glacial geological Hotspots” are outlined in red (Image by NASA, most labeling by J. Kamis).

Environmental Facts Vs. Environmental ‘Fact-Checkers’

by C Rossiter, July 17, 2020 in ClimateChangeDispatch


Stacey Abrams, who ran for governor of Georgia, and Tom Steyer, who ran for president of the United States, are now trying to run me out of town.

Abrams, Steyer, and the leaders of 17 large environmental lobbies recently asked Facebook to ban a research group that I direct—the CO2 Coalition, made up of 55 climate scientists and energy economists.

The annual budgets of these lobbies total over half a billion dollars, and Steyer alone is worth $1.6 billion.

Their alarmist view of our supposedly impending environmental doom predominates in mainstream media, centering on the impact on the earth of emissions of carbon dioxide—a non-polluting, mild-warming gas, and an important source of plant and plankton food.

By contrast, the CO2 Coalition’s annual budget is half a million dollars. Like all scientists and economists who ask for any proof of the looming apocalypse, we are excluded from the mainstream-media discussion.

You might wonder: how did the Steyer-Abrams crowd even notice us, let alone conclude that we posed a threat to their enforced consensus, which calls for an end to the affordable, reliable energy that powers over 80 percent of the world?

The answer is found in the work of a Silicon Valley computer entrepreneur named Eric Michelman, who became fabulously wealthy creating a modification of the computer mouse.

For more than a decade now, Michelman has devoted his wealth to squelching media debate on climate change—a successful dry run for the cancel culture that we see engulfing many other issues today.

In 2016, Michelman was the founding and lead funder of a group called Climate Feedback, whose purpose is to “fact-check” and label as “false” any and all deviant thoughts about fossil-fueled climate catastrophe.

The group has been certified as an unbiased source on climate issues by the Poynter Institute for Media Studies, which was founded by the Tampa Bay Times and operates the left-leaning PolitiFact.

At some point, Facebook turned its censorship oversight over to the Poynter Institute’s International Fact-Checking Network.

That’s when our organization’s problems started.

In September 2019, a “false” label appeared on Facebook when the Washington Examiner posted an article I had written there with Dr. Patrick Michaels, our senior fellow and a former president of the American Association of State Climatologists.

The op-ed described the poor performance of climate models that had projected alarming increases in future temperatures. The “false” label triggered a wave of censorship from Facebook’s algorithms, blocking reposting and advertising.

Climate Predictions “Worse Than We Thought”

by P.J. Michaels, July 14, 2020 in RealClearEnergy


As the temperature of the eastern U.S. normally reaches its summer maximum around the last week of July, every year at this time we are bombarded with tired “climate change is worse than we thought” (WTWT) stories. These stories take time to produce, from imagination to final copy to editing to publication, so they have usually been submitted well in advance of the summer peak. Hence, orchestrated fear.

For once, I’m in agreement about the WTWT meme, but it’s about the climate models, not the climate itself.

Climate Models: No Warming For 30 Years – Possibly

by Maher et al., May 12, 2020 in GWPF


A new study demonstrates how a prolonged warming pause or even global cooling may happen in coming years despite increasing levels of atmospheric greenhouse gases — caused by natural climatic variability.

Natural climatic variability has always been a topic that contains a lot of unknowns, but it has been rarely explicitly stated just how little we know about it. Such variability has been habitually underplayed as it was “obvious” that the major driver of global temperature was the accumulation of greenhouse gasses in the atmosphere, with natural variability a weaker effect.

But the global temperature data of this century demonstrate that natural variability has dominated in the form of El Ninos. ‘Doesn’t matter’, came the reply, ‘just wait and the signal of greenhouse warming will emerge out of the noise of natural climatic variability.’ How long will we have to wait for that signal? Quite a long time, according to some researchers as more papers acknowledge that natural climatic variability has a major, if not a dominant influence on global temperature trends.

With the usual proviso concerning climatic predictions there seems to be a growing number of research papers suggesting that the global average temperature of at least the next five years will remain largely unchanged. The reason: natural climatic variability.

Only last week the UK Met Office produced figures suggesting that there is only a 1 in 34 chance that the 1.5°C threshold will be exceeded for the next five year period. Now a new paper by climate modellers extends such predictions, suggesting that because of natural variability the average global temperature up to 2049 could remain relatively unchanged – even with the largest increase in greenhouse gas emissions.

Using two types of computer models in a first of its kind study, Nicola Maher of the Max Planck Institute for Meteorology, Hamburg, Germany, and colleagues writing in Environmental Research Letters looked at the 2019-2034 period concluding that,

East European Nations Reject New Climate Targets

by GWPF/Reuters, July 14, 2020


The European Union remains deeply divided over plans to increase its CO2 emissions targets, with East European ministers refusing to commit to bigger cuts.

The EU has agreed to unilaterally cut greenhouse gas emissions by 40% by 2030. This target has been criticised by climate activists who claim that more radical cuts are needed to prevent ‘catastrophic’ climate change.

Responding to this campaign, the European Commission plans to publish an impact assessment of the additional cost of a revised CO2 target to 50% or 55% by 2030. The EU would then need to agree a new target with member states and lawmakers.

According to Reuters, a meeting of environment ministers from the EU’s 27 member states failed to find agree on whether the target should be raised at all.

“Some are sceptical,” German Environment Minister Svenja Schulze said after the meeting.

On Monday, Poland, Slovakia, Bulgaria, Romania, Czech Republic and Hungary wrote to the European Commission, announcing that they will not support a new CO2 target until they have seen the Commission’s economic impact assessment.

Help! A Short History of Climate Alarmism

by GWPF, July 15, 2020


One of the perennial sources of amusement among sceptics is to look back at the crazy things scientists and activists were saying about global warming back in the early days, when the scaremongering first kicked off.

Who can forget, for example, James Hansen’s notorious speculation in 1988 that large chunks of Manhattan would disappear under the rising waters in the first decades after the millennium? Fortunately, being a thick-skinned fellow, the failure of even small chunks of New York to disappear in the last thirty years since seems to have dented his confidence not one jot, and he cheerfully fends of allegations of alarmism, putting them down to the ignorance of the general public.

Or what about climate scientist David Viner at the University of East Anglia who told the Independent 20 years ago – apparently with a straight face – that snowfall was going to become “a very rare and exciting event” and that children “just aren’t going to know what snow is”? That one hasn’t turned out too well either.

Atmospheric CO2 during the Mid-Piacenzian Warm Period and the M2 glaciation

by de la Vega et al., 2020 in Nature OPEN  ACCESS


Abstract

The Piacenzian stage of the Pliocene (2.6 to 3.6 Ma) is the most recent past interval of sustained global warmth with mean global temperatures markedly higher (by ~2–3 °C) than today. Quantifying CO2 levels during the mid-Piacenzian Warm Period (mPWP) provides a means, therefore, to deepen our understanding of Earth System behaviour in a warm climate state. Here we present a new high-resolution record of atmospheric CO2 using the δ11B-pH proxy from 3.35 to 3.15 million years ago (Ma) at a temporal resolution of 1 sample per 3–6 thousand years (kyrs). Our study interval covers both the coolest marine isotope stage of the mPWP, M2 (~3.3 Ma) and the transition into its warmest phase including interglacial KM5c (centered on ~3.205 Ma) which has a similar orbital configuration to present. We find that CO2 ranged from 389+388389−8+38ppm to 331+1311,331−11+13,ppm, with CO2 during the KM5c interglacial being 371+3229371−29+32ppm (at 95% confidence). Our findings corroborate the idea that changes in atmospheric CO2 levels played a distinct role in climate variability during the mPWP. They also facilitate ongoing data-model comparisons and suggest that, at present rates of human emissions, there will be more CO2 in Earth’s atmosphere by 2025 than at any time in at least the last 3.3 million years.

Evolution after Chicxulub asteroid impact: Rapid response of life to end-cretaceous mass

by Geological Society of America, July 14, 2020 in ScienceDaily


The impact event that formed the Chicxulub crater (Yucatán Peninsula, México) caused the extinction of 75% of species on Earth 66 million years ago, including non-avian dinosaurs. One place that did not experience much extinction was the deep, as organisms living in the abyss made it through the mass extinction event with just some changes to community structure.

New evidence from International Ocean Discovery Program (IODP) Expedition 364 of trace fossils of burrowing organisms that lived in the seafloor of the Chicxulub Crater beginning a few years after the impact shows just how quick the recovery of the seafloor ecosystem was, with the establishment of a well-developed tiered community within  approximately 700,000 years after the event.

Siberia on fire – every summer

by Pasi Autio, July 14, 2020 in WUWT


Northern hemisphere summer – the season when forest fires in Siberia are on the loop. And usually every single new article about the Siberian forest fires somehow links them to climate change. Therefore it is good time to see how the forest fires has changed during the years. Is there really an increasing trend of Siberia forest fires as the news suggests and what is continuously predicted based on climate models?

With an area of 13.1 million square kilometres (5,100,000 sq mi), Siberia accounts for 77% of Russia’s land area. Majority of the Siberia is sparsely inhabited wilderness with little or no roads. Therefore, what sets on fire, usually burns until rain or other natural factor ends the fire. Southern Siberia also has extensive logging.

Getting reliable fire area data based on available literature seems to be problematic. According to the literature (1) USSR-era fire area data is unreliable and was consistently and severely underreporting fires on sparsely populated areas due to incomplete reporting structure that left most of the country unmonitored (6). The situation was improved only after western satellite data was taken in use by post-USSR Russia. But considering the size of Siberia and the fact that it is very sparsely populated, it is not wonder that no reliable data can be generated without the help of satellites. But even on satellite era some smaller fires goes undetected due to cloud cover or sensor detection limits (6).

After extensive literature study, I found no actual study providing satellite-based dataset for Siberian forest fires for post-USSR era either, which is strange considering how much coverage the Siberian forest fires have got lately. There seem to be an effort going on to create such a dataset for USSR-era years, however, by digitizing old satellite images taken since 1979, but let’s discuss that later a bit more.

Annual burned area in Siberia 1997-2016

Wildfire, Siberia: 123rf.com

Figure: Natural forest fire in Russia.