The spiralling environmental cost of our lithium battery addiction

by A. Katwala, Aug 5, 2018 in Wired


Here’s a thoroughly modern riddle: what links the battery in your smartphone with a dead yak floating down a Tibetan river? The answer is lithium – the reactive alkali metal that powers our phones, tablets, laptops and electric cars.

In May 2016, hundreds of protestors threw dead fish onto the streets of Tagong, a town on the eastern edge of the Tibetan plateau. They had plucked them from the waters of the Liqi river, where a toxic chemical leak from the Ganzizhou Rongda Lithium mine had wreaked havoc with the local ecosystem.

There are pictures of masses of dead fish on the surface of the stream. Some eyewitnesses reported seeing cow and yak carcasses floating downstream, dead from drinking contaminated water. It was the third such incident in the space of seven years in an area which has seen a sharp rise in mining activity, including operations run by BYD, the world’ biggest supplier of lithium-ion batteries for smartphones and electric cars. After the second incident, in 2013, officials closed the mine, but when it reopened in April 2016, the fish started dying again.


ANTARCTICA SUFFERING COLDEST JANUARY SINCE 1978 + GLOBAL SEA ICE GROWING EXPONENTIALLY

by Cap Allon, Jan 29, 2021 in Electroverse


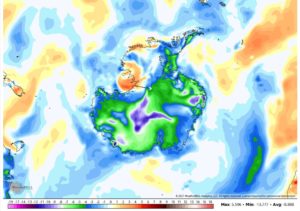
The start of 2021 in Antarctica has been an unusually chilly one. In fact, the first half of January has been the coldest since 1978, according to data compiled by @LpdlcRamirez and @peikko763 on Twitter.

As of Jan. 19, the month-to-date temperature anomaly across Antarctic is approx. -0.5C, making this the continents coldest first 3-or-so-weeks of Jan. since 1978 (solar minimum of cycle 20), according to research conducted by @peikko163 on Twitter, who also notes that the Southern Hemisphere as a whole is suffering anomalous January chills not seen since 2012.

But this chill of solar minimum isn’t just confined to the Southern Hemisphere either, the mercury ACROSS the planet is tumbling. In one month global temperatures dropped by a whopping 0.26C: from 0.53C above the 1981-2010 avg. in Nov. 2020 to just 0.27C above the avg. in Dec. 2020 (UAH). This drop was in spite of a warming Arctic–a region expected to “heat” during times of otherwise “global” cooling (more on that below).

The Sun appears to be sliding into its next Grand Solar Minimum cycle–a multidecadal spell of reduced solar output where the solar disc can be devoid of sunspots for months or even years at a time. The result on Earth’s climate will be one of violent swings between extremes due to a weakening of the jet streams: intense bursts of heat will linger in one area, while a teeth-chattering chill will dominate nearby, and then the regions will “switch” — it is this unpredictable chopping and changing that will hasten the failure of our modern food production systems: crops will fail, on a large scale, and famine could quickly ensue.

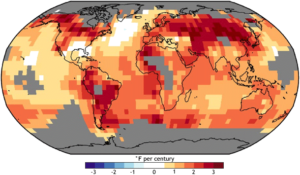
Overall, Earth’s temperature trends colder during a Grand Solar Minimum, as the Sun’s output sinks lower and lower (increased cloud nucleation being one likely forcing). However, not ALL regions experience the chill: as with the previous GSM (the Maunder Minimum 1645-1715), areas such as the Arctic, Alaska, and S. Greenland/N. Atlantic actually warmed while the rest of the planet cooled — NASA reveals the phenomenon in their Maunder Minimum temperature reconstruction map:

The Rational Climate e-Book, By Patrice Poyet

P. Homewood, Jan 27, 2021 in NotaLotofPeopleKnowThat


I am delighted to give a plug to Patrice Poyet’s new e-Book, The Rational Climate e-Book.

It can be downloaded for free on the link below:

https://www.researchgate.net/publication/347150306_The_Rational_Climate_e-Book/link/5fe21ddb92851c13feb1763d/download

Patrice is a geologist, a geochemist and an applied computer scientist with an interest in various domains like Earth and Planetary Sciences, Astronomy, Finance and Trading, Integration in Manufacturing and Design, Simulation and Defense Systems, etc The development of computer systems has given him the chance to take part in a wide variety of projects in very different areas of expertise. Patrice published 37 articles mostly in peer-reviewed scientific journals, 6 books jointly-reviewed with colleagues, 6 peer-reviewed chapters in books, 64 papers in peer-reviewed conferences, one D.Sc. thesis (1986), and 32 scientific and technical reports for demanding public and private clients (e.g. French Navy, EC-funded R&D projects, CIEH, etc.) and acted as an expert reviewer for several EC R&D projects. He is now using his initial training as a geochemist and his passion for Earth and Space sciences to completely revisit the subject of climate and paleo-climates. The result is this free 431 pages e-Book that addresses all aspects of the subject.

Does “global warming” mean it’s warming everywhere?

by C. Kennedy, Oct 29, 2020 in NOAAClimate.gov


No, “global warming” means Earth’s averageannual air temperature is rising, but not necessarily in every single location during all seasons across the globe.  It’s like your grades. If one semester you get all Bs and Cs, and the next you get all As and Cs, your grade point average rises, even though you didn’t improve in every class.

That’s the way it is with Earth’s near-surface temperature as atmospheric greenhouse gas levels climb. Temperature trends across the entire globe aren’t uniform because of the diverse geography on our planet—oceans versus continents, lowlands versus mountains, forests versus deserts versus ice sheets—as well as natural climate variability. When you’re zoomed in on a particular place, you may not be able to see the overall trend.

It is only when scientists calculate the average of temperature changes from every place on Earth over the course of a year to produce a single number, and then look at how that number has changed over time that a very clear, global warming trend emerges. In other words, it’s only when we “zoom out” to the planet-wide scale that the trend is obvious: despite a few, rare areas experiencing an overall cooling trend, the vast majority of places across the globe are warming.


The reason a “zoomed out” view makes the long-term trend so clear is that Earth’s annual average temperatures from year to year are found to be very stable when nothing is forcing it to change. Today, though, every decade since 1960 has been warmer than the last, and the last three decades each have been the warmest on record. Relative to geologic time, the warming that has occurred—1.8°F (1°C) over a span of about 120 years—is an unusually large temperature change in a relatively short span of time.

Meet The Team Shaking Up Climate Models

by C. Rotter, Jan 26, 2021 in WUWT


A new team tries a new approach to Climate Modeling using AI and machine learning. Time will tell if a positive effort or extremely complicated exercise in curve fitting. Their goal is regional scale predictive models useful for planning. Few admit publicly that these do not exist today despite thousands of “studies” using downscaled GCM’s.

“There are some things where there are very robust results and other things where those results are not so robust,” says Gavin Schmidt, who heads NASA’s respected climate modeling program at the Goddard Institute for Space Studies. But the variances push skeptics to dismiss the whole field.

“There’s enough stuff out there that people can sort of cherry-pick to support their preconceptions,” says Dr. Hausfather. “Climate skeptics … were arguing that climate models always predict too much warming.” After studying models done in the past 50 years, Dr. Hausfather says, “it turns out they did remarkably well.”

But climate modelers acknowledge accuracy must improve in order to plot a way through the climate crisis. Now, a team of climatologists, oceanographers, and computer scientists on the East and West U.S. coasts have launched a bold race to do just that.

They have gathered some of the brightest experts from around the world to start to build a new, modern climate model. They hope to corral the vast flow of data from sensors in space, on land, and in the ocean, and enlist “machine learning,” a kind of artificial intelligence, to bring their model alive and provide new insight into what many believe is the most pressing threat facing the planet.

Their goal is accurate climate predictions that can tell local policymakers, builders, and planners what changes to expect by when, with the kind of numerical likelihood that weather forecasters now use to describe, say, a 70% chance of rain.

Japanese Climate Scientist Kyoji Kimoto: “Climate Change Governed By The Sun”, CO2 Lesser Role!

by P. Gosselin, Jan 22, 2021 in NoTricksZone


I’ve compiled a list of six examples how the sun impacts climate across the globe.

1. Climate periods based on a double Hale (44-45 years) cycle of solar activity.

In 1977 Australian geologist Rhodes W. Fairbridge found a 45-year periodicity of beach ridge located at the Hudson Bay. It has been formed with storms in Hudson Bay caused by a wavier jet stream.

I have found a 44-year periodicity of heavy snowfall in Japan caused by the wavier jet stream as follows. The time series coincide quite well with that of Fairbridge (1977).

1833   Tempo famine, Dalton minimum (1795-1830)
1877   Seinan war (44 years later)
1918   Rice riot, Gleissberg minimum (1898-1923) (41 years later)
1963   38 heavy snowfall (45 years later)
2006  Heisei 18 year heavy snowfall, Gleissberg or Dalton minimum (43 years)

The climate history of 20th century can be divided with the following 5 periods based on the double Hale cycle above using aa-index of geomagnetism associated with solar activity. The Pacific Climate Shift occurred at 1977 with solar activity increase & a positive PDO index.

1900-1918: Little Ice Age (LIA)
1919-1962: 1st Modern Warm Period (1st MWP)
1963-1976: Temporal Cold Period  (TCP, New Ice Age Coming, see below)
1977-2005: 2nd Modern Warm Period (2nd MWP)
2006 – present: New Cold Period (NCP)

Studies Show Glaciers Worldwide Were Smaller Than Today

by Die Late Sonne, Feb 26, 2021 in ClimateChangeDispatch


Former Iceland Prime Minister fed up with climate tourism: Glaciers used to be smaller than today

By Die kalte Sonne
[German text translated by P. Gosselin]

Many glaciers are currently shrinking, as they have always done in the past when the climate warmed up. What’s the news on the glacier front?

In August 2019, the Okjokull Glacier disappeared in Iceland with great media attention. The BBC reported:

Climate change: Iceland holds funeral for melted glacier

The glacier called Okjokull is the first in the country to be lost to climate change, after the warmest July ever on record. Iceland loses about 11 billion tonnes of ice per year, and scientists have warned that there are about 400 other glaciers also at risk. They fear all of the island’s glaciers will be gone by 2200. Glaciers cover about 11% of Iceland’s surface.”

Read more at the BBC.

However, the glacier had not formed until the Little Ice Age. See our article “The cycle is full: the death of an Icelandic glacier that did not exist even during the Medieval Warm Period“. Iceland’s prime minister from 2013-2016, David Gunnlaugsson, dislikes activism. In The Spectator, Gunnlaugsson wrote on November 23, 2019:

Iceland’s melting glaciers are nothing to panic about

Ocean forcing drives glacier retreat in Greenland

by M. Wood et al., Jan 01, 2021 in AAAS OPEN ACCESS


INTRODUCTION

The Greenland Ice Sheet has contributed substantially to sea-level rise over the past few decades. Since 1972, approximately two-thirds of the ice sheet’s contribution to sea-level rise resulted from increased glacier flux with the remaining one-third from anomalous surface melt (1). Before 2000, anomalous ice discharge was the dominant driver of mass loss, but in recent years, increasingly negative surface mass balance anomalies have contributed to a larger proportion of the total mass loss from the ice sheet (1). The acceleration in mass flux has been partially attributed to a warming of subsurface waters around Greenland near the end of the 1990s (2, 3) and increased runoff, resulting in enhanced water mixing and melt at glacier margins, destabilization of terminus regions (4, 5), ice front retreat (6, 7), and, in most cases, accelerated ice flow (8). The increase in flow speed, combined with enhanced surface melt, results in increased glacier thinning, which is conducive to further retreat (9). Other processes may have additionally contributed to the glacier retreat, e.g., increases in basal lubrication, melting of the ice mélange in front of glaciers, or weakening of glacier shear margins, but quantitative evidence about their impact has been limited (1012).

The warming of subsurface waters at the turn of the 21st century was caused by the spreading of ocean heat from the subpolar gyre during a transition in the North Atlantic Oscillation (NAO) from a high positive phase to a low-to-negative phase (3). In this shift, the North Atlantic subpolar gyre expanded, enhancing ocean heat fluxes through the coastal Irminger and West Greenland currents, yielding warmer subsurface waters on the continental shelf of all seven major basins of Greenland (Fig. 1). Since 2010, the NAO has transitioned back to a more positive phase, yielding a relative cooling of the ocean waters, however, not sufficiently to bring back ocean heat fluxes to the levels of the 1990s (13).

“DO NOT TRAVEL” WARNINGS ISSUED AS HEAVY SNOW BLANKETS MAJORITY OF BRITAIN

by Cap Allon, Jan 25, 2021 in Electroverse


According to the UK Met Office, snowfall in Britain will be a thing of the past by 2040-2060 — a ludicrous, fear-mongering prophesy, and one almost as stupid as the claims made by senior climatologist Dr David Viner of the Climate Research Unit (CRU) of the University of East Anglia.

Back in 2000, and as reported by the Telegraph (since deleted), Viner said: within a few years winter snowfall will become “a very rare and exciting event,” adding that “children just aren’t going to know what snow is.”

Frustratingly, these hacks are never called to task, their mistakes and dud-research seldom analysed or investigated. Instead, the cycle is simply one of rinse and repeat: the global warming cabal call-up their next set of “higher-educated” brainwashees who go on to use the exact same flawed upside down pyramid built on the work of just a few climate modelers to make the exact same tired-old doomsday predictions–such as “the end of snow”.

Just yesterday, January 25, a severe weather warning was in place across a large portion of the UK as heavy snow threatened.

The pow-pow duly arrived early Sunday morning with some regions, particularly those in central England and Wales, registering accumulations of 5+ inches (13+ cm) in just an hour and a half.

Elon Musk Drilling Gas Wells in Texas!

by D. Middleton, Jan 25, 2021 in WUWT


Guest “I was wrong about this guy” by David Middleton

SpaceX Plans to Drill for Natural Gas Near Texas Launchpad
Sergio Chapa
Jan 23 2021

(Bloomberg) — Elon Musk recently moved to Texas, where he launches some of his rockets and is building a battery factory. Now, for good measure, he plans to drill for natural gas in the state.

The billionaire’s SpaceX intends to drill wells close to the company’s Boca Chica launchpad, it was revealed during a Friday hearing before the Railroad Commission of Texas, the state’s energy regulator.

Production has yet to start because of a legal dispute between the SpaceX subsidiary Lone Star Mineral Development and another energy company. Tim George, an attorney representing Lone Star, said at the hearing that SpaceX plans to use the methane it extracts from the ground “in connection with their rocket facility operations.”

While it’s unclear what exactly the gas would be used for, SpaceX plans to utilize super-chilled liquid methane and liquid oxygen as fuel for its Raptor engines. The company’s Starship and Super Heavy vehicles are tested at Boca Chica, and orbital launches are planned for the site.

[…]

Bloomberg

Study Shows Arctic Sea Ice Reached Lowest Point On Modern Record… In The 1940s, Not Today!

by C. Rotter, Jan 24, 2021 in WUWT


Regular NoTricksZone author Kenneth Richards notes on Twitter

Apparently Arctic sea ice volume was as low in the 1940s as it has been in the 2000s.

And the highest sea ice volume of the last 100 years was about 1979 – the year the Arctic sea ice record begins.


Guillian Van Achter1, Leandro Ponsoni1, François Massonnet1, Thierry Fichefet1, and Vincent Legat2

  • 1Georges Lemaitre Center for Earth and Climate Research, Earth and Life Institute, Université Catholique de Louvain, Louvain-la-Neuve, Belgium
  • 2Institute of Mechanics, Materials and Civil Engineering, Applied Mechanics and Mathematics, Université Catholique de Louvain, Louvain-la-Neuve, Belgium

Correspondence: Guillian Van Achter (guillian.vanachter@uclouvain.be) Received: 04 Dec 2019 – Discussion started: 10 Dec 2019 – Revised: 17 Jul 2020 – Accepted: 09 Sep 2020 – Published: 21 Oct 2020

Abstract

We use model simulations from the CESM1-CAM5-BGC-LE dataset to characterise the Arctic sea ice thickness internal variability both spatially and temporally. These properties, and their stationarity, are investigated in three different contexts: (1) constant pre-industrial, (2) historical and (3) projected conditions. Spatial modes of variability show highly stationary patterns regardless of the forcing and mean state. A temporal analysis reveals two peaks of significant variability, and despite a non-stationarity on short timescales, they remain more or less stable until the first half of the 21st century, where they start to change once summer ice-free events occur, after 2050.

How to cite. Van Achter, G., Ponsoni, L., Massonnet, F., Fichefet, T., and Legat, V.: Brief communication: Arctic sea ice thickness internal variability and its changes under historical and anthropogenic forcing, The Cryosphere, 14, 3479–3486, https://doi.org/10.5194/tc-14-3479-2020, 2020.1

The role of megacontinents in the supercontinent cycle

by Wang et al. 2020 in GeolSocAmerica OPEN ACCESS.pdf


ABSTRACT
Supercontinent Pangea was preceded by the formation of Gondwana, a “megacontinent”

about half the size of Pangea. There is much debate, however, over what role the assembly of the precursor megacontinent played in the Pangean supercontinent cycle. Here we dem- onstrate that the past three cycles of supercontinent amalgamation were each preceded by ∼200 m.y. by the assembly of a megacontinent akin to Gondwana, and that the building of a megacontinent is a geodynamically important precursor to supercontinent amalgamation. The recent assembly of Eurasia is considered as a fourth megacontinent associated with future supercontinent Amasia. We use constraints from seismology of the deep mantle for Eurasia and paleogeography for Gondwana to develop a geodynamic model for megacontinent assembly and subsequent supercontinent amalgamation. As a supercontinent breaks up, a megacontinent assembles along the subduction girdle that encircled it, at a specific location where the downwelling is most intense. The megacontinent then migrates along the girdle where it collides with other continents to form a supercontinent. The geometry of this model is consistent with the kinematic transitions from Rodinia to Gondwana to Pangea.

See also  What might Earth’s next supercontinent look like? New study provides clues

World’s largest lakes reveal climate change trends

by Michigan Technological University, Jan 21, 2021 in ScienceDaily


NASA-funded research on the 11 largest freshwater lakes in the world coupled field and satellite observations to provide a new understanding of how large bodies of water fix carbon, as well as how a changing climate and lakes interact.

One of the most remarkable aspects of the results is just how fast changes in these freshwater lakes have occurred — a noticeable amount in fewer than 20 years. The research contributes to NASA’s Carbon Monitoring System’s goal of determining how much freshwater lakes contribute to the global carbon cycle.

“Three of the largest lakes in the world are showing major changes related to climate change, with a 20-25% change in overall biological productivity in just the past 16 years,” Fahnenstiel said.

More Than Algae

In the 16 years of data, Great Bear and Great Slave lakes in northern Canada saw the greatest increases in productivity, while Lake Tanganyika in southeastern Africa has seen decreases. The trends are linked to increases in water temperatures, as well as solar radiation and a reduction in wind speed.

Sayers said looking at productivity, algal abundance, water clarity, water temperature, solar radiation and wind speeds at freshwater lakes provides a richer picture of the overall ecosystem.

“Temperature and solar radiation are factors of climate change,” Sayers said. “Chlorophyll and water transparency changes are not necessarily caused by climate change, but could be caused by eutrophication or invasive species, like quagga mussels.”

Rocks show Mars once felt like Iceland

by Rice University, Jan 21, 2021 in ScienceDaily


Crater study offers window on temperatures 3.5 billion years ago

Once upon a time, seasons in Gale Crater probably felt something like those in Iceland. But nobody was there to bundle up more than 3 billion years ago.

The ancient Martian crater is the focus of a study by Rice University scientists comparing data from the Curiosity rover to places on Earth where similar geologic formations have experienced weathering in different climates.

Iceland’s basaltic terrain and cool weather, with temperatures typically less than 38 degrees Fahrenheit, turned out to be the closest analog to ancient Mars. The study determined that temperature had the biggest impact on how rocks formed from sediment deposited by ancient Martian streams were weathered by climate.

The study by postdoctoral alumnus Michael Thorpe and Martian geologist Kirsten Siebach of Rice and geoscientist Joel Hurowitz of State University of New York at Stony Brook set out to answer questions about the forces that affected sands and mud in the ancient lakebed.

Data collected by Curiosity during its travels since landing on Mars in 2012 provide details about the chemical and physical states of mudstones formed in an ancient lake, but the chemistry does not directly reveal the climate conditions when the sediment eroded upstream. For that, the researchers had to look for similar rocks and soils on Earth to find a correlation between the planets.

Failing Computer Models

by P. Homewood ,Jan 21, 2021 in NotaLotofPeopleKnowThat


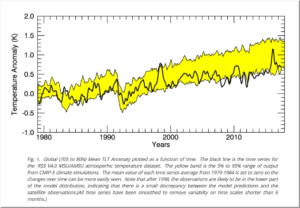
If anybody tries to tell you that the computer models are accurately predicting global warming, show them this:

http://www.remss.com/research/climate/#:~:text=The%20RSS%20merged%20lower%20stratospheric%20temperature%20data%20product,in%20well-mixed%20greenhouse%20gases%20causes%20by%20human%20activity.

It comes from RSS, who monitor atmospheric temperatures via satellite observation. They are ardent warmists, and here us what they have to say:

….

ANTARCTICA SUFFERING COLDEST JANUARY SINCE 1978 + GLOBAL SEA ICE GROWING EXPONENTIALLY

by Cap Allon, Jan 20, 2021 in Electroverse


The start of 2021 in Antarctica has been an unusually chilly one. In fact, the first half of January has been the coldest since 1978, according to data compiled by @LpdlcRamirez and @peikko763 on Twitter.

As of Jan. 19, the month-to-date temperature anomaly across Antarctic is approx. -0.5C, making this the continents coldest first 3-or-so-weeks of Jan. since 1978 (solar minimum of cycle 20), according to research conducted by @peikko163 on Twitter, who also notes that the Southern Hemisphere as a whole is suffering anomalous January chills not seen since 2012.

But this chill of solar minimum isn’t just confined to the Southern Hemisphere either, the mercury ACROSS the planet is tumbling. In one month global temperatures dropped by a whopping 0.26C: from 0.53C above the 1981-2010 avg. in Nov. 2020 to just 0.27C above the avg. in Dec. 2020 (UAH). This drop was in spite of a warming Arctic–a region expected to “heat” during times of otherwise “global” cooling (more on that below).

The Sun appears to be sliding into its next Grand Solar Minimum cycle–a multidecadal spell of reduced solar output where the solar disc can be devoid of sunspots for months or even years at a time. The result on Earth’s climate will be one of violent swings between extremes due to a weakening of the jet streams: intense bursts of heat will linger in one area, while a teeth-chattering chill will dominate nearby, and then the regions will “switch” — it is this unpredictable chopping and changing that will hasten the failure of our modern food production systems: crops will fail, on a large scale, and famine could quickly ensue.

Overall, Earth’s temperature trends colder during a Grand Solar Minimum, as the Sun’s output sinks lower and lower (increased cloud nucleation being one likely forcing). However, not ALL regions experience the chill: as with the previous GSM (the Maunder Minimum 1645-1715), areas such as the Arctic, Alaska, and S. Greenland/N. Atlantic actually warmed while the rest of the planet cooled — NASA reveals the phenomenon in their Maunder Minimum temperature reconstruction map:

The Natural Warming Of The Global Oceans-Bob Tisdale

by P. Homewood, Jan 18, 3021 in NotaLotofPeopleknowThat


https://youtu.be/lmjaNO5DD_Q

Many of you will be familiar with the work of Bob Tisdale over the years, concerning the mechanism of ENSO (ie El Ninos and La Ninas) and its effects on climate.

His seminal series of videos, recorded in 2012 is still on YouTube, and is still highly relevant.

Above is Part 1, which is worth sticking with all the way through, but otherwise the first 8 minutes is definitely worth a watch. Nothing has effectively changed since 2012, and Bob’s conclusions are still relevant and valid.

As well as explaining what exactly drives El Ninos and La Ninas, he makes some significant points:

  1. Worldwide sea surface temperature trends since 1980 show no correlation with GHGs (see chart below)

  2. Instead they exhibit a series of step changes up, which follow the major El Nino events of 1982/83, 1987/88 and 1997/98

  3. Contrary to popular belief, global SSTs do not drop during La Nina episodes. This is because El Ninos transfer a vast amount of warm, subsurface water to the surface, where it remains during La Nina.

  4. Some of this warm water in the East Pacific finds its way into the West Pacific and Indian Oceans. But through a process called teleconnection, SSTs is the Atlantic, where there is no direct connection, also rise and exhibit the same step changes.

  5. Between major El Nino events, SSTs outside the East Pacific do not rise.

  6. In the East Pacific, there has been no trend increase in SST at all since 1980.


    ….

The IR absorptive characteristics of “greenhouse” gases–David Coe

by P. Homewood, Jan 17, 2021 in NotaLotofPeopleKnowThat


SUMMARY

Using well documented data on the infra-red absorption spectra of atmospheric gases it is a straight-forward process to infer the overall atmospheric IR absorption and from that the effective global average temperature. The simplest of atmospheric models has been used: the atmosphere is considered to be a uniform thin absorbing layer of gas. The results demonstrate clearly that the warming effect of the atmosphere is almost entirely due to the spectral absorption characteristics of CO2 and H2O. They are both exceptionally strong absorbers of infra-red radiation. It is however this strength which determines the characteristics of the earth’s temperature, and in particular its stability.

70% of the energy radiated from the earth is removed by a mixture of 0.1% H2O and 200ppm of CO2. This alone is sufficient to raise global temperatures from the chilly 255K of the estimated zero atmosphere condition to 284.3K, less than 4deg below current average temperatures. An estimation of the current atmospheric mixture of gases is calculated to deliver a global mean temperature of 286.8K close to the best estimate of 288K for that temperature. Further increases in both H2O and CO2 have relatively small impacts on temperatures. This is due simply to the fact that at current concentrations the spectra of both H2O and CO2 have effectively extracted most of the energy at wavebands corresponding to their molecular absorption spectra. There is little further energy to be extracted by adding more H2O and CO2. This results in climate sensitivity values of less than 0.5degC, in comparison to the 1.5 to 5 degC range quoted by the IPCC.

CO2 levels of 3000ppm will only raise temperatures by a further 1.5K. These temperature increases are in fact well within natural variations seen in the past, including the medieval warm period and the little ice age of some 300 years ago.

The possibility of positive feedback from water vapour is discounted by the simple fact that the H2O spectrum is incapable of absorbing significant further amounts of radiated energy and the modest increase in temperature due to increasing CO2 levels is unable to deliver any significant increase in H2O concentration due to the specific relationship of H2O saturation vapour pressure and temperature. It would take an increase in temperature of 10degC to double the mean H2O atmospheric concentration, and that doubling would only result in a temperature increase of 2degC.

The impact of other known “greenhouse’ gases, CH4 and N2O are also calculated from known IR spectra data. Their absorption spectra are swamped by H2O and CO2. The combined warming caused by current atmospheric concentrations will elevate temperature by only 0.2K and increasing concentrations by a factor of 10 will only result in a further temperature increase of 0.5K.

The “greenhouse effect” is dominated by the absorption spectrum of H2O with a little help from CO2. At current concentrations of both gases it is inconceivable that further increases in concentrations will lead to any significant warming. Increasing CO2 concentration to 3000ppm and doubling the mean H2O level to 2% would result in a global temperature increase of 3.4K.

In short, there is no climate emergency, at least due to “greenhouse gases”.

 The full paper can be read here:

co2-the-miracle-molecule-22637

See this Addendum

Committed warming and the pattern effect

by Nic Lewis, Jan 19, 2021 in ClilmateEtc.


Key points

  • The pattern effect is the dependence of outgoing radiation to space on the spatial pattern of surface warming.
  • A pattern effect, relative to that in equilibrium, can be caused both by evolution over time in the climate system’s response to forcing and by its internal variability.
  • The paper fails to distinguish between a historical period pattern effect that is forced, which will unwind very slowly, and one that is caused by internal variability, which can quickly unwind, causing rapid warming.
  • The forced pattern effect is very small in CAM5.3
  • The pattern effect found in the paper is greatly affected by being estimated during the hiatus.
  • The estimated post-hiatus unforced historical pattern effect is non-negligible in CAM5.3 when using the AMIP2 sea surface temperature dataset, as in the paper, but negligible when using the UK Met Office HadISST1 dataset.
  • The historical pattern effect is not robust; it varies hugely between models and SST datasets.
  • The paper’s claims about greater committed warming directly reflect its estimate of the size of the historical pattern effect.

Introduction

A new paper “Greater committed warming after accounting for the pattern effect” led by Chen Zhou  (Zhou et al.[1]) has recently been published in Nature Climate Change. Here is the accompanying press release.

Warmer Than Thought? GWPF Science Editor Sceptical About New Ocean-Warming Paper

by RFI, Jan 12, 2021 in GWPF


A new report published in the US journal Science, led by the Chinese Academy of Sciences, suggests the world’s oceans are warming 40 percent faster than what a UN panel predicted five years ago. Although data collection is more accurate than in the past, some experts advise against jumping to hasty conclusions.

About 93 percent of excess heat trapped around the Earth by greenhouse gases that come from the burning of fossil fuels accumulates in the world’s oceans.

The UN Intergovernmental Panel on Climate Change (IPCC) says ocean warming has led to rising sea levels and contributes to increases in rainfall intensity, more violent storms and the destruction of coral reefs.

It is also a threat to biodiversity and one of the earth’s major food supplies.

“Ocean heating is a very important indicator of climate change, and we have robust evidence that it is warming more rapidly than we thought,” said co-author Zeke Hausfather, a graduate student in the Energy and Resources Group at the University of California, Berkeley.

Their report relied on four studies, published between 2014 and 2017 whose conclusions are based on measurements recorded by a fleet of some 4,000 floating robot monitors called Argo.

The robots drift throughout the world’s oceans, every few days diving to a depth of 2,000 meters and measuring the ocean’s temperature, pH, salinity and other information.

Argo “has provided consistent and widespread data on ocean heat content since the mid-2000s,” the report said.

The new analysis shows warming in the oceans is on pace with measurements of rising air temperature.

And if nothing is done to reduce greenhouse gases, “models predict that the temperature of the top 2,000 meters of the world’s oceans will rise 0.78 degrees Celsius by the end of the century,” it said.

Caution needed when interpreting results

David Whitehouse, the science editor for the Global Warming Policy Forum, based in the UK says we must very careful when drawing conclusions.

Continuer la lecture de Warmer Than Thought? GWPF Science Editor Sceptical About New Ocean-Warming Paper

Peer-Reviewed Study Confirms Antarctica Has Not Warmed in Last Seven Decades

by P. Homewood, Jan 16, 2021 in NotaLotofPeopleKnowThat


Cancel all the claims by climate activists that global warming is decimating Antarctica. A peer-reviewed study recently published in one of the most prominent science journals destroys one of the most frequently asserted claims by climate activists – that climate change is warming Antarctica and melting the Antarctic ice sheet. The recent study confirms Antarctica has not warmed in the past 70 years and Antarctic ice cover is expanding rather than shrinking.

Writing in the journal Nature, scientists at Columbia University and the University of Victoria, British Columbia report, “The Antarctic continent has not warmed in the last seven decades, despite a monotonic increase in the atmospheric concentration of greenhouse gases.”


….

AT LEAST 13 DEAD, HUNDREDS HOSPITALIZED AS RECORD SNOWSTORMS SWEEP JAPAN

by Cap Allon, Jan 23, 2021 in Electroverse


Following the historic snowstorms of the past few weeks, Japan has been hit again: at least 13 people died and more than 250 were injured as record snowfall blanketed regions along the Sea of Japan coast, according to the latest report by the nation’s Disaster Management Agency.

Among those to have lost their lives were three people in Fukui Prefecture, and four in Niigata Prefecture, all reportedly while trying to remove the snow which topped a whopping 3.13 meters (10.3 feet) in some areas.

According to Japan’s Meteorological Agency (JMA), at least 10 monitoring stations along the Sea of Japan set new all-time 72-hour snowfall records late on Jan. 10, and many more busted all-time low temperature records, including in Furue, Kamigoori, and Kuzakai–with the latter logging a bone-chilling -24C (-11F).


Distorting the view of our climate future: The misuse and abuse of climate pathways and scenarios

by R. Pielke & J. Richtie, 2020 in EnergyRes&SocScience


Abstract

Climate science research and assessments under the umbrella of the Intergovernmental Panel on Climate Change (IPCC) have misused scenarios for more than a decade. Symptoms of misuse have included the treatment of an unrealistic, extreme scenario as the world’s most likely future in the absence of climate policy and the illogical comparison of climate projections across inconsistent global development trajectories. Reasons why such misuse arose include (a) competing demands for scenarios from users in diverse academic disciplines that ultimately conflated exploratory and policy relevant pathways, (b) the evolving role of the IPCC – which extended its mandate in a way that creates an inter-relationship between literature assessment and literature coordination, (c) unforeseen consequences of employing a temporary approach to scenario development, (d) maintaining research practices that normalize careless use of scenarios, and (e) the inherent complexity and technicality of scenarios in model-based research and in support of policy. Consequently, much of the climate research community is presently off-track from scientific coherence and policy-relevance. Attempts to address scenario misuse within the community have thus far not worked. The result has been the widespread production of myopic or misleading perspectives on future climate change and climate policy. Until reform is implemented, we can expect the production of such perspectives to continue, threatening the overall credibility of the IPCC and associated climate research. However, because many aspects of climate change discourse are contingent on scenarios, there is considerable momentum that will make such a course correction difficult and contested – even as efforts to improve scenarios have informed research that will be included in the IPCC 6th Assessment.

Claim: The Temperature Spike Just Prior to the Little Ice Age can Teach Us about Modern Global Warming

by E. Worall, Jan 7, 2021 in WUWT


According to Patric Seifert, a tropospheric researcher at the Leibniz Institute in Germany, a large scale temperature spike occurred just before the onset of the Little Ice Age. Seifert does not think global temperatures are about to crash, but he thinks conditions in Europe are similar enough to the 14th century that historical reconstructions of this medieval heatwave, the Dantean Anomaly, can help us understand what we will face as the world continues to warm.

Extreme 14th Century Droughts May Provide Insight Into Our Climate Change Crisis 

CARLY CASSELLA
9 JANUARY 2021

Scientists are studying a major, once-in-a-century drought from Medieval Europe to better understand how extreme weather events indicate rapid climate changes.

In the years leading up to the Little Ice Age, between 1302 and 1307, many regions on the European continent were facing exceptional heat and drought, according to historical records and data collected from tree rings and sediment cores.

These extreme natural events, while not driven by human emissions, hold similar characteristics to recent weather anomalies, and they could help us better predict the course of modern-day climate change.

“Even if it was a phase of cooling in the Middle Ages and we are now living in a phase of [hu]man-made warming, there could be parallels,” says Patric Seifert, a tropospheric researcher at the Leibniz Institute in Germany.

“The transitional period between two climate phases could be characterized by smaller temperature differences between the latitudes and cause longer-lasting large-scale weather patterns, which could explain an increase in extreme events.“