The Rational Climate e-Book, By Patrice Poyet

P. Homewood, Jan 27, 2021 in NotaLotofPeopleKnowThat


I am delighted to give a plug to Patrice Poyet’s new e-Book, The Rational Climate e-Book.

It can be downloaded for free on the link below:

https://www.researchgate.net/publication/347150306_The_Rational_Climate_e-Book/link/5fe21ddb92851c13feb1763d/download

Patrice is a geologist, a geochemist and an applied computer scientist with an interest in various domains like Earth and Planetary Sciences, Astronomy, Finance and Trading, Integration in Manufacturing and Design, Simulation and Defense Systems, etc The development of computer systems has given him the chance to take part in a wide variety of projects in very different areas of expertise. Patrice published 37 articles mostly in peer-reviewed scientific journals, 6 books jointly-reviewed with colleagues, 6 peer-reviewed chapters in books, 64 papers in peer-reviewed conferences, one D.Sc. thesis (1986), and 32 scientific and technical reports for demanding public and private clients (e.g. French Navy, EC-funded R&D projects, CIEH, etc.) and acted as an expert reviewer for several EC R&D projects. He is now using his initial training as a geochemist and his passion for Earth and Space sciences to completely revisit the subject of climate and paleo-climates. The result is this free 431 pages e-Book that addresses all aspects of the subject.

Does “global warming” mean it’s warming everywhere?

by C. Kennedy, Oct 29, 2020 in NOAAClimate.gov


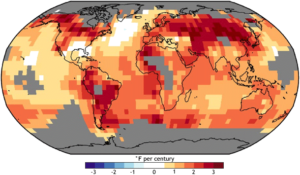
No, “global warming” means Earth’s averageannual air temperature is rising, but not necessarily in every single location during all seasons across the globe.  It’s like your grades. If one semester you get all Bs and Cs, and the next you get all As and Cs, your grade point average rises, even though you didn’t improve in every class.

That’s the way it is with Earth’s near-surface temperature as atmospheric greenhouse gas levels climb. Temperature trends across the entire globe aren’t uniform because of the diverse geography on our planet—oceans versus continents, lowlands versus mountains, forests versus deserts versus ice sheets—as well as natural climate variability. When you’re zoomed in on a particular place, you may not be able to see the overall trend.

It is only when scientists calculate the average of temperature changes from every place on Earth over the course of a year to produce a single number, and then look at how that number has changed over time that a very clear, global warming trend emerges. In other words, it’s only when we “zoom out” to the planet-wide scale that the trend is obvious: despite a few, rare areas experiencing an overall cooling trend, the vast majority of places across the globe are warming.


The reason a “zoomed out” view makes the long-term trend so clear is that Earth’s annual average temperatures from year to year are found to be very stable when nothing is forcing it to change. Today, though, every decade since 1960 has been warmer than the last, and the last three decades each have been the warmest on record. Relative to geologic time, the warming that has occurred—1.8°F (1°C) over a span of about 120 years—is an unusually large temperature change in a relatively short span of time.

Meet The Team Shaking Up Climate Models

by C. Rotter, Jan 26, 2021 in WUWT


A new team tries a new approach to Climate Modeling using AI and machine learning. Time will tell if a positive effort or extremely complicated exercise in curve fitting. Their goal is regional scale predictive models useful for planning. Few admit publicly that these do not exist today despite thousands of “studies” using downscaled GCM’s.

“There are some things where there are very robust results and other things where those results are not so robust,” says Gavin Schmidt, who heads NASA’s respected climate modeling program at the Goddard Institute for Space Studies. But the variances push skeptics to dismiss the whole field.

“There’s enough stuff out there that people can sort of cherry-pick to support their preconceptions,” says Dr. Hausfather. “Climate skeptics … were arguing that climate models always predict too much warming.” After studying models done in the past 50 years, Dr. Hausfather says, “it turns out they did remarkably well.”

But climate modelers acknowledge accuracy must improve in order to plot a way through the climate crisis. Now, a team of climatologists, oceanographers, and computer scientists on the East and West U.S. coasts have launched a bold race to do just that.

They have gathered some of the brightest experts from around the world to start to build a new, modern climate model. They hope to corral the vast flow of data from sensors in space, on land, and in the ocean, and enlist “machine learning,” a kind of artificial intelligence, to bring their model alive and provide new insight into what many believe is the most pressing threat facing the planet.

Their goal is accurate climate predictions that can tell local policymakers, builders, and planners what changes to expect by when, with the kind of numerical likelihood that weather forecasters now use to describe, say, a 70% chance of rain.

Japanese Climate Scientist Kyoji Kimoto: “Climate Change Governed By The Sun”, CO2 Lesser Role!

by P. Gosselin, Jan 22, 2021 in NoTricksZone


I’ve compiled a list of six examples how the sun impacts climate across the globe.

1. Climate periods based on a double Hale (44-45 years) cycle of solar activity.

In 1977 Australian geologist Rhodes W. Fairbridge found a 45-year periodicity of beach ridge located at the Hudson Bay. It has been formed with storms in Hudson Bay caused by a wavier jet stream.

I have found a 44-year periodicity of heavy snowfall in Japan caused by the wavier jet stream as follows. The time series coincide quite well with that of Fairbridge (1977).

1833   Tempo famine, Dalton minimum (1795-1830)
1877   Seinan war (44 years later)
1918   Rice riot, Gleissberg minimum (1898-1923) (41 years later)
1963   38 heavy snowfall (45 years later)
2006  Heisei 18 year heavy snowfall, Gleissberg or Dalton minimum (43 years)

The climate history of 20th century can be divided with the following 5 periods based on the double Hale cycle above using aa-index of geomagnetism associated with solar activity. The Pacific Climate Shift occurred at 1977 with solar activity increase & a positive PDO index.

1900-1918: Little Ice Age (LIA)
1919-1962: 1st Modern Warm Period (1st MWP)
1963-1976: Temporal Cold Period  (TCP, New Ice Age Coming, see below)
1977-2005: 2nd Modern Warm Period (2nd MWP)
2006 – present: New Cold Period (NCP)

Studies Show Glaciers Worldwide Were Smaller Than Today

by Die Late Sonne, Feb 26, 2021 in ClimateChangeDispatch


Former Iceland Prime Minister fed up with climate tourism: Glaciers used to be smaller than today

By Die kalte Sonne
[German text translated by P. Gosselin]

Many glaciers are currently shrinking, as they have always done in the past when the climate warmed up. What’s the news on the glacier front?

In August 2019, the Okjokull Glacier disappeared in Iceland with great media attention. The BBC reported:

Climate change: Iceland holds funeral for melted glacier

The glacier called Okjokull is the first in the country to be lost to climate change, after the warmest July ever on record. Iceland loses about 11 billion tonnes of ice per year, and scientists have warned that there are about 400 other glaciers also at risk. They fear all of the island’s glaciers will be gone by 2200. Glaciers cover about 11% of Iceland’s surface.”

Read more at the BBC.

However, the glacier had not formed until the Little Ice Age. See our article “The cycle is full: the death of an Icelandic glacier that did not exist even during the Medieval Warm Period“. Iceland’s prime minister from 2013-2016, David Gunnlaugsson, dislikes activism. In The Spectator, Gunnlaugsson wrote on November 23, 2019:

Iceland’s melting glaciers are nothing to panic about