Full-time professor at the Free University of Brussels, Belgium
apreat@gmail.com
apreat@ulb.ac.be
• Department of Earth Sciences and Environment
Res. Grp. - Biogeochemistry & Modeling of the Earth System
Sedimentology & Basin Analysis
• Alumnus, Collège des Alumni, Académie Royale de Sciences, des Lettres et des Beaux Arts de Belgique (mars 2013). http://www.academieroyale.be/cgi?usr=2a8crwkksq&lg=fr&pag=858&rec=0&frm=0&par=aybabtu&id=4471&flux=8365323
• Prof. Invited, Université de Mons-Hainaut (2010-present-day)
• Prof. Coordinator and invited to the Royal Academy of Sciences of Belgium (Belgian College) (2009-
present day)
• Prof. partim to the DEA (third cycle) led by the University of Lille (9 universities from 1999 to 2004) - Prof. partim at the University of Paris-Sud/Orsay, European-Socrates Agreement (1995-1998)
• Prof. partim at the University of Louvain, Convention ULB-UCL (1993-2000)
• Since 2015 : Member of Comité éditorial de la Revue Géologie de la France http://geolfrance.brgm.fr
• Since 2014 : Regular author of texts for ‘la Revue Science et Pseudosciences’ http://www.pseudo-sciences.org/
• Many field works (several weeks to 2 months) (Meso- and Paleozoic carbonates, Paleo- to Neoproterozoic carbonates) in Europe, USA (Nevada), Papouasia (Holocene), North Africa (Algeria, Morrocco, Tunisia), West Africa (Gabon, DRC, Congo-Brazzaville, South Africa, Angola), Iraq... Recently : field works (3 to 5 weeks) Congo- Brazzaville 2012, 2015, 2016 (carbonate Neoproterozoic).
Degree in geological sciences at the Free University of Brussels (ULB) in 1974, I went to Algeria for two years teaching mining geology at the University of Constantine. Back in Belgium I worked for two years as an expert for the EEC (European Commission), first on the prospecting of Pb and Zn in carbonate environments, then the uranium exploration in Belgium. Then Assistant at ULB, Department of Geology I got the degree of Doctor of Sciences (Geology) in 1985. My thesis, devoted to the study of the Devonian carbonate sedimentology of northern France and southern Belgium, comprised a significant portion of field work whose interpretation and synthesis conducted to the establishment of model of carbonate platforms and ramps with reefal constructions.
I then worked for Petrofina SA and shared a little more than two years in Angola as Director of the Research Laboratory of this oil company. The lab included 22 people (micropaleontology, sedimentology, petrophysics). My main activity was to interpret facies reservoirs from drillings in the Cretaceous, sometimes in the Tertiary. I carried out many studies for oil companies operating in this country.
I returned to the ULB in 1988 as First Assistant and was appointed Professor in 1990. I carried out various missions for mining companies in Belgium and oil companies abroad and continued research, particularly through projects of the Scientific Research National Funds (FNRS).
My research still concerns sedimentology, geochemistry and diagenesis of carbonate rocks which leads me to travel many countries in Europe or outside Europe, North Africa, Papua New Guinea and the USA, to conduct field missions.
Since the late 90's, I expanded my field of research in addressing the problem of mass extinctions of organisms from the Upper Devonian series across Euramerica (from North America to Poland) and I also specialized in microbiological and geochemical analyses of ancient carbonate series developing a sustained collaboration with biologists of my university. We are at the origin of a paleoecological model based on the presence of iron-bacterial microfossils, which led me to travel many countries in Europe and North Africa. This model accounts for the red pigmentation of many marble and ornamental stones used in the world. This research also has implications on the emergence of Life from the earliest stages of formation of Earth, as well as in the field of exobiology or extraterrestrial life ...
More recently I invested in the study from the Precambrian series of Gabon and Congo. These works with colleagues from BRGM (Orléans) are as much about the academic side (consequences of the appearance of oxygen in the Paleoproterozoic and study of Neoproterozoic glaciations) that the potential applications in reservoir rocks and source rocks of oil (in collaboration with oil companies).
Finally I recently established a close collaboration with the Royal Institute of Natural Sciences of Belgium to study the susceptibility magnetic signal from various European Paleozoic series. All these works allowed me to gain a thorough understanding of carbonate rocks (petrology, micropaleontology, geobiology, geochemistry, sequence stratigraphy, diagenesis) as well in Precambrian (2.2 Ga and 0.6 Ga), Paleozoic (from Silurian to Carboniferous) and Mesozoic (Jurassic and Cretaceous) rocks. Recently (2010) I have established a collaboration with Iraqi Kurdistan as part of a government program to boost scientific research in this country.
My research led me to publish about 180 papers in international and national journals and presented more than 170 conference papers. I am a holder of eight courses at the ULB (5 mandatory and 3 optional), excursions and field stages, I taught at the third cycle in several French universities and led or co-managed a score of 20 Doctoral (PhD) and Post-doctoral theses and has been the promotor of more than 50 Masters theses.
On December 14, 2008, former presidential candidate Al Gore predicted the North Polar Ice Cap would be completely ice free in five years. As reported on WUWT, Gore made the prediction to a German TV audience at the COP15 Climate Conference:
In this post, we’re going to present graphs that show the annual lowest TMIN and highest TMAX Near-Land Surface Air Temperatures (not in anomaly form) for ten (10) Countries in an effort to add some perspective to global warming. The list of countries, which follows, includes the countries with the highest populations.
And, as always with my posts, as part of the text, there are hyperlinks to the data that were used to prepare the graphs. Just click on the links if you’re looking for the data.
INITIAL NOTES
First of all, TMIN is described by Berkeley Earth as the “Mean of Daily Low Temperatures”, while TMAX is described as the “Mean of Daily High Temperatures”. Berkeley Earth provides monthly TMIN and TMAX data until partway through 2013. The start month for these individual-country datasets at Berkeley Earth depends on data availability from the individual country. Sometimes they start in the early 1800s, maybe even the mid-to-late 1700s for countries to be included in future posts (like the United Kingdom), and other times they start in the mid-to-late 1800s, so I’ve chosen 1900 as the start year for this post. The year 1900 is the end year of the IPCC’s new definition of “pre-industrial” times, so starting the graphs in 1900 is also appropriate in that respect.
Three minutes is not a lot of time, so let me be brief. I’ll start with something that might shock you. There is no evidence that CO2 has a large effect on climate. The two arguments used by the IPCC to so called “prove” that humans are the main cause of global warming, and which implies that climate sensitivity is high, are that: a) 20th century warming is unprecedented, and b) there is nothing else to explain the warming.
These arguments are faulty. Why you ask?
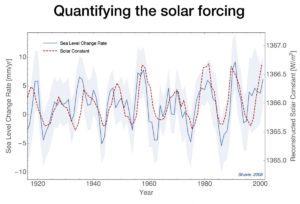
We know from the climate-gate e-mails that the hockey stick was an example of shady science. The medieval warm period and little ice ages were in fact global and real. And, although the IPCC will not admit so, we know that the sun has a large effect on climate, and on the 20th century warming in particular.
In the first slide we see one of the most important graphs that the IPCC is simply ignoring. Published already in 2008, you can see a very clear correlation between sea level change rate from tide gauges, and solar activity. This proves beyond any doubt that the sun has a large effect on climate. But it is ignored.
La COP est une conférence internationale qui depuis 24 ans tient chaque année la réunion de la dernière chance pour sauver la planète. Vous croyez peut-être que la planète avait été sauvée lors de la COP21 à Paris. Erreur. Tout reste à faire. C’est ce qui justifie la COP24, qui se tient cette année en Pologne. Le secrétariat de la COP24 publie en ligne la liste de ses participants, sur près de 1100 pages.
Plus de 21 000 participants. Sans compter les 1500 journalistes accrédités, qui sont rémunérés par leurs médias, pas par les contribuables. Ces 21 000 participants sont pour 14000 des délégués des gouvernements, et pour 6000 des représentants d’ONGs prétendument intéressées et compétentes. (Le solde est composé de membres d’organisations du système des Nations-Unies).
Le coût de la fête est élevé. Les seuls frais de déplacement et de séjour pour cette COP de 15 jours s’élèvent sans doute (sur la base de 10000 € par participant) à plus de 200 millions d’euros. On pourrait y ajouter le coût du temps passé par les participants. S’ils y passent en moyenne une semaine, cela fait 21000 semaines, soit environ 500 personnes-années. A 50000 euros/an, 25 millions d’euros, qui s’ajoutent aux frais de déplacement. C’est de quoi doubler le niveau de vie annuel de 2 ou 3 millions d’enfants au Malawi.
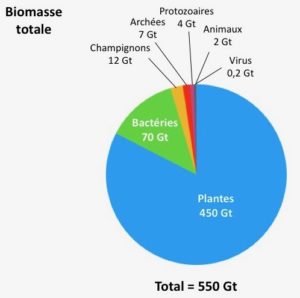
Dans un article récent de juin 2018[1], le biologiste Yinon Bar-On et ses collaborateurs ont estimé la biomasse totale de la biosphère actuelle (Bar-On et al. 2018). Pour cela, ils ont simplement estimé les nombres de bactéries, protozoaires, plantes et animaux dans tous les écosystèmes de la planète. En connaissant le poids moyen de chaque organisme, les auteurs ont ensuite réalisé des sommes. Ils arrivent au chiffre final de 550 gigatonnes (Gt) de carbone. Ce chiffre est-il élevé ? Avec quoi peut-on le comparer? Est-il précis ? Quels sont les organismes les plus importants dans la biosphère ? Quelles sont les conséquences pour le cycle du carbone, et donc pour la concentration de CO2 atmosphérique ? Voici toute une série de questions que l’on doit se poser. Nous allons voir que les résultats de Yinon Bar-On sont assez étonnants et qu’ils induisent des conséquences majeures pour le cycle du carbone dans la biosphère.
…
Figure 1. Biomasse totale de la biosphère, en gigatonnes (Gt). Bar-On et al. (2018)
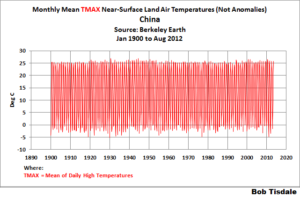
I was preparing a post using Berkeley Earth Near-Surface Land Air Temperature data that included the highest-annual TMAX temperatures (not anomalies) for China…you know, the country with the highest population here on our wonder-filled planet Earth. The graph was for the period of 1900 to 2012 (FYI, 2012 is the last full year of the local TMAX and TMIN data from Berkeley Earth). Berkeley Earth’s China data can be found here, with the China TMAX data here. For a more-detailed explanation, referring to Figure 1, I was extracting the highest peak values for every year of the TMAX Data for China, but I hadn’t yet plotted the graph in Figure 1, so I had no idea what I was about to see.
Figure 1 The results are presented in Figure 2, and they were a little surprising, to say the least.
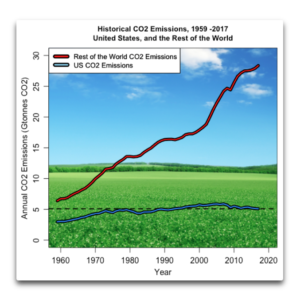
I keep reading about all kinds of crazy schemes to reduce US CO2 emissions. Now, I don’t think that CO2 is the secret knob that controls the climate. I think that the earth has a host of emergent thermoregulatory mechanisms that act to keep the temperature within narrow limits (e.g. 0.6°C temperature change over the entire 20th Century). I don’t believe the claims that the modern changes in CO2 will affect the temperature.
But solely for the purposes of this post, let’s assume that the alarmists are correct. And for purposes of discussion only, let’s assume that the Earth’s temperature is free to go up and down any amount. Let’s assume that CO2 is, in fact, the secret control knob that controls the temperature of the earth. And let’s further assume that the pundits are right that the “climate sensitivity” is three degrees of warming for every doubling of CO2.
And finally, let’s assume that in 2018 the US magically stopped emitting any CO2 at all.
With all of those assumptions as prologue, here’s the question of interest.
Other things being equal, if the US stopped emitting CO2 entirely in 2018, and stayed at zero CO2 emissions indefinitely, how much cooler would that make the planet in the year 2050?
Five degrees cooler? Two degrees? One degree?
…
Figure 1. Historical CO2 emissions. Data from CDIAC and BP Statistical Review of World Energy
Patricia Adams is an economist and the executive director of Probe International, a Toronto based NGO that has been involved in the Chinese environmental movement since its beginnings in the mid-1980s.
She is confirming much of what I have said in recent years. The only thing I would take issue with his her description of there being a U-Turn. In my view, China never had the slightest intention of being serious about cutting emissions.
La conférence sur le climat de Katowice bat son plein et diverses initiatives visant à réduire les émissions de dioxyde de carbone sont à l’ordre du jour : manger moins de viande, se chauffer moins, prendre moins l’avion. Dans ce dernier cas, bien sûr, la conférence confine elle-même à l’absurde.
Il aurait été facile de transformer la conférence en une réunion sur Internet avec retransmission en direct et commentaires en ligne. Mais il aurait manqué quelque chose à ce long et merveilleux voyage d’affaires avec ses réceptions, ses indemnités journalières et ses réunions d’avant Noël entre sauveteurs du climat. Cette fois-ci, plus de 22 000 participants se sont rendus en Pologne, la plupart confortablement en avion. Les délégations les plus nombreuses à la Conférence sur le climat venaient d’Afrique.
La Guinée envoie 406 délégués cette année, la République démocratique du Congo y est présente avec 237 participants et la Côte d’Ivoire envoie 191 ressortissants en Pologne. La liste des participants est disponible sur la page d’accueil de la conférence en format pdf et compte 1084 pages.
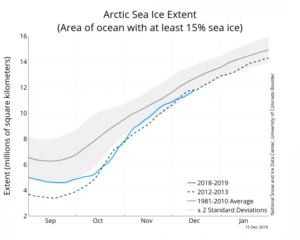
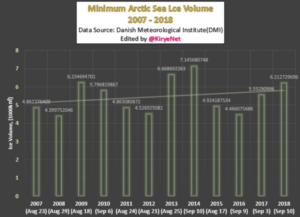
The media, alarmist scientists and many leading policymakers often tell the public “the Arctic is rapidly melting”. And if a poll were done today, a vast majority of the people in Japan and elsewhere would say this is true. Unfortunately they have become the victims of “fake news”.
Luckily we have some hard data from the Arctic. And if one looks at them, it is true that sea ice has seen a declining trend – if we go back 40 years.
Yet, if we look at the past 12 years, we see that the trend for minimum has stopped, and one could argue even reversed:
“The results of this review point to the extreme value of CO2 to all life forms, but no role of CO2 in any significant change of the Earth’s climate. … Many believe and/or support the notion that the Earth’s atmosphere is a ‘greenhouse’ with CO2 as the primary “greenhouse” gas warming Earth. That this concept seems acceptable is understandable—the modern heating of the Earth’s atmosphere began at the end of the Little Ice Age in 1850. The industrial revolution took hold about the same time. It would be natural to believe that these two events could be the reason for the rise in temperature. There is now a much clearer picture of an alternative reason for why the Earth’s surface temperature has risen since 1850.”
“There is no correlation of CO2 with temperature in any historical data set that was reviewed”.
Last year’s oceanic heat wave wasn’t as destructive as one the year before, scientists said.
The Great Barrier Reef fared better during an oceanic heat wave last year than during sizzling weather a year earlier that caused hundreds of miles of corals to bleach, according to a study published Monday that suggests the massive structure may be growing more tolerant to climate change.
The report in the journal Nature Climate Change analyzed how corals along the Great Barrier fared in back-to-back mass bleaching events. The reef ― a UNESCO World Heritage Site and the largest living structure on the planet ― was cooked by overheated seawater in 2016 and again in 2017, with images of sickly white coral horrifying people around the globe.
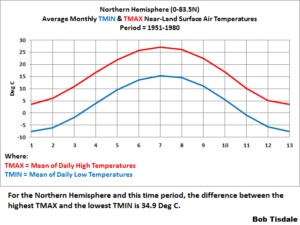
In this post, we’re going to present monthly TMIN and TMAX Near-Land Surface Air Temperature data for the Northern and Southern Hemispheres (not in anomaly form) in an effort to add a little perspective to global warming. And at the end of this post, I’m asking for your assistance in preparing a post especially for you, the visitors to this wonderful blog WattsUpWithThat.
INTRODUCTION FOR THE “GLOBAL WARMING IN PERSPECTIVE” SERIES
A small group of international unelected bureaucrats who serve the United Nations now wants to limit the rise of global land+ocean surface temperatures to no more 1.5 deg C from pre-industrial times…even though we’ve already seen about 1.0 deg C of global warming since then. So we’re going to put that 1.0 deg C change in global surface temperatures in perspective by examining the ranges of surface temperatures “we’ve been used to” on our lovely shared home Earth.
Le système d’échange de quotas d’émission de l’UE,connu sous l’acronyme SEQE-EU ou en anglais EU ETS, est instrument utilisé pour réduire les émissions de Gaz à Effet de Serre (GES) ou de CO2 pour faire court. Il repose sur un principe de plafonnement et d’échange des droits d’émission. Il a été adopté par la Commission Environnement du Parlement européen, le 13 octobre 2003.
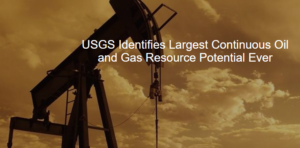
The “amazing” thing is that this isn’t a “new” oil discovery. It’s just a realization that a lot more oil and gas can be produced from these formations than was previously imagined.
The Permian Basin a nearly infinite resource. It seems as if there will always be more hydrocarbons to squeeze out of its numerous oil & gas reservoirs. From a Warmunist perspective the Bone Spring and Wolfcamp are much worse than previously thought…
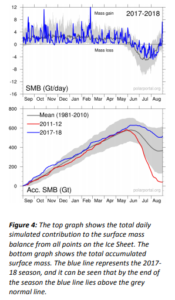
The Danish Meteorological Institute (DMI) also performs daily simulations of how much ice or water the Ice Sheet loses or accumulates. Based on these simulations, an overall assessment of how the surface mass balance develops across the entire Ice Sheet is obtained (Fig. 4).
At the end of the 2018 season (31 August 2018), the net surface mass balance was 517 Gt, which means that 517 Gt more snow fell than the quantity of snow and ice that melted and ran out into the sea. This number only contains the balance at the surface, and thus not the total balance, which also includes melting of glaciers and calving of icebergs.
…
Although the total SMB (Surface Mass Budget) for the 2016-2017 and 2017-2018 seasons are similar, development during the two seasons has been very different. Last year, the season began by gaining a lot of mass during the winter, whilst the development in SMB from the summer onwards reflected the long-term average. During the 2017-2018 season, SMB remained in line with the average from 1981-2010 until the summer, after which the development in SMB was higher than average.
For the past 50 years, scientists have been studying climate change and the possibility of related sea level changes resulting from melting ice and warming oceans. Despite the common belief that increasing levels of carbon dioxide (CO2) in our atmosphere could result in catastrophic sea level rise, there is no evidence to support this fear. Tax monies spent trying to solve this non-existent problem are a complete waste.
The polar regions of the Earth have long been depicted as canary-in-the-coal-mine sentinels of climate change, given that climate models project that CO2-induced global warming will manifest itself here, first and foremost, compared to other planetary latitudes. Consequently, researchers are frequently examining the Arctic and Antarctic for evidence of recent climate change.
…
Clearly, as demonstrated here and in other studies (see, for example, The Antarctic Peninsula: No Longer the Canary in the Coal Mine for Climate Alarmists and the references therein) there is a canary in the Antarctic alright, but it is alive and well. And these counter-observations do not bode well for climate models and their projections of CO2-induced global warming.
Figure 1. Surface mass-balance records for glaciers around the northern Antarctic Peninsula. Source: Engel et al. (2018).
Judith Curry, one of climate science’s most vocal critics, is leaving academe because of what she calls the poisonous nature of the scientific discussion around human-caused global warming.
Global carbon dioxide emissions will likely hit record highs this year, according to a new report released Wednesday as United Nations diplomats meet in Poland to hash out details of the Paris climate accord.
Global emissions will rise roughly 3 percent to 37.1 gigatons in 2018, according to the Global Carbon Project (GCP).
The rise in emissions was largely fueled by an uptick in coal-fired power generation in China and India.
“Emissions in China, India, and the US are expected to increase in 2018, while emissions in the [European Union] are expected to decline, and all other countries combined will most likely increase,” reads the report by GCP, which tracks emissions.
The first International Polar Year, held over 1882–1883, was an important event for science. The year was the brainchild of Austrian explorer Karl Weyprecht who, after a few years on different research missions, realised that scientists were missing the big picture by not sharing information with each other.
In 1875, at the annual meeting of German Scientists and Physicians in Graz, Austria, he proposed the setting up of an observational network of research stations to monitor the Arctic climate. It was the beginning of collaborative research in the region. Today, data collected 134 years ago on temperature, air pressure, or wind speed is still freely available.
There have been two more International Polar Year events since that inaugural one, most recently in 2007–2008, along with numerous other collaborative expeditions and research missions aimed at understanding aspects of Arctic biology, ecology, climate or geology.
…
La géologie, une science plus que passionnante … et diverse