
by N. Scafetta, Feb 3, 2023 in MDPI, Earth Science
Global climate models (GCMs) from the sixth Coupled Model Intercomparison Project Phases (CMIP6) have been employed to simulate the twenty-first-century temperatures for the risk assessment of future climate change. However, their transient climate response (TCR) ranges from 1.2 to 2.8 °C, whereas their equilibrium climate sensitivity (ECS) ranges from 1.8 to 5.7 °C, leading to large variations in the climatic impact of an anthropogenic increase in atmospheric CO2 levels. Moreover, there is growing evidence that many GCMs are running “too hot” and are hence unreliable for directing policies for future climate changes. Here, I rank 41 CMIP6 GCMs according to how successfully they hindcast the global surface warming between 1980 and 2021 using both their published equilibrium climate sensitivity (ECS) and transient climate response (TCR) estimates. The sub-ensemble of GCMs with the best performance appears to be composed of the models with ECS ranging between 1.8 and 3.0 °C (which confirms previous studies) and TCR ranging between 1.2 and 1.8 °C. This GCM sub-ensemble is made up of a total of 17 models. Depending on the emission scenarios, these GCMs predict a 2045–2055 warming of 1.5–2.5 °C compared to the pre-industrial era (1850–1900). As a result, the global aggregated impact and risk estimates seem to be moderate, which implies that any negative effects of future climate change may be adequately addressed by adaptation programs. However, there are also doubts regarding the actual magnitude of global warming, which might be exaggerated because of urban heat contamination and other local non-climatic biases. A final section is dedicated to highlighting the divergences observed between the global surface temperature records and a number of alternative temperature reconstructions from lower troposphere satellite measurements, three-ring-width chronologies, and surface temperature records based on rural stations alone. If the global warming reported by the climate records is overestimated, the real ECS and TCR may be significantly lower than what is produced by the CMIP6 GCMs, as some independent studies have already suggested, which would invalidate all of the CMIP6 GCMs.…


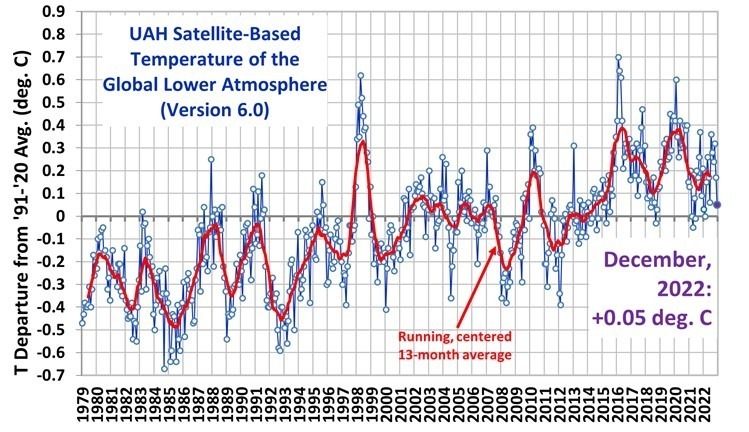


 Figure 1: UAH global temperature anomaly