by Jean Van Vliet, 14 août 2020, in ScienceClimatEnergie
Introduction
Suite à la prise de conscience à la fin du 20ème siècle d’une hausse inhabituelle des températures terrestres, des chercheurs américains ont développé une théorie du réchauffement global basé sur l’effet de serre dû au CO2 [1], en soulignant la responsabilité possible de l’homme dans le réchauffement observé: la poursuite des émissions de CO2 conduirait à une éventuelle catastrophe planétaire. Ces chercheurs ont présenté leur théorie au Congrès américain [2] et aux médias. Le monde politique international a réagi rapidement à cet alarmisme [3] en permettant à Assemblée Générale de l’ONU de décembre 1988 d’approuver la mise en place du GIEC [4].
Depuis plus de trente ans et malgré le manque persistant de preuve formelle, la peur du réchauffement global anthropique causé par le CO2 est propagée sans relâche par l’ONU et ses satellites PNUE, GIEC et OMM relayés par les ONG environnementales et les médias, suivis plus récemment par une fraction du monde académique occidental. Une puissante industrie des énergies renouvelables a été créée via des subsides et des certificats verts quitte à doubler ou tripler le prix de l’électricité. Cette industrie est prête à exploiter les nouvelles aubaines financières annoncées par l’Accord de Paris et le Green Deal de l’UE. Dans un tel contexte, le but avoué est que l’humanité change radicalement son comportement, fût-ce au prix d’une dictature environnementale: l’alarmisme médiatique est maximal, et même les enfants sont embrigadés dans le débat pour soi-disant “sauver la planète”.
Cette tentative rampante de prise du pouvoir a cependant buté contre un obstacle imprévu depuis le début de 2020, à savoir la pandémie du Coronavirus: le lockdown sanitaire a montré que la société pouvait changer son comportement de manière spectaculaire, mais au prix de conséquences économiques et sociales majeures. A la première attaque de la pandémie succède aujourd’hui une deuxième vague et il semble impossible de prévoir quand nous serons délivrés du virus.
Les ressources des Etats n’étant pas infinies, la question brûlante se pose aujourd’hui de l’affectation des moyens humains et financiers disponibles en fonction nos priorités: devons-nous avoir davantage peur d’une pandémie et de ses conséquences sociales et économiques incontestables ou devons-nous supputer une explosion incontrôlable de la crise climatique amorcée au 20ème siècle et modifiant de manière drastique et irréversible notre environnement ?
Le but du présent article est d’apporter des éléments de réponse à cette question en examinant, dans une perspective scientifique large et basée sur les observations plutôt que sur les modèles, la “crise climatique” démarrée durant la seconde moitié du 20ème siècle en essayant de tirer des conclusions applicables au 21èmesiècle.
1/ La crise ‘climatique du 20ème siècle
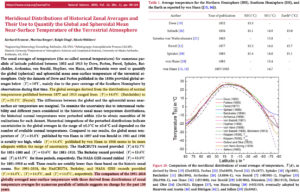
Il existe de nombreuses sources fournissant des historiques de température, mais il existe peu de séries chronologiques comparables à celle de l’Observatoire d’Armagh en Irlande du Nord pour la période 1796-2002 [5]; cette série est disponible sur le site web du Met Office britannique pour la période allant de 2002 à aujourd’hui [6].
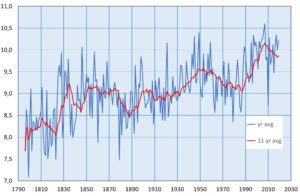
Figure 1 : Evolution des températures moyennes annuelles de 1796 à 2019 (courbe bleue) ainsi qu’une courbe lissée correspondant à la moyenne glissante rétrospective sur une période de 11 ans (courbe rouge).
…