Tous les articles par Alain Préat

Full-time professor at the Free University of Brussels, Belgium apreat@gmail.com apreat@ulb.ac.be • Department of Earth Sciences and Environment Res. Grp. - Biogeochemistry & Modeling of the Earth System Sedimentology & Basin Analysis • Alumnus, Collège des Alumni, Académie Royale de Sciences, des Lettres et des Beaux Arts de Belgique (mars 2013). http://www.academieroyale.be/cgi?usr=2a8crwkksq&lg=fr&pag=858&rec=0&frm=0&par=aybabtu&id=4471&flux=8365323 • Prof. Invited, Université de Mons-Hainaut (2010-present-day) • Prof. Coordinator and invited to the Royal Academy of Sciences of Belgium (Belgian College) (2009- present day) • Prof. partim to the DEA (third cycle) led by the University of Lille (9 universities from 1999 to 2004) - Prof. partim at the University of Paris-Sud/Orsay, European-Socrates Agreement (1995-1998) • Prof. partim at the University of Louvain, Convention ULB-UCL (1993-2000) • Since 2015 : Member of Comité éditorial de la Revue Géologie de la France http://geolfrance.brgm.fr • Since 2014 : Regular author of texts for ‘la Revue Science et Pseudosciences’ http://www.pseudo-sciences.org/ • Many field works (several weeks to 2 months) (Meso- and Paleozoic carbonates, Paleo- to Neoproterozoic carbonates) in Europe, USA (Nevada), Papouasia (Holocene), North Africa (Algeria, Morrocco, Tunisia), West Africa (Gabon, DRC, Congo-Brazzaville, South Africa, Angola), Iraq... Recently : field works (3 to 5 weeks) Congo- Brazzaville 2012, 2015, 2016 (carbonate Neoproterozoic). Degree in geological sciences at the Free University of Brussels (ULB) in 1974, I went to Algeria for two years teaching mining geology at the University of Constantine. Back in Belgium I worked for two years as an expert for the EEC (European Commission), first on the prospecting of Pb and Zn in carbonate environments, then the uranium exploration in Belgium. Then Assistant at ULB, Department of Geology I got the degree of Doctor of Sciences (Geology) in 1985. My thesis, devoted to the study of the Devonian carbonate sedimentology of northern France and southern Belgium, comprised a significant portion of field work whose interpretation and synthesis conducted to the establishment of model of carbonate platforms and ramps with reefal constructions. I then worked for Petrofina SA and shared a little more than two years in Angola as Director of the Research Laboratory of this oil company. The lab included 22 people (micropaleontology, sedimentology, petrophysics). My main activity was to interpret facies reservoirs from drillings in the Cretaceous, sometimes in the Tertiary. I carried out many studies for oil companies operating in this country. I returned to the ULB in 1988 as First Assistant and was appointed Professor in 1990. I carried out various missions for mining companies in Belgium and oil companies abroad and continued research, particularly through projects of the Scientific Research National Funds (FNRS). My research still concerns sedimentology, geochemistry and diagenesis of carbonate rocks which leads me to travel many countries in Europe or outside Europe, North Africa, Papua New Guinea and the USA, to conduct field missions. Since the late 90's, I expanded my field of research in addressing the problem of mass extinctions of organisms from the Upper Devonian series across Euramerica (from North America to Poland) and I also specialized in microbiological and geochemical analyses of ancient carbonate series developing a sustained collaboration with biologists of my university. We are at the origin of a paleoecological model based on the presence of iron-bacterial microfossils, which led me to travel many countries in Europe and North Africa. This model accounts for the red pigmentation of many marble and ornamental stones used in the world. This research also has implications on the emergence of Life from the earliest stages of formation of Earth, as well as in the field of exobiology or extraterrestrial life ... More recently I invested in the study from the Precambrian series of Gabon and Congo. These works with colleagues from BRGM (Orléans) are as much about the academic side (consequences of the appearance of oxygen in the Paleoproterozoic and study of Neoproterozoic glaciations) that the potential applications in reservoir rocks and source rocks of oil (in collaboration with oil companies). Finally I recently established a close collaboration with the Royal Institute of Natural Sciences of Belgium to study the susceptibility magnetic signal from various European Paleozoic series. All these works allowed me to gain a thorough understanding of carbonate rocks (petrology, micropaleontology, geobiology, geochemistry, sequence stratigraphy, diagenesis) as well in Precambrian (2.2 Ga and 0.6 Ga), Paleozoic (from Silurian to Carboniferous) and Mesozoic (Jurassic and Cretaceous) rocks. Recently (2010) I have established a collaboration with Iraqi Kurdistan as part of a government program to boost scientific research in this country. My research led me to publish about 180 papers in international and national journals and presented more than 170 conference papers. I am a holder of eight courses at the ULB (5 mandatory and 3 optional), excursions and field stages, I taught at the third cycle in several French universities and led or co-managed a score of 20 Doctoral (PhD) and Post-doctoral theses and has been the promotor of more than 50 Masters theses.

ALL-TIME RECORD SNOWFALL BURIES PARTS OF SWEDEN — 3.25 M (10.7 FT) — DON’T TELL GRETA…

by Cap Allon, March 19, 2020 in Electroverse


The first flakes of the season in Kiruna, Sweden fell back on Sept 30 and from then on have continued relentlessly, with accumulations now comfortably surpassing the region’s all-time snowfall record.

The cold times are returning in line with historically low solar activitycloud-nucleating Cosmic Rays, and a meridional jet stream flow.

NASA has recently revealed this upcoming solar cycle (25) will be “the weakest of the past 200 years,” with the agency correlating previous solar shutdowns to prolonged periods of global cooling here.


https://globalcryospherewatch.org/

A chunk of Yellowstone the size of Chicago has been pulsing. Why?

by R.G. Andrews, March 19, 2020 in NationalGeographic


An injection of magma under Norris Geyser Basin may be why the region is five inches higher today than it was 20 years ago.

In northwestern Wyoming, in the center of Yellowstone National Park, a bubbling caldera is the scar of a 640,000-year-old, gargantuan volcanic eruption. The 3,472-square-mile park encompassing the caldera is filled with geologic wonderlands of sprouting geysers and effervescing pools, all ultimately driven by magma and superheated fluids churning in the rock below the surface.

One of these areas, Norris Geyser Basin to the northwest of the caldera, contains more than 500 hydrothermal features. These tempestuous geysers and pools often change from day to day, but a much larger transformation has been taking place as well: For more than two decades, an area larger than Chicago centered near the basin has been inflating and deflating by several inches in erratic bursts. In a hyperactive volcanic region like Yellowstone, the exact causes of any specific movement are difficult to pin down. But a recent study in the Journal of Geophysical Research: Solid Earth may help explain why this pocket of land has been breathing in and out.

“In all likelihood, Norris has been a center of deformation for a very long time,” says Daniel Dzurisin, a research geologist at the U.S. Geological Survey’s Cascades Volcano Observatory and one of the co-authors of the new research.

Norris Geyser Basin, Yellowstone National Park, Wyoming.
PHOTOGRAPH BY MARC MORITSCH, NAT GEO IMAGE COLLECTION

North Atlantic Oscillation

by P. Homewood, March 19, in NotaLotofPeopleKnowThat


If you had not noticed (!), it has been a mild and wet start to the year here in the UK, and also across in NW Europe.

No doubt this will be linked to global warming in due course, but in fact it is simply weather, as the CET chart below proves:

Since the year started, temperatures have consistently been within the normal band. In other the sort of temperatures commonly seen at this time of year.

However, they have also been consistently in the top half of that band, rather than being spread between cold and warm, as would happen most years.

The reason for the weather we have had is, of course, the jet stream, or more precisely the North Atlantic Oscillation (NAO), which has been strongly and stubbornly positive all winter.

The Norwegian Centre for Climate Research CICERO spotted this mild weather coming back in December, and commented on 6th January:

The unusual warm temperatures this winter and forecasts indicating milder winter conditions for January, February and March in Europe are partly due to an atmospheric circulation pattern called the North Atlantic Oscillation, or NAO. This atmospheric circulation pattern explains well the weather we get in Europe, especially in winter.

https://cicero.oslo.no/no/posts/nyheter/unseasonal-temperatures-for-norway#


Our own Met Office explains the NAO phenomenon:


How exactly do they plan to replace fossil fuels?

by P. Driessen, March 16, 2020 in WUWT


They want to ban coal, oil and gas. Exactly how will they replace them? Who wins? Who loses?

Berkeley, CA, Takoma Park, MD and other cities; California, Connecticut, New York, Virginiaand other states; Germany, England and other countries; the European Union – all plan to banish oil, natural gas and coal within 10, 20 or 30 years. A number of US states have joined Regional Greenhouse Gas Initiatives and proudly say We Are Still Inthe Paris climate treaty, no matter what President Trump says or does.

Forget the headlines and models, and look at hurricane, tornado, sea level and other historic records. There is no crisis, no unprecedented warming or weather events, certainly nothing that proves humans have replaced the powerful natural forces that have always driven climate changes and weather events.

But for now, let’s just examine their zero-carbon plans. How exactly will they make this happen? Where do they plan to get the turbines, panels and batteries? the raw materials to manufacture them? How do they plan to function as modern societies with pricey, erratic energy and frequent power disruptions?


Continuer la lecture de How exactly do they plan to replace fossil fuels?

New research first to relate Antarctic sea ice melt to weather change in tropics

by C. Rotter, March 16, 2020 in WUWT


Diminishing sea ice translates to warmer ocean, more rain, and stronger trade winds.
University of California – San Diego

Arctic and Antarctic ice loss will account for about one-fifth of the warming that is projected to happen in the tropics, according to a new study led by Mark England, a polar climate scientist at Scripps Institution of Oceanography at the University of California San Diego, and Lorenzo Polvani, the Maurice Ewing and J. Lamar Worzel Professor of Geophysics at Columbia Engineering, England’s doctoral supervisor.

While there is a growing body of research showing how the loss of Arctic sea ice affects other parts of the planet, this study is the first to also consider the long-range effect of Antarctic sea ice melt, the research team said.

“We think this is a game-changer as it shows that ice loss at both poles is crucial to understanding future tropical climate change,” England said of the study funded by NASA and the National Science Foundation. “Our study will open a hitherto unexplored direction and motivate the science community to study the large effects that Antarctic sea ice loss will have on the climate system.”

Greenhouse Gases Not Behind The End Of The Warming Pause

by Dr A. Ollila, March 16, 2020 in ClimateChange Dispatch


During the years 2000-2014, the global temperature hardly increased, and that period has been called the temperature pause or hiatus.

The debate among the climate community has resulted in more than 200 research studies in some cases with opposite results about the reasons.

This amount of papers can be compared to the research studies of Earth’s energy balance and the greenhouse effect. I have found about 10 publications for both subjects.

During the years 2000-2014, the emissions of carbon dioxide were 126 gigatons carbon (GtC) being 31% of the total emission after 1750, but the greenhouse (GH) gases were not able to increase the temperature.

According to the IPCC, the temperature increase should have been 0.4°C from 2000 to 2014 (Ref. 1).

It looks like that the pause ended to the super El Nino 2015-2016 because the temperature has been thereafter about 0.2 °C above-the-pause average.

Research study about the pause and the ENSO

The impulse for my research study came from a story figure on WUWT that showed shortwave (SW) radiation variations during the pause.

A curve showed increased values around El Nino 2015-16 and thereafter. I decided to find out what could be the impact of this finding on the temperatures.

In Fig. 1, I have depicted the total solar irradiance (TSI), SW radiation and LW radiation from 2000 onward. This data is available from the CERES databank maintained by NASA.

Fig.1. TSI, SW radiation and LW radiation trends normalized to the altitude of 20 kilometers.

The List Grows – Now 100+ Scientific Papers Assert CO2 Has A Minuscule Effect On The Climate

by K. Richard, December 12, 2019 in NoTricksZone


Within the last few years, over 50 papers have been added to our compilation of scientific studies that find the climate’s sensitivity to doubled CO2 (280 ppm to 560 ppm) ranges from <0 to 1°C. When no quantification is provided, words like “negligible” are used to describe CO2’s effect on the climate. The list has now reached 106 scientific papers.

Link: 100+ Scientific Papers – Low CO2 Climate Sensitivity

A few of the papers published in 2019 are provided below.

Krainov and Smirnov, 2019  (2X CO2 = 0.4°C, 2X anthroCO2 = 0.02°C)

“The greenhouse phenomenon in the atmosphere that results from emission of its molecules and particles in the infrared spectrum range is determined by atmospheric water in the form of molecules and microdrops and by carbon dioxide molecules for the Earth atmosphere and by carbon dioxide molecules and dust for the Venus atmosphere. The line-by-line method used the frequency dependent radiative temperature for atmospheric air with a large optical thickness in the infrared spectral range, allows one to separate emission of various components in atmospheric emission. This method demonstrates that the removal of carbon dioxide from the Earth’s atmosphere leads to a decrease of the average temperature of the Earth’s surface by 4 K; however, doubling of the carbon dioxide amount causes an increase of the Earth’s temperature by 0.4 K from the total 2 K at CO2 doubling in the real atmosphere, as it follows from the NASA measurements. The contribution to this temperature change due to injections of carbon dioxide in the atmosphere due to combustion of fossil fuel, and it is 0.02 K. The infrared radiative flux to the Venus surface due to   CO2 is about 30% of the total flux, and the other part is determined by a dust.”

PETITION OF THE CENTER FOR THE STUDY OF CARBON DIOXIDE AND GLOBAL CHANGE …

by EPA, March 9, 2020 in CO2Science


Table of Contents .pdf (138p.)

I. Introduction  4

II. Scientific observations reveal rising greenhouse gases present no imminent threat to human health and welfare . 5

A. There is nothing unusual or unnatural about Earth’s current warmth or rate of warming. Historic and modern records of atmospheric CO2 and temperature violate established principles of causation. Model-based temperature projections since 1979 artificially inflate warming (compered to observations) by a factor of three, invalidating the models and all their ancillary claims associated with greenhouse gas-induced warming5

B. Observations reveal key adverse effects of greenhouse gas-induced warming are not occurring despite EPA predictions they should be worsening16

  1. How to Properly Test for a CO2-induced Influence on Extreme Weather 17
  2. Extreme Weather Observations and Trends 24 (i)Hurricanes 24 (ii)
  3. Storms29 (iii) Floods34 (iv) Drought 37 (v) Fires. 40
  4. Temperature-induced Mortality 45
  5. Sea Level Rise 50

III. CO2 emissions and fossil energy use initiated, and continue to sustain, the industrial revolution and the many human and environmental benefits that have emerged therefrom, which benefits have enhanced human health and welfare 56


UN should change course on climate

by D. Woljick, March 15, 2020 in CFACT


The UN’s climate action machinery is on the verge to collapse, beginning this November in Glasgow, Scotland. This time the annual climate summit, called COP 26, is most likely to end in complete disarray, even more than COP 25 did last year in Madrid, Spain.

The failure of COP 25 was widely noted with sadness, but Madrid was a minor COP, with little of substance on the table. In contrast COP 26 is hugely important. When it fails, the UN has to rethink its entire approach to climate action.

One of the six principles stated in CLINTEL’s World Climate Declaration captures the situation very succinctly. It says “Climate policy must respect scientific and economic realities.” If it does not, such a policy must fail. See https://clintel.org/world-climate-declaration/.

Continuer la lecture de UN should change course on climate

ESO telescope observes exoplanet where it rains iron

by C. Rotter, March 13, 2020 in WUWT


Researchers using ESO’s Very Large Telescope (VLT) have observed an extreme planet where they suspect it rains iron. The ultra-hot giant exoplanet has a day side where temperatures climb above 2400 degrees Celsius, high enough to vaporise metals. Strong winds carry iron vapour to the cooler night side where it condenses into iron droplets.

“One could say that this planet gets rainy in the evening, except it rains iron,” says David Ehrenreich, a professor at the University of Geneva in Switzerland. He led a study, published today in the journal Nature, of this exotic exoplanet. Known as WASP-76b, it is located some 640 light-years away in the constellation of Pisces.

This strange phenomenon happens because the ‘iron rain’ planet only ever shows one face, its day side, to its parent star, its cooler night side remaining in perpetual darkness. Like the Moon on its orbit around the Earth, WASP-76b is ‘tidally locked‘: it takes as long to rotate around its axis as it does to go around the star.

Despite Mild Winter, Europe February Mean Temperatures Show No Warming Over Three Decades

by P. Gosselin, March 13, 2020 in NoTricksZone


By Kirye
and Pierre Gosselin

It’s been a particularly mild winter in Europe this year. But that hasn’t changed the long-term trend over the past 30 years.

Now that the February 2020 data have been coming in, we plot the mean February temperatures for some countries in Europe.

Sweden

Three of 5 stations show February mean temperature in Greta Thunberg’s Sweden have had a cooling trend since 1988! The real data will probably make the climate alarmists upset.

Les glaces terrestres, la cryosphère (1/3)

by J.C. Maurin, 13 mars 2020 in ScienceClimatEnergie


On désigne par cryosphère l’ensemble des glaces terrestres. Son évolution, lors des dernières décennies, est souvent présentée comme préoccupante: il en résulterait une forte hausse des niveaux marins et un changement d’albédo et donc du bilan énergétique de la Terre. Cette première partie de l’article présentera quelques ordres de grandeurs pour les glaces terrestres.
On utilisera principalement les données du chapitre 4 du rapport AR5 WG1 (5th Assessment Report, Working Group 1) qui a été publié en 2013 par l’organisme intergouvernemental GIEC.


4. Conclusions

  • La cryosphère c’est en premier lieu les zones proches du pôle Sud : banquises et glaciers ne représentent ensemble que 0,7% du volume de la cryosphère alors que la seule partie Est de l’Antarctique, bien moins connue, représente plus de 75% de la cryosphère, soit 107 fois plus.
  • La simple correction du volume de glace en Antarctique, entre les rapports du GIEC AR4 (2007) et AR5 (2013), est 4 fois plus grande que le volume (Banquises + Glaciers).
  • Les variations actuelles de la cryosphère restent négligeables si on les compare à celles du passé : l’ensemble des glaces terrestres, il y a 20 millénaires, devait avoir un volume au moins double du volume actuel. En effet, la fonte des glaces (entre -18 ka et -8 ka) fait monter le niveau des océans de ≈ 120 m  contre 66 m SLE (Sea Level Equivalent à la Figure 1).

La deuxième partie de l’article (2/3) commentera les choix rédactionnels du GIEC pour le chapitre 4 de l’AR5 et donnera des ordres de grandeurs complémentaires pour les banquises et les glaciers.

ESA STUDY REVEALS THE 2019 “HORRIFIC” AMAZON FIRE SEASON WAS ACTUALLY INLINE WITH THE 2001-2018 AVERAGE

by Poppaloff, March11, 2020 in Electroverse


Never has the phrase “don’t believe the hype” been so relevant.

Last year media outlet after media outlet pumped the horror of the fires in the Amazon: “The Earth is burning up – The Earth is burning up.” However, the latest study released from the ESA points to the fact that last year’s burn, although 70% up on the previous year, was in fact in line with the previous seventeen years of acreage burn figures.

“While forest fires are common in the Amazon, they vary considerably from year-to-year driven by changes in climate, as well as variations in deforestation and forest degradation,” the ESA wrote.

The 2019 fires triggered an international demand for updated information about active fires, most importantly in Brazil. However, these figures were never compared to the number of blazes over a longer time period, reads a watchers.news article.

Using information from ESA’s Fire CCI project, researchers studied fire-ravaged areas in South America in 2018 and 2019, then compared the data to the annual average from 2001 to 2018. The report indicated that the total burned area in South America was roughly 70 percent more in 2019 as compared to the same period of 2018– however, only a fraction more than the annual average over the previous 17 years:


Continuer la lecture de ESA STUDY REVEALS THE 2019 “HORRIFIC” AMAZON FIRE SEASON WAS ACTUALLY INLINE WITH THE 2001-2018 AVERAGE

Study: No Evidence Ocean Acidification Harms Coral Reef Fish Behavior

by C. Idso, March10, 2020 in ClimateChangeDispatch


Paper Reviewed: Clark, T.D., Raby, G.D., Roche, D.G., Binning, S.A., Speers-Roesch, B., Jutfelt, F. and Sundin, J. 2020. Ocean acidification does not impair the behavior of coral reef fishes. Nature 577: 370-375.

In an incredibly important and revealing paper published in the journal Nature, Clark et al. (2020) write that “establishing a robust and independently replicated database of the effects of ocean acidification on fishes is essential to gain a reliable understanding of the consequences of climate change on marine ecosystems.”

Such a database, they add, is critical “before drawing broad conclusions and implementing management measures.”

Unfortunately, too many have been far too eager to jump to conclusions when it comes to estimating the impacts of ocean acidification.

And in this regard, Clark et al. note that “a number of highly publicized studies have reported detrimental effects of elevated CO2 levels on the sensory systems and behaviors of fishes, with coral reef fishes appearing to be the most sensitive despite experiencing large daily and seasonal fluctuations in nature (for example, 100-1,300 µatm).”

Such projected detrimental effects include “alterations in olfaction, hearing, vision, learning, behavioral lateralization, activity levels, boldness, anxiety, and susceptibility to predation,” which have led to “dire predictions for fish populations and marine ecosystems.”

But how solid is this body of research?

Clark et al. note there are two important red flags that call the pessimistic ocean acidification projections of fish into question.

Delingpole: Wikipedia Airbrushes List of Climate Sceptic Scientists Out of History

by J. Delingpole, March 9, 2020 in WUWT


Wikipedia has deleted its ‘List of Scientists Who Disagree with the Scientific Consensus on Global Warming’.

Stalin — who set the template for airbrushing inconvenient people out of history — would no doubt have heartily approved of this wanton act of censorship.

But what would probably have pleased him more is the magnificently twisted justification offered by the editor responsible.


Full text here

‘This Is Masochism’: Russia Wages An Oil War Against Saudi Arabia, US Amid Coronavirus Concerns

by C. Rotter, March 9, 2020 in WUWT


Oil prices dropped Monday as Saudi Arabia and Russia haggle over whether to reduce crude production amid fears that coronavirus will hamper air travel and potentially wreck the global economy.

Prices fell into the $30s as the Saudis push for a cut in output to prop up prices, while Russia went the other way, and decided to infuse the market with hundreds of thousands of barrels of oil, according to The Washington Post. Moscow is worried that the U.S. will use shale oil to take advantage if Saudi Arabia ease off production.

Basement-low oil prices could substantially impact oil companies and the global markets, which are already being hurt by fears related to coronavirus. Brent crude dropped to $35 per barrel; and the price of West Texas Intermediate crude fell to $32 from $41 per barrel, a four-year low.

“From the point of view of Russian interests, this deal [to cut production] is simply meaningless,” Mikhail Leontiev, a spokesman for the Russian oil giant Rosneft, told a Russian media outlet Sunday night.

He said the U.S. would be sure to step up shale production if production is cut.(RELATED: REPORT: Chinese Censors Jumped In To Suppress Online Messages Warning About Coronavirus Spread)

More On Earth’s Meaningless Global Temperature, Now And Before

by J. Moseley, March 9, 2020 in ClimateChangeDispatch


Is planet Earth warming, cooling, or staying the same? I often challenge advocates for climate alarmism: what is the temperature of the planet today?

Or we can use any specific day in recent years for which data are available. We cannot know the temperature of the planet thousands or millions of years ago if we cannot even measure it today.

Yes, the question is one single temperature of the entire planet. Not the temperature in Nome, Alaska, or Dallas, Texas, or Sydney, Australia, or in your hometown.

One single temperature reading for the entire globe. To put it that way immediately sounds strange.

But if we don’t have a single temperature reading for the entire planet for today, how can we say if the planet is getting warmer or cooler or not changing at all?

We cannot talk about the temperature in, say, Geneva or London or New York City only. The question is whether the entire planet is getting warmer, not isolated cities.

Some of us have forgotten basic statistics. Some avoided it in school. But most of us are vaguely familiar with the random sampling process used in public opinion surveys.

Met Office Does Not Know What “Extreme Weather” Is.

by P. Homewood, March 9, 2020 in NotaLotofPeopleKnowThat


https://www.metoffice.gov.uk/about-us/press-office/news/weather-and-climate/2019/weather-overview-2019

According to the Met Office, 2019 was a year of weather extremes in the UK. There is actually very little evidence to back this claim up, but this does not stop them ludicrously claiming one mild day in February as “extreme”!

To most people, extreme weather would be the sort of stuff our ancestors experienced in this very week in 1891:

Russia Just Told the World, “No.”

by Tom Luongo, March 6, 2020 in GoldGoats’NGuns


There is real power in the word “No.”

In fact, I’d argue that it is the single most powerful word in any language.

In the midst of the worst market meltdown in a dozen years which has at its source problems within global dollar-funding markets, Russia found itself in the position to exercise the Power of No.

Multiple overlapping crises are happening worldwide right now and they all interlock into a fabric of chaos.

Between political instability in Europe, presidential primary shenanigans in the U.S., coronavirus creating mass hysteria and Turkey’s military adventurism in Syria, the eastern Mediterranean and Libya, markets are finally calling the bluff of central bankers who have been propping up asset prices for years.

But, at its core, the current crisis stems from the simple truth that those prices around the world are vastly overvalued.

Western government and central bank policies have used the power of the dollar to push the world to this state.

And that state is, at best, meta-stable.

But when this number of shits get this freaking real, well… meeting the fan was inevitable.

And all it took to push a correction into a full-scale panic was the Russians saying, “No.”

The reality has been evident in the commodity markets for months.  Copper and other industrial metals have all been in slumps while equity markets zoomed higher.

But it was oil that was the most confounding of all.

Most of 2019 we saw oil prices behaving oddly as events occurred with regularity to push prices higher but ultimately see them fall.

Since peaking after the killing of Iranian General Qassem Soleimani oil prices have been a one-way trade. Down.

Guerre du prix du pétrole : revanche de la technologie sur l’OPEP

by Samuel Furfari, 9 mars 2020 in Contrepoints


Le monde regorge de pétrole grâce au développement de la technologie. C’est elle qui est le vecteur de la marche du monde de l’énergie.

Je vous avoue que je ne suis pas le cours du pétrole tous les jours. Cela n’a d’importance que pour les traders et les spéculateurs qui engrangent des bénéfices plantureux en jouant sur quelques centimes de volumes gigantesques.

Si vous voulez comprendre la géopolitique du pétrole et donc de l’énergie , il faut observer les tendances lourdes, comme celle du week-end dernier.

Lorsque j’ai publié en mars 2014 un livre intitulé Vive les énergies fossiles qui indique qu’il n’y a aucune raison objective ou technologique pour que le prix du brut dépasse les 100 dollars le baril, on m’a pris pour un farfelu. Même si j’étais probablement le seul à oser le dire ouvertement en milieu francophone, nombreux étaient ceux qui l’affirmaient de vive voix et par écrit dans le monde. Les faits nous ont donné raison.

LA DEMANDE DE PÉTROLE EN CHUTE LIBRE

Face à la chute brusque de l’activité économique occasionnée par l’épidémie de coronavirus, la demande de pétrole est en chute libre. La consommation chinoise de pétrole a chuté de plus de 3 millions de barils par jour.

De toute évidence, cette crise sera bien plus profonde pour l’économie mondiale que celle déclenchée par les subprimes en 2008. On s’attend à un net recul de la demande en énergie primaire et singulièrement du pétrole.

Cela va de soi : les avions qui ne volent pas, les voitures qui restent au garage, les restaurants désertés, les stades fermés, les vacances annulées font dégringoler la consommation de produits pétroliers et partant, de toute l’économie. De quoi réjouir les écologistes profonds !

Vendredi dernier à Vienne, à la réunion de l’OPEP, comme d’habitude la Russie – non membre – a été conviée à participer aux travaux. L’OPEP, qui manipule le prix du brut depuis 1973 voulait réduire sa production pour maintenir le prix au niveau précédant l’arrivée sur scène du virus dévastateur. Par la même occasion Ryad aurait mis l’Iran encore plus à genoux pour le peu de pétrole que celui-ci parvient à écouler au marché noir (l’Iran ne sait plus où stocker le pétrole pompé qu’il ne peut pas vendre).

LES ORIGINES DE LA CHUTE DU PRIX DU PÉTROLE BRUT

Il est vrai que depuis trois ans, l’OPEP et la Russie se sont accordés pour ajuster leurs extractions à la demande mondiale. Il y a bien eu une tentative de faire chuter le prix de manière à restreindre le développement du pétrole de roche-mère des USA, mais en vain.

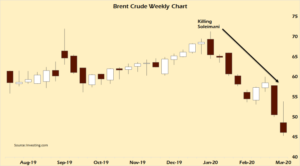
Cette fois, Moscou n’a pas voulu suivre le leader de l’OPEP – Ryad – et a refusé d’adhérer à la réduction de la production pour soutenir le prix. L’Arabie Saoudite, piquée au vif, a réagi de manière inverse et a déclaré son intention de porter sa production de brut à plus de 10 millions de barils par jour en avril, après l’expiration de l’accord actuel entre l’OPEP et la Russie fin mars – connu sous le nom d’OPEP+.

De plus, elle a réduit le prix de tous ses bruts vers toutes les destinations de 6 à 8 dollars le baril. La conséquence ne s’est pas fait attendre : le prix du brut a chuté à environ 32 dollars le baril.

Les contrats à terme sur le pétrole ont subi leur plus grosse perte quotidienne depuis 1991 lors de la guerre du Golfe. Lors de la crise asiatique de 1998, le Financial Times du 10 septembre 1998 titrait que la seule chose qui était plus basse que le cours du pétrole était le moral de l’économie. On pourrait dire la même chose aujourd’hui.

LE MONDE REGORGE DE PÉTROLE GRÂCE À LA TECHNOLOGIE


Continuer la lecture de Guerre du prix du pétrole : revanche de la technologie sur l’OPEP

‘HO! FOR THE POLE!’ — DID DUTCH SHIPS REACH THE 89TH LATITUDE IN 1665 AND 1675?

by H. Hardrada, March 8, 2020 in Electroverse


I [Harry Hardrada] recently unearthed an intriguing piece of literature from a 19th century periodical named ‘Ho! For the Pole!’ in Littell’s Living Age, Volume 66 (1860).

The paper highlights various voyages to the North Pole throughout the 17th-18th centuries with meticulous detail. It appears, according to the article, that many wooden ships penetrated as far north as the 89th latitude in ‘open iceless seas’ during this time — as in 1665 and 1675.

A bit far-fetched?

Perhaps, on the face of it… but there is some good evidence out there which may suggest otherwise.

NASA satellite offers urban carbon dioxide insights

by University of Utah, March 8, 2020 in WUWT


CO2 measurements from OCO-2 in parts per million over Las Vegas on Feb. 8, 2018. Credit: Dien Wu/University of Utah

A new NASA/university study of carbon dioxide emissions for 20 major cities around the world provides the first direct, satellite-based evidence that as a city’s population density increases, the carbon dioxide it emits per person declines, with some notable exceptions. The study also demonstrates how satellite measurements of this powerful greenhouse gas can give fast-growing cities new tools to track carbon dioxide emissions and assess the impact of policy changes and infrastructure improvements on their energy efficiency.

Cities account for more than 70% of global carbon dioxide emissions associated with energy production, and rapid, ongoing urbanization is increasing their number and size. But some densely populated cities emit more carbon dioxide per capita than others.

To better understand why, atmospheric scientists Dien Wu and John Lin of the University of Utah in Salt Lake City teamed with colleagues at NASA’s Goddard Space Flight Center in Greenbelt, Maryland and the University of Michigan in Ann Arbor. They calculated per capita carbon dioxide emissions for 20 urban areas on several continents using recently available carbon dioxide estimates from NASA’s Orbiting Carbon Observatory-2 (OCO-2) satellite, managed by the agency’s Jet Propulsion Laboratory in Pasadena, California. Cities spanning a range of population densities were selected based on the quality and quantity of OCO-2 data available for them. Cities with minimal vegetation were preferred because plants can absorb and emit carbon dioxide, complicating the interpretation of the measurements. Two U.S. cities were included–Las Vegas and Phoenix.

Continuer la lecture de NASA satellite offers urban carbon dioxide insights

Arctic Meltdown Latest

by P. Homewood, March 3, 2020 in NotaLotofPeopleKnowThat


Arctic sea ice extent continues to run well ahead of the last few years, as it has done for most of this year so far, and continues to grow at a time of year when it normally begins to stabilise and recede.

Average extent in February was the highest since 2013, and stands greater than 2005 and 2006:

http://ocean.dmi.dk/arctic/icecover_30y.uk.php