Tous les articles par Alain Préat

Full-time professor at the Free University of Brussels, Belgium apreat@gmail.com apreat@ulb.ac.be • Department of Earth Sciences and Environment Res. Grp. - Biogeochemistry & Modeling of the Earth System Sedimentology & Basin Analysis • Alumnus, Collège des Alumni, Académie Royale de Sciences, des Lettres et des Beaux Arts de Belgique (mars 2013). http://www.academieroyale.be/cgi?usr=2a8crwkksq&lg=fr&pag=858&rec=0&frm=0&par=aybabtu&id=4471&flux=8365323 • Prof. Invited, Université de Mons-Hainaut (2010-present-day) • Prof. Coordinator and invited to the Royal Academy of Sciences of Belgium (Belgian College) (2009- present day) • Prof. partim to the DEA (third cycle) led by the University of Lille (9 universities from 1999 to 2004) - Prof. partim at the University of Paris-Sud/Orsay, European-Socrates Agreement (1995-1998) • Prof. partim at the University of Louvain, Convention ULB-UCL (1993-2000) • Since 2015 : Member of Comité éditorial de la Revue Géologie de la France http://geolfrance.brgm.fr • Since 2014 : Regular author of texts for ‘la Revue Science et Pseudosciences’ http://www.pseudo-sciences.org/ • Many field works (several weeks to 2 months) (Meso- and Paleozoic carbonates, Paleo- to Neoproterozoic carbonates) in Europe, USA (Nevada), Papouasia (Holocene), North Africa (Algeria, Morrocco, Tunisia), West Africa (Gabon, DRC, Congo-Brazzaville, South Africa, Angola), Iraq... Recently : field works (3 to 5 weeks) Congo- Brazzaville 2012, 2015, 2016 (carbonate Neoproterozoic). Degree in geological sciences at the Free University of Brussels (ULB) in 1974, I went to Algeria for two years teaching mining geology at the University of Constantine. Back in Belgium I worked for two years as an expert for the EEC (European Commission), first on the prospecting of Pb and Zn in carbonate environments, then the uranium exploration in Belgium. Then Assistant at ULB, Department of Geology I got the degree of Doctor of Sciences (Geology) in 1985. My thesis, devoted to the study of the Devonian carbonate sedimentology of northern France and southern Belgium, comprised a significant portion of field work whose interpretation and synthesis conducted to the establishment of model of carbonate platforms and ramps with reefal constructions. I then worked for Petrofina SA and shared a little more than two years in Angola as Director of the Research Laboratory of this oil company. The lab included 22 people (micropaleontology, sedimentology, petrophysics). My main activity was to interpret facies reservoirs from drillings in the Cretaceous, sometimes in the Tertiary. I carried out many studies for oil companies operating in this country. I returned to the ULB in 1988 as First Assistant and was appointed Professor in 1990. I carried out various missions for mining companies in Belgium and oil companies abroad and continued research, particularly through projects of the Scientific Research National Funds (FNRS). My research still concerns sedimentology, geochemistry and diagenesis of carbonate rocks which leads me to travel many countries in Europe or outside Europe, North Africa, Papua New Guinea and the USA, to conduct field missions. Since the late 90's, I expanded my field of research in addressing the problem of mass extinctions of organisms from the Upper Devonian series across Euramerica (from North America to Poland) and I also specialized in microbiological and geochemical analyses of ancient carbonate series developing a sustained collaboration with biologists of my university. We are at the origin of a paleoecological model based on the presence of iron-bacterial microfossils, which led me to travel many countries in Europe and North Africa. This model accounts for the red pigmentation of many marble and ornamental stones used in the world. This research also has implications on the emergence of Life from the earliest stages of formation of Earth, as well as in the field of exobiology or extraterrestrial life ... More recently I invested in the study from the Precambrian series of Gabon and Congo. These works with colleagues from BRGM (Orléans) are as much about the academic side (consequences of the appearance of oxygen in the Paleoproterozoic and study of Neoproterozoic glaciations) that the potential applications in reservoir rocks and source rocks of oil (in collaboration with oil companies). Finally I recently established a close collaboration with the Royal Institute of Natural Sciences of Belgium to study the susceptibility magnetic signal from various European Paleozoic series. All these works allowed me to gain a thorough understanding of carbonate rocks (petrology, micropaleontology, geobiology, geochemistry, sequence stratigraphy, diagenesis) as well in Precambrian (2.2 Ga and 0.6 Ga), Paleozoic (from Silurian to Carboniferous) and Mesozoic (Jurassic and Cretaceous) rocks. Recently (2010) I have established a collaboration with Iraqi Kurdistan as part of a government program to boost scientific research in this country. My research led me to publish about 180 papers in international and national journals and presented more than 170 conference papers. I am a holder of eight courses at the ULB (5 mandatory and 3 optional), excursions and field stages, I taught at the third cycle in several French universities and led or co-managed a score of 20 Doctoral (PhD) and Post-doctoral theses and has been the promotor of more than 50 Masters theses.

El Nino & Arctic Warming In the 1930s

by P. Homewood, April 5, 2020 in NotaLotofPeopleKnowThat


Just following up on Joe Bastardi’s article yesterday about El Ninos and Arctic warming, it is worth looking at longer term trends.

Below is the chart of the MEI, with red indicating El Ninos and blue La Ninas.:

Extended Multivariate ENSO Index

https://www.esrl.noaa.gov/psd/enso/mei.ext/

As we can see, the period 1925 to 1945 was dominated by powerful El Ninos. This of course was also the time of great warming in the Arctic, known as “The Warming in The North”, when temperatures across much of the Arctic were as high as they are now.

During the 1950s, a much colder climate took over in the Arctic, until it became warmer again in the 90s. This was also a period when La Ninas dominated.

Coincidence?

The climate in the Arctic is also very well correlated with the Atlantic Multidecadal Oscillation (AMO):

Continuer la lecture de El Nino & Arctic Warming In the 1930s

Is Greenland Warming, Melting? Hell No! NASA Data Show No Warming In Nearly 100 Years!

by Kirye & Gosselin, April 3, 2020 in NoTricksZone


But then NASA adjusted the V3 data and called it GHCN V4 “unadjusted”. The chart shown above in my tweet toggles between the prior V3 chart and the “unadjusted” V4. See the difference?

Note how the lack of warming has been removed and now the V4 data show modest warming. The missing heat was found – in the statistics! So in a sense, global warming has been “man-made” – done through statistical fudging and not human activity.

Extra warm U.S. winter had nature’s thumbprint on it–Joe Bastardi

by P. Homewood, April 3; 2020 in NotaLotofPeoppleKnowThat


Joe Bastardi explains why this winter has been so mild in the US, but also across N Europe, at CFACT.

Two points:

1) I will make the case for why such winters like this happen

2) I will point out that nowhere in this article did the massive natural physical drivers that far outweigh the effect of CO2, which is only .041% of the atmosphere. Pointedly, of which man is only responsible for  25% and the US only 15% of that total.

I am not going to waste time attacking here, except to say this kind of one-sided journalism and the fact that nowhere did anyone show what I am about to reveal to you, should raise questions of any objective person.

Basically the rules of the game are, if its warm like this winter, its climate change, if it is cold, its climate change. It is typical of everyone gets a trophy in that any answer even if opposite, means you get credit.

I won’t copy the whole article as it is a bit technical, but it can be seen here. However these are the main points Joe raises, starting with the role of El Nino and water vapour:

Water vapor is by far the most important greenhouse gas when it comes to the planetary weather and climate. Meteorologist look at “saturation mixing ratios” which show a correlation of water vapor to temperature. Basically the colder and drier the air mass, the more the introduction of water vapor will lead higher temperatures, there is no place like the arctic to prove this is the case. The cyclically warmed oceans have put more water vapor (and CO2) into the air. When Super El Niño’s go off, the immense amounts dispersed lead to a step up of the temperature. The colder regions leading the way as will be opined on below.

COP26 Postponed

by Charles Rotter/UNFCC, April 1, 2020 in WUWT


The COP26 UN climate change conference set to take place in Glasgow in November has been postponed due to COVID-19.

This decision has been taken by the COP Bureau of the UNFCCC (United Nations Framework Convention on Climate Change), with the UK and its Italian partners.

Dates for a rescheduled conference in 2021, hosted in Glasgow by the UK in partnership with Italy, will be set out in due course following further discussion with parties.

In light of the ongoing, worldwide effects of COVID-19, holding an ambitious, inclusive COP26 in November 2020 is no longer possible.

Rescheduling will ensure all parties can focus on the issues to be discussed at this vital conference and allow more time for the necessary preparations to take place. We will continue to work with all involved to increase climate ambition, build resilience and lower emissions.

See also here

Magma Flood Linked To Sudden Ancient Global Warming Event

by H. Lee, April 1, 2020 in ClimateChangeDispatch


A study has cemented the link between an intense global warming episode 56 million years ago and volcanism in the North Atlantic, with implications for modern climate change.

Roughly 60 million years ago, circulation changes deep within our planet generated a hot current of rock — the Iceland plume — causing it to rise from the heart of Earth’s mantle.


The Giant’s Causeway in Northern Ireland is a geologic feature consisting of thousands of interlocking basalt columns that formed from volcanic eruptions 60 million years ago.

The Wrong Kind Of Carbon

Although a great deal of North Atlantic volcanism happened close in time to the PETM, scientists were initially skeptical that it could have driven the warming.

Sedimentary layers that formed at the time had the wrong kind of carbon — they were rich in the isotope carbon-12, indicating an organic carbon source rather than a volcanic one.

The leading theory was that fluctuations in Earth’s orbit around the sun melted a type of frozen methane just beneath the seabed called methane clathrates.

Yet scientists found scant evidence that enough clathrates existed in the pre-PETM world, or that they could have melted fast enough to drive the warming.

A possible missing link between the North Atlantic Igneous Province and organic carbon was spotted in 2004 in seismic scans through the seabed off the coast of Norway.

Continuer la lecture de Magma Flood Linked To Sudden Ancient Global Warming Event

Ships’ emissions create measurable regional change in clouds

by  University of Washington, March 24, 2020 in ScienceDaily


A container ship leaves a trail of white clouds in its wake that can linger in the air for hours. This puffy line is not just exhaust from the engine, but a change in the clouds that’s caused by small airborne particles of pollution.

New research led by the University of Washington is the first to measure this phenomenon’s effect over years and at a regional scale. Satellite data over a shipping lane in the south Atlantic show that the ships modify clouds to block an additional 2 Watts of solar energy, on average, from reaching each square meter of ocean surface near the shipping lane.

The result implies that globally, cloud changes caused by particles from all forms of industrial pollution block 1 Watt of solar energy per square meter of Earth’s surface, masking almost a third of the present-day warming from greenhouse gases. The open-access study was published March 24 in AGU Advances, a journal of the American Geophysical Union.

EARTH’S TEMPERATURE PLUNGED IN MARCH — GLOBAL COOLING FROM HERE ON OUT

by Cap Allon, April 2, 2020 in Electroverse


The Global Lower Atmosphere plunged 0.28C in March to 0.48C, from its (expected early-year) high of 0.76C in February. Looking at the Sun, the cycles, the past, and the graphs, it is reasonable to assume there’s only one trend from here on out, and that’s down…

Take the previous anomalous “warming spikes” on the UAH Satellite-Based Temperature of the Global Lower Atmosphere chart (below) — they generally occur at the beginning of a year, and then are quickly followed by a sharp downward plunge:

www.drroyspencer.com/

China Extracts Record Amount Of Natural Gas From ‘Fire Ice’ In South China Sea

by GWPF, March 31, 2020


We might be sitting on enough gas to power the world for hundreds, if not thousands, of years.


China conducted its first operation to extract natural gas from gas hydrates in the South China Sea in 2017. Photo: Reuters
In a world awash in oil and gas, you’d think it couldn’t get any worse. Well, it can: China just announced that it had extracted a record amount of what has been poetically called fire ice. It is, however, a form of natural gas trapped in frozen water. 

Continuer la lecture de China Extracts Record Amount Of Natural Gas From ‘Fire Ice’ In South China Sea

New Study: Coral Reefs Thrive Near Acidic Waters (pH ~6.0) Where Seafloor Vents Emit Up To 95,000 ppm CO2

by K. Richard, March 30, 2020 in NoTricksZone


Though it’s believed the 130 ppm increase in atmospheric CO2 concentration since 1750 has caused the ocean waters to “acidify”, on a daily basis 50-380°C metallic acid enriched by CO2 concentrations reaching 60,000 to 95,000 ppm pours through seafloor vents. Nearby coral reefs “thrive” in these high-CO2 conditions.

50 times more CO2 in the oceans than in the atmosphere

Though many believe humans are “acidifying” the oceans by burning fossil fuels and emitting CO2, the ability of humans to impact the oceanic CO2 concentration is already compromised by the observation that the ocean waters contain about 50 times more CO2 (38,000 vs. 750 PgC) than the atmosphere does (North et al., 2014).

The Next Great Extinction Event Will Not Be Global Warming – It Will Be Global Cooling

by A. MacRae, September 1, 2019 in WUWT


CATASTROPHIC GLOBAL WARMING IS A FALSE CRISIS – THE NEXT GREAT EXTINCTION WILL BE GLOBAL COOLING

Forget all those falsehoods about scary global warming, deceptions contrived by wolves to stampede the sheep. The next great extinction event will not be global warming, it will be global cooling. Future extinction events are preponderantly cold: a glacial period, medium-size asteroid strike or supervolcano. Humanity barely survived the last glacial period that ended only 11,500 years ago, the blink-of–an-eye in geologic time.

Cold, not heat, is by far the greater killer of humanity. Today, cool and cold weather kills about 20 times as many people as warm and hot weather. Excess Winter Deaths, defined as more deaths in the four winter months than equivalent non-winter months, total over two million souls per year, in both cold and warm climates. Earth is colder-than-optimum for humanity, and currently-observed moderate global warming increases life spans.

“Cold Weather Kills 20 Times As Many People As Hot Weather”

By Joseph D’Aleo and Allan MacRae, September 4, 2015

https://friendsofsciencecalgary.files.wordpress.com/2015/09/cold-weather-kills-macrae-daleo-4sept2015-final.pdf

However, Excess Winter Deaths are not the worst threats to humanity. The glacial cycle averages about 100,000 years, consisting of about 90,000 years of the glacial period, when mile-thick continental glaciers blanketed much of the Northern and Southern Hemispheres including Canada, Russia, Northern Europe and Northern USA, and about 10,000 years of interglacial, the warm period of the present. Earth is now 11,500 years into the current warm interglacial, and our planet may re-enter the glacial period at any time.

“Glacial-Interglacial Cycles”

https://www.ncdc.noaa.gov/abrupt-climate-change/Glacial-Interglacial%20Cycles

https://www.ncdc.noaa.gov/sites/default/files/styles/716px_width/public/glacial-interglacial.jpg?itok=19bwFcU9

The UAH Global Temperature Dataset at 30 Years: A Look Back at the Early Days

by Dr. Roy Spencer, March 31, 2020 in GlobalWarming


Today (Monday, March 30) is the 30th anniversary of our publication in Science describing the first satellite-based dataset for climate monitoring.

While much has happened in the last 30 years, I thought it might be interesting for people to know what led up to the dataset’s development, and some of the politics and behind-the-scenes happenings in the early days. What follows is in approximate chronological order, and is admittedly from my own perspective. John Christy might have somewhat different recollections of these events.

Some of what follows might surprise you, some of it is humorous, and I also wanted to give credit to some of the other players. Without their help, influence, and foresight, the satellite temperature dataset might never have been developed.


Continuer la lecture de The UAH Global Temperature Dataset at 30 Years: A Look Back at the Early Days

Coral tells own tale about El Niño’s past

by Rice University, March 27, 2020 in WUWT


HOUSTON – (March 26, 2020) – There is no longer a need to guess what ocean temperatures were like in the remote tropical Pacific hundreds of years ago. The ancient coral that lived there know all.

A study in Science led by Rice University and Georgia Tech researchers parses the record archived by ancient tropical Pacific coral over the past millennium. That record could help scientists refine their models of how changing conditions in the Pacific, particularly from volcanic eruptions, influence the occurrence of El Niño events, which are major drivers of global climate.

They found the ratio of oxygen isotopes sequestered in coral, an accurate measure of historic ocean temperatures, shows no correlation between estimates of sulfate particles ejected into the atmosphere by tropical volcanic eruptions and El Niño events.

That result could be of particular interest to scientists who suggest seeding the atmosphere with sun-blocking particles may help reverse global warming.

According to Rice climate scientist and primary author Sylvia Dee, previous climate model studies often tie volcanic eruptions, which increase sulfate aerosols in the atmosphere, to increased chances for an El Niño event. But the ability to analyze climate conditions based on oxygen isotopes trapped in fossil corals extends the climatological record in this key region across more than 20 ancient eruptions. Dee said this allows for a more rigorous test of the connection.

“A lot of climate modeling studies show a dynamical connection where volcanic eruptions can initiate El Niño events,” Dee said. “We can run climate models many centuries into the past, simulating volcanic eruptions for the last millennium.

“But the models are just that — models — and the coral record captures reality.”

Coral data that Georgia Tech climate scientist Kim Cobb and her team arduously collected on trips to the Pacific show little connection between known volcanoes and El Niño events over that time. Like tree rings, these paleoclimate archives hold chemical indicators, the oxygen isotopes, of oceanic conditions at the time they formed.

The coral data yields a high-fidelity record with a resolution of less than a month, tracking the El Niño-Southern Oscillation (ENSO) in the heart of the central tropical Pacific.

EUROPE’S BIG SPRING FREEZE — ARCTIC BLAST TO GRIP THE CONTINENT DELIVERING SUB-ZERO TEMPERATURES AND RARE APRIL SNOW

by Cap Allon, March 27, 2020 in Electroverse


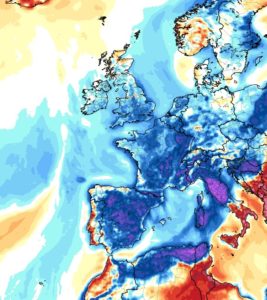
Latest GFS runs are forecasting a truly frosty and snowy next 7+ days for the majority of Europe, as winter continues to encroach ever-further into spring — a phenomenon long-predicted by those who study the Sun’s impact on climate.

Beginning this weekend, brutal Arctic cold will engulf practically ALL of Europe sinking temperatures some 16C below-the-seasonal-average for many:

…and there’s plenty more where that came from.

GFS runs are predicting rare April snow accumulating during the next 14-or-so days, particularly in Norway, Sweden, NE Russia, Latvia, Lithuania, Belarus, Ukraine, the Balkans, Italy, the Alps, Spain, and even the UK (also, note the substantial falls in Eastern Turkey, Georgia, Armenia and Azerbaijan):


Past civilizations shown to peak during times of warmth (Grand Solar Maximums), and then almost-instantly collapse during the subsequent & sharp cool-downs (Grand Solar Minimums).

And these COLD TIMES are returning, in line with historically low solar activitycloud-nucleating Cosmic Rays, and a meridional jet stream flow.

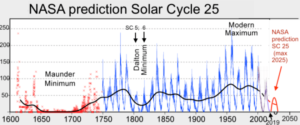
Even NASA agrees, in part at least, with their forecast for this upcoming solar cycle (25) revealing it will be “the weakest of the past 200 years,” with the agency correlating previous solar shutdowns to prolonged periods of global cooling here.

GREENLAND’S SMB GAINED 6 GIGATONS YESTERDAY + NORTHERN HEMISPHERE SNOW MASS SITTING AT 500 GIGAGTONS ABOVE THE NORM

by Cap Allon, March 29, 2020 in Electroverse


Despite decades of doom-and-gloom prophecies, Greenland’s Ice Sheet is currently GAINING monster amounts of “mass”— 6 gigatons yesterday alone (March 28, 2020).

Crucial to the survival of a glacier is its surface mass balance (SMB)–the difference between accumulation and ablation (sublimation and melting). Changes in mass balance control a glacier’s long-term behavior, and are its most sensitive climate indicators (wikipedia.org).

On the back of substantial SMB gains over the past few years, the Greenland ice sheet looks set to continue that trend in 2019-20. On March 28, 2020, the world’s largest island added a monster 6 gigatons to its ice sheet. According to climate alarmists, this simply shouldn’t be happening in a warming world. In fact, it might as well not be happening–developments like this NEVER receive MSM attention, meaning alarmists are NEVER privy to the full and unalarming picture…

polarportal.dk/

In addition, Total Snow Mass for the Northern Hemisphere continues to track WELL-above average with the latest data point (March 27) seeing NH snow at a staggering 500+ gigatons above the norm—another real-world reality we were told should be an impossibility by now: IPCC 2001: “Milder winter temperatures will decrease heavy snowstorms…”

Continuer la lecture de GREENLAND’S SMB GAINED 6 GIGATONS YESTERDAY + NORTHERN HEMISPHERE SNOW MASS SITTING AT 500 GIGAGTONS ABOVE THE NORM

Les idéologues de l’hystérie climatique vus à l’ombre du Coronavirus

by Samuel Furfari, 26 mars 2020 in LaTribune


OPINION. Il semble morbide et cynique, alors que des milliers de personnes meurent du Coronavirus, d’insister en ce moment sur l’impérieuse nécessité d’agir contre le changement climatique. Pourtant, des idéologues, qui sont aussi et surtout ceux de la remise en cause de l’économie de marché, osent le faire. Ils ne ratent aucune occasion d’essayer de faire croire que le changement climatique cause ou exacerbe cette crise. Il est nécessaire de les dénoncer pour préparer l’avenir. Par Samuel Furfari, Professeur à l’Université Libre de Bruxelles et Président de la Société Européenne des Ingénieurs et Industriels.

Un climatologue français semble regretter que « ce qu’on fait pour le Coronavirus, c’est deux ans de financement climat » car, d’après lui, si on dépense de l’argent pour sauver des vies, on pourrait tout aussi bien redoubler d’effort pour sauver la planète. Un climatologue belge a eu l’outrecuidance de tweeter à la Première ministre belge et à son vice-Premier ministre en charge du budget qu’ils profitent de cette crise pour introduire une taxe sur l’énergie : « #Covid_19 : C’est le bon moment pour instaurer une vraie taxe CO2 sur les carburants, le mazout [fioul en Belgique] et le gaz fossile. Leur prix ayant fortement baissé, ce sera indolore. Cela permettra de dégager des ressources pour compenser les effets de la crise. » Sur Facebook, ce membre éminent du GIEC s’est fait traiter de « charognard », entre autres épithètes. En pleine crise, « presque hilare », un commentateur politique bien connu a apprécié que ce « virus révolutionnaire » empêchait la privatisation des aéroports de Paris et  s’en est pris aux « banques mondiales [qui] échouent lamentablement face à la crise climatique en injectant des billions dans les combustibles fossiles».

Les glaces terrestres, la cryosphère (2/3)

by J.C. Maurin, 27 mars 2020 in ScienceClimatEnergie


Partie 2/3 : Lecture critique du chapitre cryosphère de l’AR5

par J.C. Maurin, Professeur agrégé de physique

Cette deuxième partie de l’article examine la composition du chapitre 4 du 5ème rapport du GIEC (AR5) [1].
Dans ce chapitre, qui concerne les différentes composantes de la cryosphère, les banquises [2] et glaciers [3] sont particulièrement mises en avant par les rédacteurs du GIEC.
A propos de ces 2 composantes mineures (0,65 % du volume de la cryosphère), l’article développe certains éléments d’appréciation que les rédacteurs de l’AR5 n’ont pas mis en exergue.

Continuer la lecture de Les glaces terrestres, la cryosphère (2/3)

Heartland Institute Launches ClimateRealism.com

by P. Homewood, March 24, 2020 in NotaLotofPeopleKnowThat


WUWT has news of a new website launched by the Heartland Institute, to augment the excellent factchecking site, Climate At A Glance:

Nearly every day, the establishment media promotes new climate propaganda themes designed to scare people into believing a climate crisis is at hand. When the Climate Scare goes unrebutted, people are likely to believe by default that the propaganda is true. Yet most of the media’s climate propaganda is misleading or outright false. ClimateRealism.com will address and debunk the media’s most prominent climate-related tall tales.

Lunar Recession and the Age of the Earth: How Uniformitarianism Works

by D. Middleton, March 24, 2020 in WUWT


One of the things I love about writing for Watts Up With That, is the fact that reader comments often inspire me to research and write subsequent posts. In my recent post about the origins of the Moon, one commentator suggested that the rate of lunar recession (tidal acceleration) indicated that the Earth was much younger than 4.5 billion years old and/or somehow disproved the geological Principle of Uniformitarianism. I didn’t give much thought to my reply. I simply calculated the distance from the Earth to the Moon 1 billion and 4.5 billion years ago. The Moon is currently receding (moving away) from the Earth at a rate of about 3.8 cm/yr. This has been directly measured with lasers.

At 3.8 cm/yr, the Moon would have been 215,288 miles away from Earth a billion years ago. It is currently an average of 238,900 miles away. At 3.8 cm/yr, it still would have been 132,646 miles away 4.5 BY.

If the Moon did did originate from a collision with Earth, it would have been a lot closer to Earth 4.5 BY than 100,000 miles.

Denman Glacier–Latest Antarctic Meltdown Scare

by P. Homewood, March 24, 2020 in NotaLotofPeopleKnowThat


Scientists have found a new point of major vulnerability in the Antarctic ice sheet, in a region that already appears to be changing as the climate warms and has the potential to raise sea levels by nearly five feet over the long term.

Denman glacier, in East Antarctica, is a 12-mile-wide stream of ice that flows over the deepest undersea canyon in the entire ice sheet before spilling out into the ocean. That subsea trough is more than 2 miles deep, or double the average depth of the Grand Canyon. While there are far deeper trenches in the open ocean, such as the Marianas Trench, in this case the extreme undersea topography lies right on the outer fringe of the Antarctic continent — making it the “deepest continental point on Earth.”

In reality the scientists who wrote this study do not have a clue whether the retreat of the Denman is anything new or not, or whether the deep ocean temperatures are any warmer than before 1979. Or whether what they are observing is just a natural process.


We can then go on to explore sea level implications.

They claim that since 1979, 250 billion tonnes of ice has been lost, equivalent to 0.5mm of sea level rise. In other words, 1.3mm/C, hardly cataclysmic.

They then go on to talk about a potential loss of 540 trillion tonnes, raising sea levels by 5 feet. Yet at current rates, it would take 86400 years for this to occur!

As always with these sort of studies, the authors refuse to say how long all this will take to happen.


Absence of evidence for greenhouse warming over the Arctic Ocean-Mark Serreze 1990

by P. Homewood, March 23, 2020 in NotaLotofPeopleKnowThat


We are familiar with the incessant claims that the Arctic is one of the fastest warming regions on Earth, and that this is due to the polar amplification effect of greenhouse gases.

But scientists back in the 1990s found that this theory did not stack up then:

Abstract

ATMOSPHERIC general circulation models predict enhanced greenhouse warming at high latitudes1owing to positive feedbacks between air temperature, ice extent and surface albedo2–4. Previous analyses of Arctic temperature trends have been restricted to land-based measurements on the periphery of the Arctic Ocean5,6. Here we present temperatures measured in the lower troposphere over the Arctic Ocean during the period 1950–90. We have analysed more than 27,000 temperature profiles, measured by radiosonde at Russian drifting ice stations and by dropsonde from US ‘Ptarmigan’ weather reconnaissance aircraft, for trends as a function of season and altitude. Most of the trends are not statistically significant. In particular, we do not observe the large surface warming trends predicted by models; indeed, we detect significant surface cooling trends over the western Arctic Ocean during winter and autumn. This discrepancy suggests that present climate models do not adequately incorporate the physical processes that affect the polar regions.

https://www.nature.com/articles/361335a0

The cooling between 1950 and 1990 is very evident at a whole range of land sites on the fringes of the Arctic, ranging from Greenland right through to eastern Siberia.

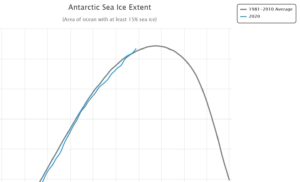
ANTARCTICA JUST SET ITS COLDEST MARCH TEMPERATURE ON RECORD: A “GLOBAL WARMING” DESTROYING -75.3C (-103.5F)

by Cap Allon, March 23, 2020 in Electroverse


The MSM has a blatant warm-bias, that’s been clear for years…

A myriad of news outlets were all-too-happy to run with the Antarctic Peninsula’s record warm temperature last month, painting it as further evidence of the coming climate catastrophe (despite the peninsula actually being located closer to Argentina than the South Pole, and the event officially going down as a foehn). But where are those same rags now? Where is their balance? Their credibility? Or is informing the public not the goal anymore, is their mission merely to propagandize?

Last Friday, Antarctica set its coldest EVER March temperature

…somehow, in what we’re to believe is a linearly warming world on the brink of “overheating”, the world’s southernmost continent is currently the coldest its ever been for the time of year.

The Vostok Station clocked a bone-chilling -75.3C (-103.54F) on the morning of Friday, March 20, as spotted by @TempGlobal on Twitter:

Location of Vostok (Wiki).

Continuer la lecture de ANTARCTICA JUST SET ITS COLDEST MARCH TEMPERATURE ON RECORD: A “GLOBAL WARMING” DESTROYING -75.3C (-103.5F)

How much human-caused global warming should we expect?

by Andy May, March 21, 2020 in WUWT


C3S20 asks, how much human-caused warming will occur if we do nothing, that is, continue “business-as-usual?” It’s unfortunate, but the IPCC, for all their work, do not adequately answer that question, their projections are all based on abstract “scenarios.” C3S20 break this overall question into five parts:

  1. What would greenhouse gas emissions (GHG) be, if we did nothing and continued normally?
  2. For each GHG, how do emissions relate to the change in atmospheric concentration?
  3. What would the global temperature be if GHG concentrations were at “preindustrial” levels?
  4. How sensitive are global temperatures to GHG concentrations?
  5. How much warming should we expect if we do nothing?

C3S20 tell us the Paris Agreement conclusion that we need to limit global warming to 2°C above preindustrial levels suffers from several unknowns.

  1. The preindustrial period is not formally defined. The preindustrial temperature and greenhouse gas level are not specified. In fact, several time periods, temperatures and GHG levels are used as “preindustrial” in the latest IPCC AR5 report.

  2. The assumptions that warming is bad and increasing levels of CO2 are bad, are not supported with any data. Numerous studies have concluded that some warming is good for humankind and additional CO2 is good for plants.

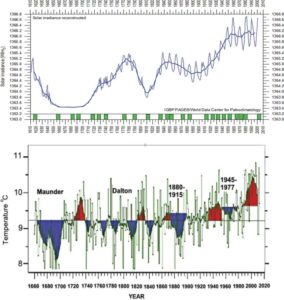
  3. The penultimate draft of AR5 identified the period 1850 to 1900 as the preindustrial baseline for CO2 and temperature. This was the end of the Little Ice Age, the coldest periodin the last several thousand years. Why use that period as a baseline (Luning and Vahrenholt 2017)? This is not explained, and the final draft of the report removed the reference to the 1850 to 1900 baseline.

  4. If the UNFCC and the Paris Agreement assume “climate change” and “Human-caused Climate Change” are synonymous, how do they explain that climate has change much quicker and much more dramatically many times in the past 13,000 years before human civilization began and well before industrialization?

Climate At A Glance Factchecks–Coral Reefs

by P. Homewood, March 21, 2020 in NotaLotofPeopleKnowThat


Bullet Point Summary:

  • Coral thrive in warm water, not cold water.
  • Recent warming has allowed coral to expand their range poleward, while still thriving near the equator.
  • Coral has existed continuously for the past 40 million years, surviving temperatures and carbon dioxide levels significantly higher than what is occurring today.
  • The primary causes of coral bleaching include oxybenzone (a chemical found in sunscreen), sediment runoff from nearby coastal lands, and cold temperatures like those recorded in 2010 off the Florida coast.
  •  

Short Summary: Coral require warm water, not cold water, to live. Coral cannot live outside of tropical or subtropical waters. (See Figure 1.) As Earth continues to modestly warm, coral are extending their range toward the poles while still thriving at and near the equator. The primary reasons for bleaching events include sediment pollution from nearby coastal lands, chemicals found in sunscreen, and cold temperature events. Coral have existed continuously for the past 40 million years. Coral survived and thrived when temperatures were significantly warmer than they are today.

Figure 1: Coral Reef Locations

Continuer la lecture de Climate At A Glance Factchecks–Coral Reefs

ALL-TIME RECORD SNOWFALL BURIES PARTS OF SWEDEN — 3.25 M (10.7 FT) — DON’T TELL GRETA…

by Cap Allon, March 19, 2020 in Electroverse


The first flakes of the season in Kiruna, Sweden fell back on Sept 30 and from then on have continued relentlessly, with accumulations now comfortably surpassing the region’s all-time snowfall record.

The cold times are returning in line with historically low solar activitycloud-nucleating Cosmic Rays, and a meridional jet stream flow.

NASA has recently revealed this upcoming solar cycle (25) will be “the weakest of the past 200 years,” with the agency correlating previous solar shutdowns to prolonged periods of global cooling here.


https://globalcryospherewatch.org/

A chunk of Yellowstone the size of Chicago has been pulsing. Why?

by R.G. Andrews, March 19, 2020 in NationalGeographic


An injection of magma under Norris Geyser Basin may be why the region is five inches higher today than it was 20 years ago.

In northwestern Wyoming, in the center of Yellowstone National Park, a bubbling caldera is the scar of a 640,000-year-old, gargantuan volcanic eruption. The 3,472-square-mile park encompassing the caldera is filled with geologic wonderlands of sprouting geysers and effervescing pools, all ultimately driven by magma and superheated fluids churning in the rock below the surface.

One of these areas, Norris Geyser Basin to the northwest of the caldera, contains more than 500 hydrothermal features. These tempestuous geysers and pools often change from day to day, but a much larger transformation has been taking place as well: For more than two decades, an area larger than Chicago centered near the basin has been inflating and deflating by several inches in erratic bursts. In a hyperactive volcanic region like Yellowstone, the exact causes of any specific movement are difficult to pin down. But a recent study in the Journal of Geophysical Research: Solid Earth may help explain why this pocket of land has been breathing in and out.

“In all likelihood, Norris has been a center of deformation for a very long time,” says Daniel Dzurisin, a research geologist at the U.S. Geological Survey’s Cascades Volcano Observatory and one of the co-authors of the new research.

Norris Geyser Basin, Yellowstone National Park, Wyoming.
PHOTOGRAPH BY MARC MORITSCH, NAT GEO IMAGE COLLECTION