Tous les articles par Alain Préat

Full-time professor at the Free University of Brussels, Belgium apreat@gmail.com apreat@ulb.ac.be • Department of Earth Sciences and Environment Res. Grp. - Biogeochemistry & Modeling of the Earth System Sedimentology & Basin Analysis • Alumnus, Collège des Alumni, Académie Royale de Sciences, des Lettres et des Beaux Arts de Belgique (mars 2013). http://www.academieroyale.be/cgi?usr=2a8crwkksq&lg=fr&pag=858&rec=0&frm=0&par=aybabtu&id=4471&flux=8365323 • Prof. Invited, Université de Mons-Hainaut (2010-present-day) • Prof. Coordinator and invited to the Royal Academy of Sciences of Belgium (Belgian College) (2009- present day) • Prof. partim to the DEA (third cycle) led by the University of Lille (9 universities from 1999 to 2004) - Prof. partim at the University of Paris-Sud/Orsay, European-Socrates Agreement (1995-1998) • Prof. partim at the University of Louvain, Convention ULB-UCL (1993-2000) • Since 2015 : Member of Comité éditorial de la Revue Géologie de la France http://geolfrance.brgm.fr • Since 2014 : Regular author of texts for ‘la Revue Science et Pseudosciences’ http://www.pseudo-sciences.org/ • Many field works (several weeks to 2 months) (Meso- and Paleozoic carbonates, Paleo- to Neoproterozoic carbonates) in Europe, USA (Nevada), Papouasia (Holocene), North Africa (Algeria, Morrocco, Tunisia), West Africa (Gabon, DRC, Congo-Brazzaville, South Africa, Angola), Iraq... Recently : field works (3 to 5 weeks) Congo- Brazzaville 2012, 2015, 2016 (carbonate Neoproterozoic). Degree in geological sciences at the Free University of Brussels (ULB) in 1974, I went to Algeria for two years teaching mining geology at the University of Constantine. Back in Belgium I worked for two years as an expert for the EEC (European Commission), first on the prospecting of Pb and Zn in carbonate environments, then the uranium exploration in Belgium. Then Assistant at ULB, Department of Geology I got the degree of Doctor of Sciences (Geology) in 1985. My thesis, devoted to the study of the Devonian carbonate sedimentology of northern France and southern Belgium, comprised a significant portion of field work whose interpretation and synthesis conducted to the establishment of model of carbonate platforms and ramps with reefal constructions. I then worked for Petrofina SA and shared a little more than two years in Angola as Director of the Research Laboratory of this oil company. The lab included 22 people (micropaleontology, sedimentology, petrophysics). My main activity was to interpret facies reservoirs from drillings in the Cretaceous, sometimes in the Tertiary. I carried out many studies for oil companies operating in this country. I returned to the ULB in 1988 as First Assistant and was appointed Professor in 1990. I carried out various missions for mining companies in Belgium and oil companies abroad and continued research, particularly through projects of the Scientific Research National Funds (FNRS). My research still concerns sedimentology, geochemistry and diagenesis of carbonate rocks which leads me to travel many countries in Europe or outside Europe, North Africa, Papua New Guinea and the USA, to conduct field missions. Since the late 90's, I expanded my field of research in addressing the problem of mass extinctions of organisms from the Upper Devonian series across Euramerica (from North America to Poland) and I also specialized in microbiological and geochemical analyses of ancient carbonate series developing a sustained collaboration with biologists of my university. We are at the origin of a paleoecological model based on the presence of iron-bacterial microfossils, which led me to travel many countries in Europe and North Africa. This model accounts for the red pigmentation of many marble and ornamental stones used in the world. This research also has implications on the emergence of Life from the earliest stages of formation of Earth, as well as in the field of exobiology or extraterrestrial life ... More recently I invested in the study from the Precambrian series of Gabon and Congo. These works with colleagues from BRGM (Orléans) are as much about the academic side (consequences of the appearance of oxygen in the Paleoproterozoic and study of Neoproterozoic glaciations) that the potential applications in reservoir rocks and source rocks of oil (in collaboration with oil companies). Finally I recently established a close collaboration with the Royal Institute of Natural Sciences of Belgium to study the susceptibility magnetic signal from various European Paleozoic series. All these works allowed me to gain a thorough understanding of carbonate rocks (petrology, micropaleontology, geobiology, geochemistry, sequence stratigraphy, diagenesis) as well in Precambrian (2.2 Ga and 0.6 Ga), Paleozoic (from Silurian to Carboniferous) and Mesozoic (Jurassic and Cretaceous) rocks. Recently (2010) I have established a collaboration with Iraqi Kurdistan as part of a government program to boost scientific research in this country. My research led me to publish about 180 papers in international and national journals and presented more than 170 conference papers. I am a holder of eight courses at the ULB (5 mandatory and 3 optional), excursions and field stages, I taught at the third cycle in several French universities and led or co-managed a score of 20 Doctoral (PhD) and Post-doctoral theses and has been the promotor of more than 50 Masters theses.

Who Is Winning The Climate Wars? (Part Two)

by F. Menton, December 18, 2019 in ClimateChangeDispatch


A few weeks ago (November 22), in a post titled “Who Is Winning The Climate Wars?”, I undertook to begin documenting the ever-growing chasm between the unhinged rhetoric of climate campaigners and the reality out there in the world.

Let’s collect a few data points over the past several weeks.

You probably know that the UN held its annual big climate conference this year in Madrid during the first two weeks of December.

That event provided the occasion for many campaigners to ramp up the volume of their claims, trying once again to stampede government representatives into agreeing to impoverish their people.

A few examples:

The fact is that outside of some wildly guilty European countries and the loons in the U.S. Democratic Party’s far Left, fewer and fewer people pay any attention whatsoever to the absurd climate apocalypse rhetoric.

Why The Media Doesn’t Report Previous Failed Climate Doom Predictions

by Jack Hellner, December 18, 2019 in ClimateChangeDispatch


Here is a small sample of predictions on the climate that almost all of the media regurgitate with no questions asked:

  • 2019-The UN says we only have a few years left because of warming.
  • 2008-On ABC, Good Morning America. By 2015, New York City would be underwater, milk would be $13 per gallon and gasoline would be $9 per gallon, very little of Miami would be left. (they were so close)
  • 2005-After Katrina we were told hurricanes would be more frequent and severe than ever. Instead, we had a ten-year lull in serious hurricanes hitting the U.S.
  • 1989- The UN says we only have a few years left because of warming.
  • 1970-First Earth Day. Billions would die soon because of global cooling and an ice age.
  • 1922-AP and Washington Post-Coastal cities would soon be underwater because the ice caps have melted due to global warming.

Here is a small sample of questions for politicians, bureaucrats, scientists, educators, Time person’s of the year, and people who pretend to be journalists peddling the indoctrination and pushing the agenda.

How a 24-DAY heatwave on Australia’s east coast in January 1896 saw temperatures climb to 49 degrees and killed 437 people

by Freya Noble, February 14; 2017 in DailyMail

There were temperatures above 119F (48C)

It was a hot start to 1896 and by January 14, newspapers were reporting people were dying from a range of complications brought on by the extreme temperatures.

By the third week of the year, 12 infants had died from heat-related illnesses in Goulburn, NSW, alone, a report on JoNova about the heatwave revealed.

People were fleeing the cities on trains to seek refuge in the mountainous regions of the country, and one child escaping the heat ‘died at the moment the train arrived’.

Hospitals were at breaking point, and the death toll was rising.


How a 24 DAY heatwave in January 1896 saw temperatures hit 49 degrees and killed 437 people t is as if history is being erased. For all that we hear about recent record-breaking climate extremes, records that are equally extreme, and sometimes even more so, are ignored.
In January 1896 a savage blast “like a furnace” stretched across Australia from east to west and lasted for weeks. The death toll reached 437 people in the eastern states. Newspaper reports showed that in Bourke the heat approached 120°F (48.9°C) on three days (1)(2)(3). The maximumun at or above 102 degrees F (38.9°C) for 24 days straight.
By Tuesday Jan 14, people were reported falling dead in the streets. Unable to sleep, people in Brewarrina walked the streets at night for hours, the thermometer recording 109F at midnight. Overnight, the temperature did not fall below 103°F. On Jan 18 in Wilcannia, five deaths were recorded in one day, the hospitals were overcrowded and reports said that “more deaths are hourly expected”. By January 24, in Bourke, many businesses had shut down (almost everything bar the hotels). Panic stricken Australians were fleeing to the hills in climate refugee trains. As reported at the time, the government felt the situation was so serious that to save lives and ease the suffering of its citizens they added cheaper train services:

The List Grows – Now 100+ Scientific Papers Assert CO2 Has A Minuscule Effect On The Climate

by K. Richard, December 12, 2019 in NoTricksZone


Within the last few years, over 50 papers have been added to our compilation of scientific studies that find the climate’s sensitivity to doubled CO2 (280 ppm to 560 ppm) ranges from <0 to 1°C. When no quantification is provided, words like “negligible” are used to describe CO2’s effect on the climate. The list has now reached 106 scientific papers.

Link: 100+ Scientific Papers – Low CO2 Climate Sensitivity

A few of the papers published in 2019 are provided below:

NEWLY PUBLISHED SCIENTIFIC PAPER TEARS GLOBAL WARMING AND THE IPCC TO SHREDS

by Cap Allon, December 11, 2019 in Electroverse


A scientific paper entitled “An Overview of Scientific Debate of Global Warming and Climate Change” has recently come out of the University of Karachi, Pakistan. The paper’s author, Prof. Shamshad Akhtar delves into earth’s natural temperature variations of the past 1000 years, and concludes that any modern warming trend has been hijacked by political & environmental agendas, and that the science (tackled below) has been long-ignored and at times deliberately manipulated.

The published paper –available in full HERE— sets out its intent:

Climate change is NOT a new phenomenon. The palaeo-climatic studies reveal that during the Pleistocene and Holocene periods several warm and cold periods occurred, resulting in changes of sea level and in climatic processes like the rise and fall of global average temperature and rainfall.

Coal consumption likely to rise as growing demand for electricity generation in developing countries

by P. Homewood, December 17, 2019 in NotaLotofPeopleKnowThat


Coal consumption is set to rise in the coming years as growing demand for electricity in developing countries outpaces a shift to cleaner sources of electricity in industrialised nations.

While use of the most polluting fossil fuel had a historic dip in 2019, the International Energy Agency anticipates steady increases in the next five years. That means the world will face a significant challenge in meeting pledges to reduce greenhouse gas emissions that cause global warming.

Annual coal report

“There are few signs of change,” the agency wrote in its annual coal report released in Paris on Tuesday. “Despite all the policy changes and announcements, our forecast is very similar to those we have made over the past few years.”

While this year is on track for biggest decline ever for coal power, that is mostly due to high growth in hydroelectricity and relatively low electricity demand in India and China, said Carlos Fernandez Alvarez, senior energy analyst at the Paris-based IEA.

Despite the drop, global coal consumption is likely to rise over the coming years, driven by demand in India, China and Southeast Asia. Power generation from coal rose almost 2% in 2018 to reach an all-time high, remaining the world’s largest source of electricity.

Another New Study Finds The Canadian Arctic Was About 1-2°C Warmer During Medieval Times

by K. Richard, December 16, 2019 in NoTricksZone


Four reconstructions from the central and western High Arctic reveal July temperatures were about 1-2°C warmer than today during most of the 1st millennium and Medieval period (Tamo and Gajewski, 2019).

A few years ago, a chironomid reconstruction of Boothia Peninsula in the Canadian Arctic (Fortin and Gajewski, 2016) revealed not only were today’s temperatures the coldest of the last 7000 years, but the last 150 years “do not indicate a warming during this time.”


Du succès diplomatique de la COP21 aux échecs des COP…

by Samuel Furfari, 16 décembre 2019 in ConnaissanceDesEnergies


La COP25 vient de se terminer avec, comme chaque année, une avancée minime dans la bureaucratie que créé les Nations unies. Dans le même temps, l’Union européenne affirme son intention d’atteindre la neutralité carbone en 2050, c’est-à-dire de vivre dans un équilibre entre les émissions de carbone et l’absorption desdites émissions par des puits de carbone. De l’aveu même du Parlement européen(1), aucun puits de carbone artificiel n’est toutefois en mesure d’éliminer à ce jour le carbone de l’atmosphère à l’échelle nécessaire…

Ce qui est annoncé au niveau européen – sans l’accord de la Pologne qui défend son charbon – est donc en pratique un abandon des énergies fossiles. Notons ici que les hommes politiques ne s’embarrassent pas de la nuance entre neutralité carbone et décarbonation (ne plus émettre de CO2).

Madrid Summit Ends In Failure

by P. Homewood, December 16, 2019 in NotaLotofPeopleKnowThat


A marathon UN summit wrapped up Sunday with little to show, squeezing hard-earned compromises from countries over a global warming battle plan that fell well short of what science says is needed to tackle the climate crisis.

The COP25 deal “expresses the urgent need” for new carbon cutting commitments to close the gap between current emissions and the Paris treaty goal of capping temperature at below two degrees, host country Spain said in a statement.
“Today the citizens of the  world are asking for us to move ahead faster and better, in financing, adaptation, mitigation,” Carolina Schmidt, Chilean environment minister and President of COP25, told the closing plenary.

Following a year of deadly extreme weather and weekly strikes by millions of young people demanding action, negotiations in Madrid were under pressure to send a clear signal that governments were willing to double down.
The summit — moved at the last minute from Chile due to unrest — at times teetered on the brink of collapse as rich polluters, emerging powerhouses and climate-vulnerable nations groped for common ground in the face of competing national interests.
“Based on the adopted text, there is a glimmer of hope that the heart of the Paris Agreement is still beating,” said Mohamed Adow, Director of Power Shift, referring the treaty inked in the French capital.
“But its pulse is very weak.”


See also  COP25: N Climate Talks Collapse

See also  : My Thoughts: Post-Madrid #COP25

See also : UN Climate Summit Flops As Nations Deadlock On Hot-Button Issues

Huge Climatic Crowd Exaggeration! Claimed Size Of 500,000 Was 97% Lie… Only 15,000 In Madrid, Spanish Police Say

by P. Gosselin, December 13, 2019 in NoTricksZone


Grand media deception

So typical of climate science. Everything in and around it gets wildly exaggerated in order to feed media consumption and deceive the public. Reports are emerging that the “500,000 people” crowd awaiting Greta in Madrid was in fact as low as 15,000, according to Spanish federal police.

That would make the 500,000 claimed figure a 3000% exaggeration!

Scientists Found the Deepest Land on Earth Hiding Beneath Antarctica’s Ice

by Rafi Letzter, December 13, 2019 in LiveScience


A new mapping effort revealed critical new details of Antarctica’s hidden land.

A new map of the mountains, valleys and canyons hidden under Antarctica‘s ice has revealed the deepest land on Earth, and will help forecast future ice loss.

The frozen southern continent can look pretty flat and featureless from above. But beneath the ice pack that’s accumulated over the eons, there’s an ancient continent, as textured as any other. And that texture turns out to be very important for predicting how and when ice will flow and which regions of ice are most vulnerable in a warming world. The new NASA map, called BedMachine Antarctica, mixes ice movement measurements, seismic measurements, radar and other data points to create the most detailed picture yet of Antarctica’s hidden features.

Related: 50 Amazing Facts About Antarctica

“Using BedMachine to zoom into particular sectors of Antarctica, you find essential details, such as bumps and hollows beneath the ice that may accelerate, slow down or even stop the retreat of glaciers,” Mathieu Morlighem, an Earth system scientist at the University of California, Irvine and the lead author of a new paper about the map, said in a statement.

The new map, published Dec. 12 in the journal Nature Geoscience, reveals previously unknown topographical features that shape ice flow on the frozen continent.

The previously unknown features have “major implications for glacier response to climate change,” the authors wrote. “For example, glaciers flowing across the Transantarctic Mountains are protected by broad, stabilizing ridges.”

The toxic rhetoric of climate change

by Judith Curry, December 14, 2019 in ClimateEtc.


“I genuinely have the fear that climate change is going to kill me and all my family, I’m not even kidding it’s  all I have thought about for the last 9 months every second of the day. It’s making my sick to my stomach, I’m not eating or sleeping and I’m getting panic attacks daily. It’s currently 1 am and I can’t sleep as I’m petrified.”  – Young adult in the UK

Letter from a worried young adult in the UK

I received this letter last nite, via email:

“I have no idea if this is an accurate email of your but I just found it and thought I’d take a chance. My name is XXX I’m 20 years old from the UK. I have been well the only word to describe it is suffering as I genuinely have the fear that climate change is going to kill me and all my family, I’m not even kidding it’s  all I have thought about for the last 9 months every second of the day. It’s making my sick to my stomach, I’m not eating or sleeping and I’m getting panic attacks daily. It’s currently 1am and I can’t sleep as I’m petrified. I’ve tried to do my own research, I’ve tried everything. I’m not stupid, I’m a pretty rational thinker but at this point sometimes I literally wish I wasn’t born, I’m just so miserable and Petrified. I’ve recently made myself familiar with your work and would be so appreciative of any findings you can give me or hope or advice over email. I’m already vegetarian and I recycle everything so I’m really trying. Please help me. In anyway you can. I’m at my wits end here.”

JC’s response

We have been hearing increasingly shrill rhetoric from Extinction Rebellion and other activists about the ‘existential threat’ of the ‘climate crisis’, ‘runaway climate chaos’, etc. In a recent op-ed, Greta Thunberg stated: “Around 2030 we will be in a position to set off an irreversible chain reaction beyond human control that will lead to the end of our civilization as we know it.”  From the Extinction Rebellion: “It is understood that we are facing an unprecedented global emergency. We are in a life or death situation of our own making.”

#COP25 – The Neverending $tory

by Anthony Watts, December 15, 2019 in WUWT


Failure In Madrid As COP25 Climate Summit Ends In Disarray

Negotiations at a U.N. climate summit in Madrid broke down today as the two-week meeting ended without a crucial agreement on the global carbon market rules of the Paris Agreement.

After extending the two-week summit for an additional two days, the world’s countries agreed a text with vague pledges to enhance their Paris emissions reductions targets. But the watered-down text reflects a failure to agree on the key outcomes that were needed at the summit: setting a rulebook for the Paris Agreement and designing a global carbon market.

Donald Trump has filed paperwork to remove the United States from the Paris Agreement, signed by his predecessor Barack Obama, next November – the earliest date the U.S. can leave. The U.S. absence has left the EU alone in trying to bring developing countries like China and India on board.

“COP25 has been mired in the politics of low ambition that seek to serve individual agendas in a way that is totally out of step with the urgent need for collective action,” said Eliot Whittington, director of the European Corporate Leaders Group, a collection of climate-ambitious CEOs.

Full story here


See also : COP25: UN’s Climate Summit Produced Net-Zero Benefits

Human Activity in China and India Dominates the Greening of Earth, NASA Study Shows

by NASA, February 11, 2019


The world is literally a greener place than it was 20 years ago, and data from NASA satellites has revealed a counterintuitive source for much of this new foliage: China and India. A new study shows that the two emerging countries with the world’s biggest populations are leading the increase in greening on land. The effect stems mainly from ambitious tree planting programs in China and intensive agriculture in both countries.

The greening phenomenon was first detected using satellite data in the mid-1990s by Ranga Myneni of Boston University and colleagues, but they did not know whether human activity was one of its chief, direct causes. This new insight was made possible by a nearly 20-year-long data record from a NASA instrument orbiting the Earth on two satellites. It’s called the Moderate Resolution Imaging Spectroradiometer, or MODIS, and its high-resolution data provides very accurate information, helping researchers work out details of what’s happening with Earth’s vegetation, down to the level of 500 meters, or about 1,600 feet, on the ground.

A world map showing the trend in annual average leaf area, in percent per decade (2000-2017)
The world is a greener place than it was 20 years ago, as shown on this map, where areas with the greatest increase in foliage are indicated in dark green. Data from a NASA instrument orbiting Earth aboard two satellites show that human activity in China and India dominate this greening of the planet.
Credits: NASA Earth Observatory

Taken all together, the greening of the planet over the last two decades represents an increase in leaf area on plants and trees equivalent to the area covered by all the Amazon rainforests. There are now more than two million square miles of extra green leaf area per year, compared to the early 2000s – a 5% increase.

“China and India account for one-third of the greening, but contain only 9% of the planet’s land area covered in vegetation – a surprising finding, considering the general notion of land degradation in populous countries from overexploitation,” said Chi Chen of the Department of Earth and Environment at Boston University, in Massachusetts, and lead author of the study.

Barrels of ancient Antarctic air aim to track history of rare gas

by University of Washington, December 13, 2019 in ScienceDaily


An Antarctic field campaign last winter led by the US and Australia has successfully extracted some of the largest samples of air dating from the 1870s until today. Researchers will use the samples to look for changes in the molecules that scrub the atmosphere of methane and other gases.

“It’s probably the most extreme atmospheric chemistry you can do from ice core samples, and the logistics were also extreme,” said Peter Neff, a postdoctoral researcher with dual appointments at the UW and at the University of Rochester.

But the months the team spent camped on the ice at the snowy Law Dome site paid off.

“This is, to my knowledge, the largest air sample from the 1870s that anyone’s ever gotten,” Neff said. His 10 weeks camped on the ice included minus-20 degrees Fahrenheit temperatures and several snowstorms, some of which he shared from Antarctica via Twitter.

Air from deeper ice cores drilled in Antarctica and Greenland has provided a record of carbon dioxide and methane, two greenhouse gases, going back thousands of years. While carbon dioxide has a lifetime of decades to centuries, an even more potent gas, methane, has a lifetime of just nine or 10 years.

CMIP5 Model Atmospheric Warming 1979-2018: Some Comparisons to Observations

by Roy Spencer, December 12, 2019 in WUWT


I keep getting asked about our charts comparing the CMIP5 models to observations, old versions of which are still circulating, so it could be I have not been proactive enough at providing updates to those. Since I presented some charts at the Heartland conference in D.C. in July summarizing the latest results we had as of that time, I thought I would reproduce those here.

The following comparisons are for the lower tropospheric (LT) temperature product, with separate results for global and tropical (20N-20S). I also provide trend ranking “bar plots” so you can get a better idea of how the warming trends all quantitatively compare to one another (and since it is the trends that, arguably, matter the most when discussing “global warming”).

From what I understand, the new CMIP6 models are exhibiting even more warming than the CMIP5 models, so it sounds like when we have sufficient model comparisons to produce CMIP6 plots, the discrepancies seen below will be increasing.

Global Comparisons

First is the plot of global LT anomaly time series, where I have averaged 4 reanalysis datasets together, but kept the RSS and UAH versions of the satellite-only datasets separate. (Click on images to get full-resolution versions).

Big volcanic bump unlike anything seen before found on the moon

by R.G. Andrews, December 13, 2019 in NationalGeography


Scientists scouring the lunar surface for clues to past impact rates found a bonus feature that has geologists “thoroughly confused.”

Sometime after the solar system formed 4.6 billion years ago, a projectile slammed into Earth’s youthful moon and formed the 620-mile-wide basin known as the Crisium basin. No one knows exactly when this impact happened, but for decades scientists have been trying to solve the puzzle as part of a larger debate over whether the moon and, by proxy, Earth endured a period of frenzied meteor bombardment in their early histories.

Now, scientists scouring the region say they’ve spotted a crater within the basin that appears to contain pristine impact melt, a type of volcanic rock that can act like a definitive geologic clock. If future astronauts or a robot could obtain a sample and tease out its age, that may help reveal what was happening on Earth during the primordial period when life first emerged on our planet.

And, as an added bonus, the discovery comes with an intriguing mystery: The basin also holds a geologic blister the size of Washington, D.C., that’s unlike anything else seen in the solar system. As the team reports in an upcoming paper in the Journal of Geophysical Research: Planets, this volcanic lump appears to have been inflated and cracked by peculiar underground magmatic activity that the researchers can’t currently explain.

“I’m thoroughly confused by it,” says Clive Neal, an expert in lunar geology at the University of Notre Dame who was not involved with the new research.


GLOBAL TEMPERATURES HOLDING STEADY FOR TWO DECADES

by Climate Science, December 13,  2019


Global temperatures have been holding nearly steady for almost two decades according to satellites from the Remote Sensing Systems (RSS) and University of Alabama at Huntsville (UAH).6You will never see that in the mass media.

2018 is the 3rd year in a row of cooling global temperatures – So far 2018 was the third year in a row that the globe has cooled off from its El Nino peak set in 2015.

Norwegian Professor Ole Humlum explained in his 2018 “State of the Climate Report”: “After the warm year of 2016, temperatures last year (in 2018) continued to fall back to levels of the so-called warming ‘pause’ of 2000-2015. There is no sign of any acceleration in global temperature, hurricanes or sea-level rise. These empirical observations show no sign of acceleration whatsoever.”

While 2005, 2010, 2015, and 2016 were declared the “hottest years” or “near -hottest,”  based on heavily altered surface data by global warming proponents, a closer examination revealed the claims were “based on year-to-year temperature data that differs by only a few HUNDREDTHS of a degree to tenths of a degree Fahrenheit – differences that were within the margin of error in the data.” 7

MIT climate scientist Dr. Richard Lindzen ridiculed “hottest year” claims. “The uncertainty here is tenths of a degree. It’s just nonsense. This is a very tiny change period,” Lindzen said. “If you can adjust temperatures to 2/10ths of a degree, it means it wasn’t certain to 2/10ths of a degree.”

In 2015, the Associated Press was forced to issue a “clarification” on “hottest year” claims, stating in part: “The story also reported that 2014 was the hottest year on record, according to the National Oceanic and Atmospheric Administration and NASA, but did not include the caveat that other recent years had average temperatures that were almost as high  – and they all fall within a margin of error that lessens the certainty that any one of the years was the hottest.”

Climatologist Pat Michaels explained that, in any case, the world’s temperature “should be near the top of the record given the record only begins in the late 19th century when the surface temperature was still reverberating from the Little Ice Age.”

“Hottest year” claims are purely political statements designed to persuade the public that the government needs to take action on man-made climate change. In addition, the claims of “hottest year” are based on surface data only dating back to the late 19th century, and also ignore the temperature revisions made by NASA and NOAA that have enhanced the warming trend by retroactively cooling the past. 8

6 The Pause Lives on: Global Satellites: 2016 not Statistically Warmer than 1998 – Climatologist Dr. Roy Spencer – January 4, 2017
7 Dr. David Whitehouse noted the ‘temperature pause never went away’ – January 19, 2017
8 Climate analyst Tony Heller – Real Climate Science – February 14, 2017

3000-Year-Old Trees Excavated Under Icelandic Glacier

by P. Homewood, December 12, 2019 in NotaLotofPeopleKnowThat


Ancient tree stumps found under Breiðamerkurjökull glacier in Southeast Iceland are confirmed to be roughly 3,000 years old. RÚV reports.

A specialist believes the remarkably well-preserved stumps were part of a massive forest that disappeared after a long period of a warm climate.

One of the tree stumps was found in Breiðamerkursandur a couple of months ago, and once it was being salvaged a second, larger one was found. The smaller one was sent for examination while the larger will be examined at a later time.

Examinations revealed that the tree stump died very quickly at 89-years-old in the month of June. Nearby sediments and data suggest that the glacier itself was the culprit.

The tree stumps are from a period when Iceland was covered in forests. Even though 9th century Norse settlers reported vast forests across the country, it is believed that 3,000 years ago, the forests were much larger, even reaching the highlands. Approximately 500 BC, the climate became colder and glaciers began to form, destroying parts of the forests.

The 3,000-year-old remains of the forest are very well preserved and will be researched thoroughly. “It is absolutely incredible just how well preserved this tree stump is, having been buried under a glacier and that it still looks so whole, as opposed to being all wrinkled up like many of the specimens we have found.” Once examinations conclude, the water will be extracted from the tree stump and it will be filled with wax instead, allowing it to be exhibited.

https://www.icelandreview.com/news/3000-year-old-trees-excavated-under-glacier/

Discovering ancient forests under receding glaciers is not confined to Iceland. Remains of trees dating back to the Middle Ages have been found under the Juneau and Exit Glaciers in Alaska, as well under glaciers in Patagonia.

Tree stumps have also turned up under Swiss glaciers, carbon dated to about 4000 years ago.

The simple reality is that glaciers worldwide expanded enormously during the Little Ice Age, arguably to their greatest extent since the Ice Age. Despite decades of retreat since the 19thC, they are still abnormally large by historical standards.

The 2019 Atlantic Hurricane Season

by P. Homewood, December 11, 2019 in NotaLotofPeopleKnowThat


The Atlantic hurricane season has now officially ended, so let’s check the numbers.

https://www.aoml.noaa.gov/hrd/tcfaq/E11.html

http://rammb.cira.colostate.edu/products/tc_realtime/season.asp?storm_season=2019

There have been six hurricanes in total, including three major ones, Dorian, Humberto and Lorenzo. Coincidentally both numbers are the same as the average since 1950.

According to NOAA’s Hurricane Research Division, many hurricanes were missed in the earlier decades. Systematic aircraft reconnaissance began in 1944, but this only covered half of the Atlantic basin, until daily satellite monitoring started in 1966.

Victoria Secrets Exposed…More Falsehoods By Spiegel, Guardian… Victoria Falls Variability Nothing To Do With CO2.

by P. Gosselin, December 11, 2019 in NoTricksZone


Not CO2 related

A little later in the report we also find a flow diagram for the Victoria Falls:

Figure: Water flow rate-volume at the Victoria Falls an den 1907-2006. Source: Beilfuss 2012 (immediately pdf)

We see a strong variability from year to year. On a scale of several decades, the period 1940-1980 is characterized by particularly high flow rates. The early 20th century was rather dry. A coupling to the 60-year-old ocean cycle offers itself. The Pacific is far away, but the wet Zambezi phase fits quite well into the negative PDO:

igure: The Pacific Decadal Oscillation (PDO). Source: By Giorgiogp2 – Own work, CC BY-SA 3.0, https://commons.wikimedia.org/w/index.php?curid=13297650


Snow Record – Submerged Alps with extraordinary accumulations

by Robert, December 7, 2019 in IceAgeNow


In the face of Global Warming we see scenarios from the ice age.

The Alps were submerged in snow, with truly dramatic accumulations up to 1,500m above sea level, especially considering that we are still at the end of November.

Here are the incredible data:

295cm of snow on the ground at Rifugio Gastaldi – Balme (2.659m asl),
263cm at Macugnaga Rifugio Zamboni (2.075m),
239cm at Rifugio Vaccarone – Giaglione (2.745) m),
227cm at Lago Agnel – Ceresole Reale (2.304m),
222cm at Lago Dietro La Torre – Usseglio (2.360m) and Bocchetta Delle Pisse – Alagna Valsesia (2.410m),
197cm at Larecchio – Montecrestese (1.860m) and Lemon Pancani – Limone Piemonte (1.875m),
191cm in Formazza (2.453m),
188cm in the Del Chiotas Dam – Entracque (2.020m),
185cmin Malciaussia – Usseglio (1,800m),
172cm at Passo Del Moro – Macugnaga (2.820m), 169cm in Clot Of Soma – Pragelato (2.150m),
166cm in Alpe Veglia – Varzo (1.740m),
164cm in Grange Martina – Giaglione (1.967m),
163cm Pian Giasset – Crissolo (2.150m) and Lago Pilone – Sauze D’oulx (2.280m),
156cm Rifugio Mondovi – Roccaforte Mondovi (1.760m),
152cm at Sommeiller – Bardonecchia (2.981m), 150cm in Pian Delle Baracche – Sampeyre (2.135m),
137cm in Alpe Devero – Baceno (1.634m),
129cm in Camparient – Trivero (1.515m),
124cm in Sestriere (2.020m).
Per approfondire http://www.meteoweb.eu/2019/11/meteo-alpi-sommerse-neve-piemonte-sestriere/1350156/#U03AfALMXOVSWFCe.99

See incredible photos:
http://www.meteoweb.eu/2019/11/meteo-alpi-sommerse-neve-piemonte-sestriere/1350156/#1

A Geological Perspective on Sea Level Rise Acceleration

by David Middleton, December 9, 2019 in WUWT


There have been at least three recent peer-reviewed papers asserting an anthropogenic acceleration in the rate of sea level rise (SLR): Church & White, 2006 (CW06), Church & White, 2011 (CW11) and Nerem et al., 2018 (N18). N18 only covers the satellite era (since 1993) and might actually be correct, albeit irrelevant. The primary culprits in the SLR acceleration scam are CW06 and CW11. Two other recent peer-reviewed papers clearly shoot down the notion of a recent anthropogenic acceleration: Jevrejeva et al., 2008 (J08) and Jevrejeva et al., 2014 (J14). This post will focus on CW11 (updated through 2013) and J14.

J08 and J14 indicate that the acceleration, to the extent there is one, started 150-200 years ago, consistent with the end of neoglaciation and that a quasi-periodic fluctuation (~60-yr cycle) is present. CW06 and CW11 also note the 19th Century acceleration; but also assert a more recent acceleration, presumably due to anthropogenic global warming. This SLR acceleration is, at worst, innocuous.

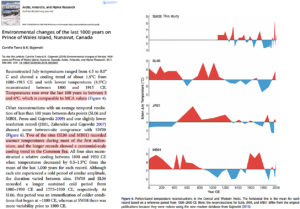
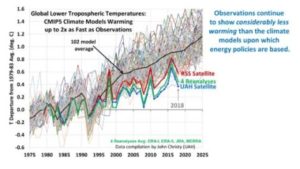
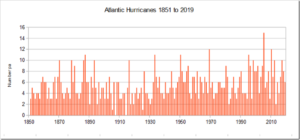
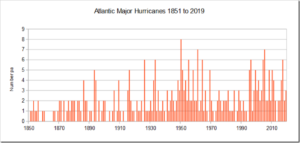
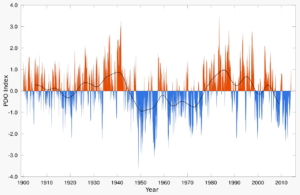
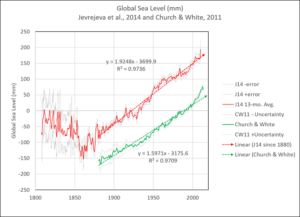
Figure 1. Jevrejeva et al., 2014 (red) and Church & White, 2011 (green).
….

TRIBUNE. Pourquoi les affirmations catastrophistes sur le climat sont fausses

by M. Schellenberger, 10 décembre 2019 in LePoint


Pour l’écologiste pragmatique Michael Shellenberger, les déclarations apocalyptiques s’avèrent scientifiquement erronées et politiquement contre-productives.

Ces dernières semaines, les journalistes et les défenseurs de l’environnement ont fait un certain nombre de prédictions apocalyptiques sur l’impact du changement climatique. L’écologiste Bill McKibben a suggéré qu’en Australie, les incendies causés par le climat avaient rendu les koalas « pratiquement éteints ». Extinction Rebellion affirme : « Des milliards de gens mourront » et « la vie sur Terre est en train de s’éteindre ». Vice magazine soutient que « l’effondrement de la civilisation a peut-être déjà commencé ».

Peu ont plus attiré l’attention sur cette menace que la militante étudiante Greta Thunberg et la représentante démocrate Alexandria Ocasio-Cortez, sponsor du Green New Deal. Cette dernière prétend que « le monde va s’écrouler dans douze ans si nous ne nous attaquons pas au changement climatique ». Dans son nouveau livre, Thunberg affirme : « Vers 2030, nous serons en situation de déclencher une réaction en chaîne irréversible hors du contrôle humain, qui conduira à la fin de la civilisation telle que nous la connaissons. »


See also here: At UN Climate Summit, Alarmists Put Dogma Over Science

Climate Models Have Not Improved in 50 Years

by David Middleton, December 6, 2019 in WUWT


The accuracy of the failed models improved when they adjusted them to fit the observations… Shocking.

The AGU and Wiley currently allow limited access to Hausfather et al., 2019. Of particular note are figures 2 and 3. I won’t post the images here due to the fact that it is a protected limited access document.

Figure 2: Model Failure

Figure 2 has two panels. The upper panel depicts comparisons of the rates of temperature change of the observations vs the models, with error bars that presumably represent 2σ (2 standard deviations). According to my Mark I Eyeball Analysis, of the 17 model scenarios depicted, 6 were above the observations’ 2σ (off the chart too much warming), 4 were near the top of the observations’ 2σ (too much warming), 2 were below the observations’ 2σ (off the chart too little warming), 2 were near the bottom of the observations’ 2σ (too little warming), and 3 were within 1σ (in the ballpark) of the observations.

Figure 2. Equilibrium climate sensitivity (ECS) and transient climate response