Tous les articles par Alain Préat

Full-time professor at the Free University of Brussels, Belgium apreat@gmail.com apreat@ulb.ac.be • Department of Earth Sciences and Environment Res. Grp. - Biogeochemistry & Modeling of the Earth System Sedimentology & Basin Analysis • Alumnus, Collège des Alumni, Académie Royale de Sciences, des Lettres et des Beaux Arts de Belgique (mars 2013). http://www.academieroyale.be/cgi?usr=2a8crwkksq&lg=fr&pag=858&rec=0&frm=0&par=aybabtu&id=4471&flux=8365323 • Prof. Invited, Université de Mons-Hainaut (2010-present-day) • Prof. Coordinator and invited to the Royal Academy of Sciences of Belgium (Belgian College) (2009- present day) • Prof. partim to the DEA (third cycle) led by the University of Lille (9 universities from 1999 to 2004) - Prof. partim at the University of Paris-Sud/Orsay, European-Socrates Agreement (1995-1998) • Prof. partim at the University of Louvain, Convention ULB-UCL (1993-2000) • Since 2015 : Member of Comité éditorial de la Revue Géologie de la France http://geolfrance.brgm.fr • Since 2014 : Regular author of texts for ‘la Revue Science et Pseudosciences’ http://www.pseudo-sciences.org/ • Many field works (several weeks to 2 months) (Meso- and Paleozoic carbonates, Paleo- to Neoproterozoic carbonates) in Europe, USA (Nevada), Papouasia (Holocene), North Africa (Algeria, Morrocco, Tunisia), West Africa (Gabon, DRC, Congo-Brazzaville, South Africa, Angola), Iraq... Recently : field works (3 to 5 weeks) Congo- Brazzaville 2012, 2015, 2016 (carbonate Neoproterozoic). Degree in geological sciences at the Free University of Brussels (ULB) in 1974, I went to Algeria for two years teaching mining geology at the University of Constantine. Back in Belgium I worked for two years as an expert for the EEC (European Commission), first on the prospecting of Pb and Zn in carbonate environments, then the uranium exploration in Belgium. Then Assistant at ULB, Department of Geology I got the degree of Doctor of Sciences (Geology) in 1985. My thesis, devoted to the study of the Devonian carbonate sedimentology of northern France and southern Belgium, comprised a significant portion of field work whose interpretation and synthesis conducted to the establishment of model of carbonate platforms and ramps with reefal constructions. I then worked for Petrofina SA and shared a little more than two years in Angola as Director of the Research Laboratory of this oil company. The lab included 22 people (micropaleontology, sedimentology, petrophysics). My main activity was to interpret facies reservoirs from drillings in the Cretaceous, sometimes in the Tertiary. I carried out many studies for oil companies operating in this country. I returned to the ULB in 1988 as First Assistant and was appointed Professor in 1990. I carried out various missions for mining companies in Belgium and oil companies abroad and continued research, particularly through projects of the Scientific Research National Funds (FNRS). My research still concerns sedimentology, geochemistry and diagenesis of carbonate rocks which leads me to travel many countries in Europe or outside Europe, North Africa, Papua New Guinea and the USA, to conduct field missions. Since the late 90's, I expanded my field of research in addressing the problem of mass extinctions of organisms from the Upper Devonian series across Euramerica (from North America to Poland) and I also specialized in microbiological and geochemical analyses of ancient carbonate series developing a sustained collaboration with biologists of my university. We are at the origin of a paleoecological model based on the presence of iron-bacterial microfossils, which led me to travel many countries in Europe and North Africa. This model accounts for the red pigmentation of many marble and ornamental stones used in the world. This research also has implications on the emergence of Life from the earliest stages of formation of Earth, as well as in the field of exobiology or extraterrestrial life ... More recently I invested in the study from the Precambrian series of Gabon and Congo. These works with colleagues from BRGM (Orléans) are as much about the academic side (consequences of the appearance of oxygen in the Paleoproterozoic and study of Neoproterozoic glaciations) that the potential applications in reservoir rocks and source rocks of oil (in collaboration with oil companies). Finally I recently established a close collaboration with the Royal Institute of Natural Sciences of Belgium to study the susceptibility magnetic signal from various European Paleozoic series. All these works allowed me to gain a thorough understanding of carbonate rocks (petrology, micropaleontology, geobiology, geochemistry, sequence stratigraphy, diagenesis) as well in Precambrian (2.2 Ga and 0.6 Ga), Paleozoic (from Silurian to Carboniferous) and Mesozoic (Jurassic and Cretaceous) rocks. Recently (2010) I have established a collaboration with Iraqi Kurdistan as part of a government program to boost scientific research in this country. My research led me to publish about 180 papers in international and national journals and presented more than 170 conference papers. I am a holder of eight courses at the ULB (5 mandatory and 3 optional), excursions and field stages, I taught at the third cycle in several French universities and led or co-managed a score of 20 Doctoral (PhD) and Post-doctoral theses and has been the promotor of more than 50 Masters theses.

2019 ENSO forecast

by  J. Curry and J. Johnstone, April 9, 2019 in WUWT


CFAN’s 2019 ENSO forecast is for a transition away from El Niño conditions as the summer progresses. The forecast for Sept-Oct-Nov 2019 calls for 60% probability of ENSO neutral conditions, with 40% probability of weak El Niño conditions. – Forecast issued 3/25/19

Introduction

CFAN’s early season ENSO forecast is motivated by preparing our seasonal forecast for Atlantic hurricane activity. ENSO forecasts made in spring have traditionally had very low skill owing to the ENSO ‘spring predictability barrier.’

During fall 2018, there was warming in the Central Equatorial Pacific, leading to a weak El Niño Modoki pattern, which impacted the latter part of the Atlantic hurricane season. This transitioned to a weak (conventional) El Niño in February 2019 and the atmospheric anomalies became more consistent with a conventional El Niño pattern.

NOAA’s latest forecast: Weak El Niño conditions are likely to continue through the Northern Hemisphere spring 2019 (~80% chance) and summer (~60% chance).

CFAN’s ENSO forecast analysis is guided by the ECMWF SEAS5 seasonal forecast system and a newly developed statistical forecast scheme based on global climate dynamics analysis.

ENSO statistics

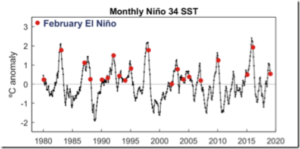
Figure 1 illustrates the recent ENSO history as depicted by monthly Niño 3.4 anomalies from 1980 to February 2019.

Less Ice In Arctic Ocean 6000-7000 Years Ago

by Geological Survey of Norway, October 20, 2008 in ScienceDaily


Recent mapping of a number of raised beach ridges on the north coast of Greenland suggests that the ice cover in the Arctic Ocean was greatly reduced some 6000-7000 years ago. The Arctic Ocean may have been periodically ice free.

”The climate in the northern regions has never been milder since the last Ice Age than it was about 6000-7000 years ago. We still don’t know whether the Arctic Ocean was completely ice free, but there was more open water in the area north of Greenland than there is today,” says Astrid Lyså, a geologist and researcher at the Geological Survey of Norway (NGU).

Global Energy & CO2 Status Report

by IEA, March 2019 (.pdf)


Key Findings 2018

Global energy consumption in 2018 increased at nearly twice the average rate of growth since 2010, driven by a robust global economy and higher heating and cooling needs in some parts of the world. Demand for all fuels increased, led by natural gas, even as solar and wind posted double-digit growth. Higher electricity demand was responsible for over half of the growth in energy needs. Energy efficiency saw lacklustre improvement.

Energy-related CO2 emissions rose 1.7% to a historic high of 33.1 Gt CO2. While emissions from all fossil fuels increased, the power sector accounted for nearly two-thirds of emissions growth. Coal use in power alone surpassed 10 Gt CO2, mostly in Asia. China, India, and the United States accounted for 85% of the net increase in emissions, while emissions declined for Germany, Japan, Mexico, France and the United Kingdom.

Oil demand rose by 1.3% in 2018, led by strong growth in the United States. The start-up of large petrochemical projects drove product demand, which partially offset a slowdown in growth in gasoline demand. The United States and China showed the largest overall growth, while demand fell in Japan and Korea and was stagnant in Europe.

Natural gas consumption grew by an estimated 4.6%, its largest increase since 2010 when gas demand bounced back from the global financial crisis. This second consecutive year of strong growth, following a 3% rise in 2017, was driven by growing energy demand and substitution from coal. The switch from coal to gas accounted for over one-fifth of the rise in gas demand. The United States led the growth followed by China.

Coal demand grew for a second year, but its role in the global mix continued to decline. Last year’s 0.7% increase was significantly slower than the 4.5% annual growth rate seen in the period 2000- 10. But while the share of coal in primary energy demand and in electricity generation slowly continues to decrease, it still remains the largest source of electricity and the second-largest source of primary energy.

Nuclear Power Can Save the World

by J.S. Goldstein et al., April 6, 2019


As young people rightly demand real solutions to climate change, the question is not what to do — eliminate fossil fuels by 2050 — but how. Beyond decarbonizing today’s electric grid, we must use clean electricity to replace fossil fuels in transportation, industry and heating. We must provide for the fast-growing energy needs of poorer countries and extend the grid to a billion people who now lack electricity. And still more electricity will be needed to remove excess carbon dioxide from the atmosphere by midcentury.


To Peak or Not to Peak? That is the question.

by Mike Jonas, April 8, 2019 in WUWT


A lot has been written about Peak Oil recently – perhaps more in comments than in WUWT articles themselves – and the “Not to Peak”-ers seem to be in the ascendancy. In other words, the opinions that “Peak Oil” is a fantasy and/or oil production will keep increasing for a century or more seem to be dominant.

But just how realistic are the “Not to Peak”-ers?

I had a look back at my article of 4 years ago (Peak Oil Re-visited), and I’m pretty comfortable with what I said back then. NB. I defined “Peak Oil” as When the rate of oil production reaches its maximum. With this definition, Peak Oil is not when we run out of oil, and it is not when we can’t increase the rate of oil production. If you want to use one of those other definitions then different rules apply. And I’m only talking about oil, not about oil and gas, and not about fossil fuels generally.

What I said in 2015 was:

  • The reason for oil production reaching its maximum is not specified.
  • Peak Oil is not necessarily a disaster, it could even be a positive.
  • One idea which surely is not open to argument is the fact that oil production will peak.
  • Predicting Peak Oil has always been an unrewarding exercise. People have predicted Peak Oil for over a century and have been wrong every time.
  • The principal factors affecting oil supply are: Geology, Politics, Demand, Price, Technology.
  • In spite of economic booms and busts, oil demand has been relatively inelastic.
  • Although Peak Oil may occur after say 2040, it could well be much earlier.

The third bullet above (oil production will peak) was justified by this graph, which looked at past and likely future oil production on a scale of thousands of years:


The shale revolution (as BP calls it) has made a difference, but it still can’t dramatically alter the shape of the graph in Figure 1. Basically, it can push the peak up, and it can elongate the tail, but it can’t move the peak very far to the right.

Figure 1. World Total Fossil Fuel Consumption, past and predicted – the long view.

Scientists Document No Clear Warming Role For CO2 During The Last Deglaciation – Or The Last 10,000 Years

by K. Richard, April 4, 2019 in NoTricksZone


A new paper indicates the rise in CO2 concentration occurred well after the Northern Hemisphere’s ocean circulation changes drove the abrupt warming (~11,700 years ago) that ended the last ice age – a lag that effectively leaves no causal role for CO2 during deglaciation.


Australia Surface Temperatures Compared to UAH Satellite Data Over the Last 40 Years

by Roy Spencer, April 3, 2019 in GlobalWarming


Summary: The monthly anomalies in Australia-average surface versus satellite deep-layer lower-tropospheric temperatures correlate at 0.70 (with a 0.57 deg. C standard deviation of their difference), increasing to 0.80 correlation (with a 0.48 deg. C standard deviation of their difference) after accounting for precipitation effects on the relationship. The 40-year trends (1979-2019) are similar for the raw anomalies (+0.21 C/decade for Tsfc, +0.18 deg. C for satellite), but if the satellite and rainfall data are used to estimate Tsfc through a regression relationship, the adjusted satellite data then has a reduced trend of +0.15 C/decade. Thus, those who compare the UAH monthly anomalies to the BOM surface temperature anomalies should expect routine disagreements of 0.5 deg. C or more, due to the inherently different nature of surface versus tropospheric temperature measurements.

Conclusions

The UAH tropospheric temperatures and BOM surface temperatures in Australia are correlated, with similar variability (0.70 correlation).
Accounting for anomalous rainfall conditions increases the correlation to 0.80. The Tsfc trends have a slightly greater warming trend than the tropospheric temperatures, but the reasons for this are unclear. Users of the UAH data should expect monthly differences between the UAH and BOM data of 0.6 deg. C or so on a rather routine basis (after correcting for their different 30-year baselines used for anomalies: BOM uses 1961-1990 and UAH uses 1981-2010).

Higher energy demand drove up global CO2 emissions in 2018

by IEA, April 7, 2019


Higher energy demand drove up global CO2 emissions in 2018
We released our second annual report on global energy trends last week, highlighting that energy demand worldwide grew by 2.3% in 2018, its fastest pace this decade, thanks to a strong global economy and higher demand for heating and cooling.
Natural gas emerged as the fuel of choice, posting the biggest gains and accounting for 45% of the rise in energy consumption. Solar and wind generation grew at double-digit pace, with solar alone increasing by 31%. Still, that was not fast enough to meet higher electricity demand around the world that also drove up coal use.

As a result, global energy-related CO2 emissions rose by 1.7% to 33 Gigatonnes (Gt) with coal use in power generation alone surpassing 10 Gt and accounting for a third of total emissions. The majority of that was from coal-fired generation capacity in Asia, with a fleet of young power plants that are decades short of average lifetimes of around 50 years.

If CO2 Caused Mid-Pliocene Warming, What Caused late-Pliocene Cooling? You Guessed!

by P. Homewood, April 7, 2019 in NotaLotofPeopleKnowThat


ABSTRACT

It is thought that the Northern Hemisphere experienced only ephemeral glaciations from the Late Eocene to the Early Pliocene epochs (about 38 to 4 million years ago), and that the onset of extensive glaciations did not occur until about 3 million years ago. Several hypotheses have been proposed to explain this increase in Northern Hemisphere glaciation during the Late Pliocene. Here we use a fully coupled atmosphere-ocean general circulation model and an ice-sheet model to assess the impact of the proposed driving mechanisms for glaciation and the influence of orbital variations on the development of the Greenland ice sheet in particular. We find that Greenland glaciation is mainly controlled by a decrease in atmospheric carbon dioxide during the Late Pliocene. By contrast, our model results suggest that climatic shifts associated with the tectonically driven closure of the Panama seaway, with the termination of a permanent El Niño state or with tectonic uplift are not large enough to contribute significantly to the growth of the Greenland ice sheet; moreover, we find that none of these processes acted as a priming mechanism for glacial inception triggered by variations in the Earth’s orbit.

https://www.researchgate.net/publication/23222627_Late_Pliocene_Greenland_glaciation_controlled_by_a_decline_in_atmospheric_CO2_levels


….

CO2 Emissions Up As Europeans Switch From Diesel To Gasoline Cars

by K. Oroschakoff, April 6, 2019 in WUWT


The aftermath of the Dieselgate scandal is pushing drivers to switch from diesel to gasoline cars, undermining efforts to cut carbon dioxide emissions from road transport.

Average CO2 emissions from new cars rose in 2017 for the first time since 2010 — largely due to the fuel change, according to final data released by the European Environment Agency (EEA) on Thursday.

That’s bad news for the EU’s efforts to cut emissions by at least 40 percent by 2030. Cars are responsible for around 12 percent of total EU CO2 emissions, according to the European Commission.

The EEA said that average CO2 emissions from new cars sold in 2017 increased by 0.4 grams of CO2 per kilometer to 118.5 grams, up from 118.1 grams in 2016. Under EU rules, carmakers need to meet a fleet-wide target of 95 grams by 2021.

Since 2010, emissions from new cars have fallen by 15.5 percent, or almost 22 grams of CO2 per kilometer; but emission reductions slowed between 2015 and 2016.

The rise in car pollution in 2017 is “stark confirmation that car makers need to achieve further and faster improvements in manufacturing and promoting more efficient cars,” the EEA said.

What would life be like without fossil fuels such as gas and oil?

by Anthony Watts, April 6, 2019 in WUWT


Leftists like Bill McKibben of 350.org suffer from irrational fantasies that lead them to believe that we can move society forward without all the benefits that petroleum brings to our modern society.

They’re dead wrong of course, and this short humorous video illustrates just what life might be like without the many products and energy sources that are derived from petroleum. My favorite is ink, which if we didn’t get from petroleum, we wouldn’t have to see print editions of NYT, WaPo, and the Lost Angeles Times, to name a few.

You also wouldn’t be able to read this article, because the very keyboard I am typing this on is made from plastic, which you guessed it, is derived from petroleum.

According to the US Energy Information Administration (EIA), this is a list of petroleum products and their share of total US petroleum consumption in 2013.

  • Gasoline 46%

  • Heating Oil / Diesel Fuel 20%

  • Jet Fuel ( kerosene) 8%

  • Propane / Propylene 7%

  • NGL / LRG 6%

  • Still Gas 4%

  • Petrochemical Feedstocks 2%

  • Petroleum Coke 2%

  • Residual / Heavy Fuel Oil 2%

  • Asphalt / Road Oil 2%

  • Lubricants 1%

  • Miscellaneous Products / Special Naphthas 0.4%

  • Other Liquids 1%

  • Aviation Gasoline 0.1%

  • Waxes 0.04%

  • Kerosene 0.02%

Nuclear power excluded from EU’s green investment label

by C. Stam & A. Prager, April 3, 2019 in EurActiv


The text voted in Parliament also excludes fossil fuels and gas infrastructure from the EU’s proposed green finance taxonomy, which aims to divert investments away from polluting industries into clean technologies.

In a bid to prevent “green-washing”, the Parliament text also requires investors to disclose whether their financial products have sustainability objectives, and if they do, whether the product is consistent with the EU’s green assets classification, or taxonomy.

While activists applauded the move, they said the classification voted by the European Parliament was too narrow and applies only to a limited set of recognisable green assets, such as wind and solar power companies.

“Brown list” rejected

An amendment to publish a “brown list” to name and shame investments seen as damaging for the environment was rejected by Parliament.

‘L’impossible équation des écologistes’

by Prof. Ch. Leclercq-Willain, 5 avril 2019 in ScienceClimatEnergie


Depuis plusieurs années un des combats mené par les écologistes dans différents pays européens (Allemagne, France, Belgique, ..) fut et reste celui du nucléaire mené actuellement en parallèle avec celui de la réduction des gaz à effet de serre (GES). Les « verts » allemands ont obtenu la fermeture de presque toutes les centrales nucléaires et l’Allemagne a toujours une exploitation importante de centrales gaz-charbon. L’Allemagne est ainsi le plus grand émetteur de CO2 en Europe. Il en est de même des pays de l’Est et de la Russie qui exploitent essentiellement des centrales gaz-charbon. En Belgique, la fermeture définitive des centrales nucléaires est prévue pour 2025.

What’s the worst case? Climate sensitivity

by Judith Curry, April 1, 2019 in WUWT


Are values of equilibrium climate sensitivity > 4.5 C plausible?

For background, see these previous posts on climate sensitivity [link]

Here are some possibilistic arguments related to climate sensitivity.  I don’t think the ECS example is the best one to illustrate these ideas [see previous post], and I probably won’t include this example in anything I try to publish on this topic (my draft paper is getting too long anyways).  But possibilistic thinking does point you in some different directions when pondering the upper bound of plausible ECS values.

5. Climate sensitivity

Equilibrium climate sensitivity (ECS) is defined as the amount of temperature change in response to a doubling of atmospheric CO2 concentrations, after the climate system has reached equilibrium. The issue with regards to ECS is not scenario discovery; rather, the challenge is to clarify the upper bounds of possible and plausible worst cases.

The IPCC assessments of ECS have focused on a ‘likely’ (> 66% probability) range, which has mostly been unchanged since Charney et al. (1979), to be between 1.5 and 4.5 oC. The IPCC AR4 (2007) did not provide any insight into a worst-case value of ECS, stating that values substantially higher than 4.5 oC cannot be excluded, with tail values in Figure 9.20 exceeding 10 oC. The IPCC AR5 (2013) more clearly defined the upper range, with a 10% probability of exceeding 6 oC.

Since the IPCC AR5, there has been considerable debate as to whether ECS is on the lower end of the likely range (e.g., < 3 oC) or the higher end of the likely range (for a summary, see Lewis and Curry, 2018). The analysis here bypasses that particular debate and focuses on the upper extreme values of ECS.

The Little Ice Age – Back to the Future

by Jim Steele, April 4, 2019 in WUWT


Extreme scientists and politicians warn we will suffer catastrophic climate change if the earth’s average temperature rises 2.7°F above the Little Ice Age average. They claim we are in a climate crisis because average temperature has already warmed by 1.5°F since 1850 AD. Guided by climate fear, politicians fund whacky engineering schemes to shade the earth with mirrors or aerosols to lower temperatures. But the cooler Little Ice Age endured a much more disastrous climate.

The Little Ice Age coincides with the pre-industrial period. The Little Ice Age spanned a period from 1300 AD to 1850 AD, but the exact timing varies. It was a time of great droughts, retreating tree lines, and agricultural failures leading to massive global famines and rampant epidemics. Meanwhile advancing glaciers demolished European villages and farms and extensive sea ice blocked harbors and prevented trade.

2019 Hurricane season forecast: below average

by Anthony Watts, April 4, 2019 in WUWT


Dr. Philip Klotzbach of Colorado State University writes on Twitter:

Seasonal #hurricane forecast from @ColoradoStateU predicts slightly below-average season: 13 named storms, 5 hurricanes & 2 major (Cat 3+, >=111 mph) hurricanes. Primary reason for slightly below-avg forecast is anticipated continuation of weak #ElNino.

We anticipate that the 2019 Atlantic basin hurricane season will have slightly belownormal activity. The current weak El Niño event appears likely to persist and perhaps even strengthen this summer/fall. Sea surface temperatures averaged across the tropical Atlantic are slightly below normal, and the far North Atlantic is anomalously cool.

Our Atlantic Multi-decadal Oscillation index is below its long-term average. We anticipate a slightly below-average probability for major hurricanes making landfall along the continental United States coastline and in the Caribbean. As is the case with all hurricane seasons, coastal residents are reminded that it only takes one hurricane making landfall to make it an active season for them. They should prepare the same for every season, regardless of how much activity is predicted.

PROBABILITIES FOR AT LEAST ONE MAJOR (CATEGORY 3-4-5) HURRICANE LANDFALL ON EACH OF THE FOLLOWING COASTAL AREAS:

1) Entire continental U.S. coastline – 48% (average for last century is 52%)

2) U.S. East Coast Including Peninsula Florida – 28% (average for last century is 31%)

3) Gulf Coast from the Florida Panhandle westward to Brownsville – 28% (average for last century is 30%)

PROBABILITY FOR AT LEAST ONE MAJOR (CATEGORY 3-4-5) HURRICANE TRACKING INTO THE CARIBBEAN

(10-20°N, 88-60°W) 1) 39% (average for last century is 42%)

U.S. Arctic Oil & Gas Exploration: A Sense of Urgency

by D. Middleton, April 3, 2019 in WUWT


I ran across a very lucid and informative article on Real Clear Energy today. The author is Robert Dillon, “a senior adviser on energy security at the American Council for Capital Formation and the former communications director of the Senate Energy and Natural Resources Committee.” The article includes numerous links to supporting information, particularly the National Petroleum Council’s (NPC) 2015 report on U.S. Arctic oil & gas resource potential.

The key findings of the 2015 NPC report were:

  1. Arctic oil and gas resources are large and can contribute significantly to meeting future U.S. and global energy needs.
  2. The arctic environment poses some different challenges relative to other oil and gas production areas, but is generally well understood.
  3. The oil and gas industry has a long history of successful operations in arctic conditions enabled by continuing technology and operational advances.
  4. Most of the U.S. Arctic offshore conventional oil and gas potential can be developed using existing field-proven technology.
  5. The economic viability of U.S. Arctic development is challenged by operating conditions and the need for updated regulations that reflect arctic conditions.
  6. Realizing the promise of Arctic oil and gas requires securing public confidence.
  7. There have been substantial recent technology and regulatory advancements to reduce the potential for and consequences of a spill.

Figure 1-1. Arctic exploration wells by country and time period. (NPC)

CBC Claims Canada Warming Twice As Fast As Globe, Yet Data Tell A Different Story: No Warming In 25 Years!

by P. Gosselin, April 3, 2019 in NoTricksZone


Canada’s CBC here recently cited “a leaked report” which claimed Canada is “warming at twice the global rate.”

According to the “leaked report”, Canada’s annual average temperature over land has warmed 1.7 C when looking at the data since 1948. But that claim is misleading when recent data is considered.

Over the past 25 years, since scientists began to warn that the planet was warming in earnest, there has not been any warming when one looks at the untampered data provided by the Japan meteorology Agency (JMA) that were measured by 9 different stations across Canada. These 9 stations have the data dating back to around 1983 or 1986, so I used their datasats.

Looking at the JMA database and plotting the stations with longer term recording, we have the following chart:

Another New Study Supports Early 21st Century Warming Hiatus Was Real

by P. Gosselin, April 2, 2019 in NoTricksZone


A number of scientists from the alarmist camp like to insist that there had never been such a hiatus. The latest paper contradicts that claim.

The new study states that many published analyses show that lightning activity is responsive to temperature on time scales ranging from the diurnal to the decadal and that the hiatus in global warming earlier this century can be seen in several global datasets.

Scientists found that the statistically flat behavior of the global lightning record from the NASA Lightning Imaging Sensor over the same decadal period is consistent with this hiatus in global warming.

What follows is the paper’s abstract:

Multiple records of global temperature contain periods of decadal length with flat or declining temperature trend, often termed a ‘hiatus’. Towards assessing the physical reality of two such periods (1940–1972 and 1998–2014), lightning data are examined. Lightning activity is of particular interest because on many different time scales it has been shown to be non-linearly dependent on temperature. During the earlier hiatus, declining trends in regional thunder days have been documented. During the more recent hiatus, lightning observations from the Lightning Imaging Sensor in space show no trend in flash rate. Surface-based, radiosonde-based and satellite-based estimates of global temperature have all been examined to support the veracity of the hiatus in global warming over the time interval of the satellite-based lightning record. Future measurements are needed to capture the total global lightning activity on a continuous basis.”

Sizzling March?

by P. Homewood, April 3, 2019 in NotaLotofPeopleKnowThat


According to CET, March 2019 was the 17th warmest on record since 1659, 1.2C higher than the 1981-2010 average.

Sound impressed? No, thought not!

The month as a whole actually seemed to be pretty unremarkable. There was some mild weather at the start of the month, accompanied by very wet weather. The last few days were also pleasant and sunny.

But unusually warm?

The graph at the top gives a bit of perspective.

First of all it is obvious that last month was pretty typical of Marchs during the last 30 years or so.

The fact that it is 1.2C above the 30-year average means little, as natural variability means some years are warmer and others cooler, such as last year. That’s what an average is.

Indeed, in the last 30 years, eleven had March anomalies of 1C or more. Six of these years were warmer than this March.

By far the warmest Marchs were in 1957 and 1938, again suggesting that there was nothing unusual about last month.


The other thing which stands out is that most Marchs used to be much colder than normal until the 1980s.

https://www.metoffice.gov.uk/hadobs/hadcet/cetmaxdly1878on_urbadj4.dat

see also here (WUWT)

State of the Climate 2018

by Prof. Ole Humlum, April 2 , 2019 in GWPF


That’s according to Norwegian Professor Ole Humlum whose annual review of the world’s climate is published today by the Global Warming Policy Foundation.
 
Last week, the WMO issued its own review of the climate, which insinuated that global warming was worsening. However, Professor Humlum points out that the data tells a very different story:
 
“Reading the WMO report, you would think that global warming was getting worse. But in fact it is carefully worded to give a false impression. The data are far more suggestive of an improvement than a deterioration.”
 
And the lack of anything to be alarmed about is clear across a range of measures, says Professor Humlum:
 
“After the warm year of 2016, temperatures last year continued to fall back to levels of the so-called warming “pause” of 2000-2015. There is no sign of any acceleration in global temperature, hurricanes or sea-level rise. These empirical observations show no sign of acceleration whatsoever.”


Professor Humlum’s key findings:
 

  • In 2018, the average global surface temperature continued a gradual descent towards the level characterising the years before the strong 2015–16 El Niño episode. 
  • Since 2004, when the Argo floats came into operation, the global oceans above 1900m depth have on average warmed somewhat. The maximum warming (between the surface and 120 m depth) mainly affects oceans near the equator, where the incoming solar radiation is at a maximum. In contrast, net cooling has been pronounced for the North Atlantic since 2004.
  • Data from tide gauges all over the world suggest an average global sea-level rise of 1– 1.5 mm/year, while the satellite record suggests a rise of about 3.2 mm/year. The large difference between the two data sets still has no broadly accepted explanation.
  • The Northern Hemisphere snow cover extent has undergone important local and regional variations from year to year. The overall global tendency since 1972, however, is for overall stable snow extent.
  • Tropical storm and hurricane accumulated cyclone energy (ACE) values since 1970 have displayed large variations from year to year, but no overall trend towards either lower or higher activity. The same applies for the number of hurricane landfalls in the continental United States, for which the record begins in 1851.

see also here

More Evidence for Rapid Coral Adaptation

by Jim Steele, April 2, 2019 in WUWT


Good news continues to accumulate regards corals’ ability to rapidly adjust to changing climates. The view of coral resilience has been dominated by the narrative of a few scientists. In the 1990s they advocated devastating consequences for coral reefs due to global warming, arguing coral cannot adapt quickly enough. Since the Little Ice Age ended, they believed rising ocean temperatures had brought coral closer to a “bleaching threshold”, a more or less fixed upper temperature limit above which corals cannot survive. Their model predicted the speed of recent global warming “spells catastrophe for tropical marine ecosystems everywhere”. Their assertions that “as much as 95% of the world’s coral may be in danger of being lost by mid-century” was guaranteed to capture headlines and instill public fear. However, a growing body of scientific research increasingly casts doubts on such alarming predictions. Unfortunately, that good news gets much less attention.

A recent peer-reviewed paper titled A Global Analysis of Coral Bleaching Over the Past Two Decades (Sully 2019) compared 20 years of ocean temperatures at which coral bleaching was initiated. From 1998 to 2006, the average sea surface temperature that initiated bleaching was 82.6 °F. But that temperature limit proves not to be “fixed” as earlier researchers incorrectly believed. From 2007 to 2017 the average temperature limit that initiated bleaching was higher, 83.7 °F. This indicates coral have been rapidly adapting to warmer regional climates much faster than once believed.

China-built nuclear reactors may enjoy home advantage as delays and costs stymie foreign competitors

by Bloomberg, April 2, 2019 in SouthChinaMorningPost


China’s home-grown nuclear technology is gaining favour in the battle for the nation’s next generation of reactors, according to a state-owned developer, as it sought to recover from delays and cost blowouts from imported designs.

China’s reactor, known as the Hualong One, will be faster and easier to repair and maintain than competing foreign designs because it will be made at home, according to Chen Hua, chief executive officer of China National Nuclear Power company (CNNP), which builds and operates nuclear power projects.

“We prefer the Hualong One,” Chen said on Monday at a nuclear energy conference in Beijing.

The global nuclear industry has been awaiting a revival in China after cost overruns and stricter regulation after the 2011 Fukushima disaster in Japan stalled the approval and construction of more units.