Archives de catégorie : climate-debate

Why is the CO₂ Concentration Rising?

by F. Schrijver, Apr 15, 2022 in WUWT


The general view in society is that human emissions of CO₂ are the all-determining cause of the increased concentration in the atmosphere. Most scientists and even many climate skeptics do not question this. There is some debate about how long this extra CO₂ will stay in the atmosphere, but that’s about it. That’s remarkable, as several scientists have published extensively on the flaws and inconsistencies of this narrative. By looking at the significant increase in the CO₂-flows from and to land and sea it’s in fact easy to see that the CO₂-rise is largely due to natural causes.

The idea that human CO₂ is the all-determining cause of the increased concentration is based on the assumption that the natural inflows and outflows are always and exactly in equilibrium with each other. Based on this perfect equilibrium thinking, human emissions, even though they are relatively small, cause a perturbation year after year. In the so-called global carbon budget[2] about 10 PgC of CO₂ is added every year, while the absorption flux has only increased by 6 PgC/yr (1 Petagram = 1 Gigaton = 1 billion tons). The concentration therefore continues to rise indefinitely as long as people emit CO₂.

To support this idea it is also assumed that human emissions accumulate in the atmosphere. Where you would expect a single residence time for a reservoir with in- and outflows, the IPCC-models calculate with a small residence time of about 4 years for natural CO₂ and a large one for human CO₂: “The removal of all the human-emitted CO2 from the atmosphere by natural processes will take a few hundred thousand years (high confidence)”.

Several scientists, including Murray Salby[9] and Hermann Harde[3], have published extensively on the flaws and inconsistencies of this narrative. They also showed that it is very illogical to think that a slight increase in the up-flux cannot be compensated by a larger down-flux. It’s like increasing the heat energy flow in a house by 5% and expecting that the temperature will keep on rising forever.

Despite this, belief in the IPCC’s model for the increase in concentration is persistent. In this article we will focus on one of the strangest assumptions: the idea that the in- and outflows are stable and in perfect equilibrium. Although they are about 20 times larger than anthropogenic fluxes and have different drivers for up and down, natural flows are not included in the material balance used in the models.

It is in fact easy to see that the increase in the CO₂ concentration is for the most part the result of natural changes, based on the following unmistakable observations.

  1. Fluxes to and from land and sea have increased significantly since 1750.

  2. The increase in these fluxes is natural, i.e. not due to human emissions.

  3. The growth of the natural fluxes can only take place at a higher concentration in the atmosphere.

AR6 Model Failure Affirmed: ‘No Model Group Succeeds Reproducing Observed Surface Warming Patterns’

by K. Richard, Apr 25, 2022 in NoTricksZone


A new study published in Geophysical Research Lettershighlights the abysmal model performance manifested in the latest Intergovernmental Panel on Climate Change report (AR6). The 38 CMIP6 general circulation models (GCMs) fail to adequately simulate even the most recent (1980-2021) warming patterns over 60 to 81% of the Earth’s surface.

Dr. Scafetta places particular emphasis on the poor performance of the highly uncertain estimates (somewhere between 1.83 and 5.67°C) of equilibrium climate sensitivity (ECS) and their data-model agreement relative to 1980-2021 global warming patterns.

The worst-performing ECS estimates are the ones projecting 3-4.5°C and 4.5-6°C warming in response to doubled CO2 concentrations (to 560 ppm) plus feedbacks, as the 1980-2021 temperature trends are nowhere close to aligning with these trajectories.

Instead, the projected global warming by 2050 (~2°C relative to 1750) associated with the lowest ECS estimates and implied by the warming observed over the last 40+ years is characterized as “unalarming” even with the most extreme greenhouse gas emissions (no mitigation efforts undertaken) growth rate.

In addition to the conclusion that “no model group succeeds reproducing observed surface warming patterns,” poor modeling of heat transfer physics, ocean and atmospheric circulation patterns, polar sea ice processes…is also evident in the latest IPCC report.

“Accurately reproducing regional temperature differences over the past 40+ years is beyond the capability of climate model simulations, and even fails for major ocean basins and continents.”

The fundamental modeling failures in simulating responses to sharply rising greenhouse gas emissions over the last 40+ years “calls into question model-based attribution of climate responses to anthropogenic forcing.”

Follow the Science: But Which Results? Using Same Tree Ring Dataset, 15 Groups Come Up With 15 Different Reconstructions

by P. Gosselin, Apr 19, 2022 in NoTricksZone


A 2021 study appearing in Nature Communications by Buentgen et al reports on the results of a double-blind experiment of 15 different groups that yielded 15 different Northern Hemisphere summer temperature reconstructions. Each group used the same network of regional tree-ring width datasets.

What’s fascinating is that ll groups, though using the same data network, came up with a different result. When it comes to deriving temperatures from tree-rings, it has much to do with individual approach and interpretation. Sure we can follow the science, but whose results?

The 15 groups (referred to as R1–R15) were challenged with the same task of developing the most reliable NH summer temperature reconstruction for the Common Era from nine high-elevation/high-latitude TRW datasets (Fig. 1):
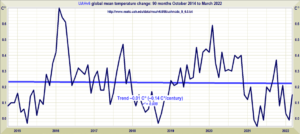
Cropped from Figure 1, Buentgen et al 

The State of the Climate 2021

by Ole Humlum,  April 2022 in GWPF


.pdf, GWPF Report 51, 54 pages

see also here and  here


Contents

About the author ii General overview 2021 2

  1. Air temperatures 4Surface: spatial pattern 4 Lower Troposphere: monthly 6 Lower Troposphere: annual means 7 Surface: monthly 8 Surface: annual means 10 Error, consistency and quality 11 Surface versus lower Troposphere 14Lower Troposphere: land versus ocean 15 By altitude 16 Zonal air temperatures 17 Polar air temperatures 18
  2. Atmospheric greenhouse gases 19Water vapour 19 Carbon dioxide 20
  3. Ocean temperatures 22Recent surface temperature anomalies 22 By latitude 24 By depth 25 By region and depth 27 Ocean temperature net change 2004–2020 in selected sectors 28
  4. Ocean oscillations 31Southern Oscillation Index 31 Pacific Decadal Oscillation 31 Atlantic Multidecadal Oscillation 31
  5. Sea-level 33In general 33 From satellite altimetry 34 From tide gauges 35 Modelled for the future 36
  6. Snow and ice 39Global, Arctic and Antarctic sea ice extent 39 Northern Hemisphere snow cover extent 41
  7. Storms and wind 43Accumulated cyclone energy 43 Other storm and wind observations 45
  8. Written references 46
  9. Links to data sources 46

Review process 50 About the Global Warming Policy Foundation 50

New Study: 90 Papers Were Published On The ‘Hiatus’ From 2009-2019. Now They Say It Never Happened.

by K. Richard, Apr 18, 2022 in NoTricksZone


The claimed warming rate during the (1998-2001 to 2012-’13) “hiatus” ranged from -0.07°C to +0.17°C per decade.

In late 2012, the IPCC had an ongoing dilemma about what to do about the uncooperative global temperatures. The HadCRUT3 data set government bureaucrats had been using since the first report in 1990 actually showed the global mean surface temperatures had been declining since 1998. This was not going further the we-must-act-on-global-warming-now narrative, of course.

Enter Phil Jones, the global temperature data set overseer at East Anglia’s Climate Research Unit (CRUTEM). He’s the scientist who famously admitted that when the temperature data doesn’t exist, they are “mostly made up.”


Jones’s CRU and the Met Office (Hadley) then jointly constructed the newer HadCRUT4 version to help advance the narrative. This version changed the data just in time for the 5th IPCC assessment (AR5, 2013). The 1998-2001 temperatures  were allowed to stay the same, but an additional 0.1 to 0.2°C was tacked on to anomalies from 2002 onwards. The effect was to transform the 1998-2012 slight cooling in HadCRUT3 into a 0.04°C per decade−1 warming in HadCRUT4.

Image Source: woodfortrees.org 


Climate Feedback Fact Checks CO2 Coalition

by A. May, Apr 17, 2022 in WUWT


The Climate Feedback website critiques my CO2Coalition article “Attributing global warming to humans.”Their factcheck is here. Like most “fact checks” these days it is a thinly disguised opinion piece. The statement that they claim is incorrect is:

“There is no evidence, other than models, that human CO2 emissions drive climate change and abundant evidence that the Sun, coupled with natural climate cycles, drives most, if not all, of recent climate changes, as described in Connolly, et al., 2021.” [emphasis added]

They cleverly leave out the last phrase: “as described in Connolly, et al., 2021,” and then immediately assert “Solar irradiance has had a negligible impact on Earth’s climate since the industrial era.” This is followed by no evidence other than an appeal to the mythical “consensus.”

Later in the article, they say Connolly, et al. uses simple linear regression to establish a link between solar irradiance and surface temperature. Connolly, et al. does not state that the Sun controls the climate or that humans do, it simply shows that, using available evidence, solar variability (actually TSI, or Total Solar Irradiance variability) could account for anywhere from 0 to 100% of the warming since the Little Ice Age (the so-called “pre-industrial” era). One of the main points of Connolly, et al. is that the IPCC and the so-called “consensus” are ignoring two critical areas of current research. First, they ignore the uncertainty in our estimate of surface warming since the Little Ice Age, and second, they ignore the considerable uncertainty in solar-variability-long-term trends, both recently and since the Little Ice Age. As they state in the paper, the amount of 20th century warming that can be simulated as due to solar variability, depends upon the surface temperature dataset and the solar TSI model used. There are many versions of both. Suffice it to say, while the exact influence of human activities and solar variability on climate change are both unknown, no one can claim solar influence is negligible. The correct answer is we don’t know.

Is the third La Niña on the way?

by Dr R. Maue, Apr 16, 2022 in NoTricksZone


It was supposed to be a groundbreaking forecast, the early prediction of the weather phenomena El Niño and La Niña. Both affect the weather in very different ways.

It would have been so nice to know a year in advance what conditions would prevail at a later date. On November 4, 2019, the Potsdam Institute for Climate Impact Research published what was held as groundbreaking news. Thanks to its new algorithms and a lot of computing power, it was now possible to predict an El Niño or a La Niña a long time in advance. The hit rate was supposed to be 80%.

Unfortunately, one year later exactly the opposite of what was predicted in fact happened, the German Klimaschau reported. Science is settled? Well, maybe not.

Since then, things have been quiet about these PIK long-term forecasts. The US agency NOAA is much more cautious, both in terms of the long term and the probability of occurrence. Perhaps they don’t have as good algorithms and the computing power that Potsdam has? In any case on Twitter, US meteorologist Ryan Maue sees a good chance that a third will follow the two recent consecutive La Niñas.

The last time this happened was 22 years ago at the turn of the millennium.


Can Computer Models Predict Climate?

by Dr C. Essex, Apr 13,  2022 in BigPicturesNews


Guest post by Christopher Essex, Emeritus Professor of Mathematics and Physics, University of Western Ontario.

Christopher Essex

By Dr Christopher Essex

It is well known that daytime winter temperatures on Earth can fall well below -4°F (-20℃ ) in some places, even in midlatitudes, despite warming worries. Sometimes the surface can even drop below -40°F (-40℃ ), which is comparable to the surface of Mars. What is not so well known is that such cold winter days are colder than they would be with no atmosphere at all!

How can that be if the atmosphere is like a blanket, according to the standard greenhouse analogy? If the greenhouse analogy fails, what is climate?

Climate computer models in the 1960s could not account for this non-greenhouse-like picture. However modern computer models are better than those old models, but the climate implications of an atmosphere that cools as well as warms has not been embraced. Will computer models be able to predict climate after it is? The meteorological program for climate has been underway for more than 40 years. How did it do?

Feynman, Experiment and Climate Models
“Model” is used in a peculiar manner in the climate field. In other fields, models are usually formulated so that they can be found false in the face of evidence. From fundamental physics (the Standard Model) to star formation, a model is meant to be put to the test, no matter how meritorious.

Sea ice average for March is the metric used to compare to previous winters

by S. Crockford, Apr 5, 2022 in PolarBearScience


The average sea ice cover at the end of March is the metric used to compare ‘winter’ ice to previous years or decades, not the single-day date of ‘most’ ice. This year, March ended with 14.6 mkm2 of sea ice, most of which (but not all) is critical polar bear habitat. Ice charts showing this are below.

But note that ice over Hudson Bay, which is an almost-enclosed sea used by thousands of polar bears at this time of year, tends to continue to thicken from March into May: these two charts for 2020 show medium green becoming dark green, indicating ice >1.2 m thick, even as some areas of open water appear.

Climate-Change ‘Solutions’ That Are Worse Than The Problem

by J. Trennert, Apr 8, 2022 in ClimateChangeDispatch


If you can afford a Tesla, you probably find it hard to imagine that there are some 3.5 billion people on Earth who have no reasonably reliable access to electricity.

Even less obvious may be the way rich countries’ pursuit of carbon neutrality at almost any cost limits economic opportunities for the world’s poor and poses serious geopolitical risks to the West. [bold, links added]

Anyone on an investment committee has likely spent untold amounts of time discussing ways to mitigate the impact of climate change, but they’ve likely never heard anyone state one simple and incontrovertible fact: The widespread exploration and production of fossil fuels that started in Titusville, Pa., not quite 170 years ago has done more to benefit the lives of ordinary people than any other technological advance in history.

Before fossil fuels, people relied on burning biomass, such as timber or manure, which was a far dirtier and much less efficient source of energy.

Fossil fuels let people heat their homes in the winter, reducing the risk of death from exposure. Fossil-fuel-based fertilizers greatly increased crop yields, reducing starvation and malnutrition.

Before the advent of the automobile, the ability for many people to venture far from their hometown was an unfathomable dream.

Oil- and coal-burning transportation opened up access to education, commerce, professional opportunities, and vital services such as medicine.

There has been, and remains, a strong correlation between the use of fossil fuels and life expectancy.

How is the invasion of Ukraine related to carbon dioxide?

by D. Nerbert, Apr 2, 2022 in CO2Coalition


America’s Executive and Legislative Branches are full of ignorant politicians who need help from a 5th-grader. By the 5th grade, students have already learned that all animals and fungi consume oxygen (O2) and release carbon dioxide (CO2);conversely, all plants consume CO2 and expel O2. This is the Circle of Life; without it, our planet would be only a rock in this solar system.

 In 2019 and 2020, America became energy-independent — for the first time since the mid-1950s. This meant greater amounts of crude oil and petroleum products were exported than imported. Our economy was growing beautifully, and unemployment rates were the lowest in more than 50 years. On 20 January 2021, this was abruptly reversed with the stroke of Biden’s pen (executive order 13807 revoked, plus EO13990, EO14008 and EO14030) — which incomprehensibly made America energy-dependent once again, and has also caused this unwanted inflation.

 Biden’s “climate plan” includes goals to transition from fossil fuels to “clean energy,” cut emissions from electric power to zero by 2035, and reach “net-zero CO2 emissions” by 2050. However, “clean energy” (solar and wind) is unreliable and does not even provide 10% of America’s energy needs. Biden’s entire house-of-cards is based on becoming “carbon-neutral” — because CO2 is viewed as “the cause of global warming,” which is claimed to be the “greatest existential threat to mankind.”

 How silly is this? CO2 — along with O2, nitrogen (N2) and water vapor (H2O) — is necessary for all Life on Earth. Geological studies indicate that CO2 levels have been as high as ~10,000-15,000 parts-per-million (ppm). This was during the Cambrian Period (~541 to 485 million years ago), long before mammals existed; at that time, plant life flourished.

 Ice-core data (during the past 800,000 years) have shown cycles of CO2 ranging between ~150-180 ppm during Glacial Periods, and ~280-310 ppm during Inter-Glacial Periods. Earth ascended from its last Glacial Period ~11,500 years ago.

 Warming and cooling oceans are the likely reason for these CO2 oscillations. Atmospheric CO2 has risen from ~280 ppm in 1850 (end of the Little Ice Age) to ~410 ppm today. Thus, current levels of ~410 ppm (i.e., 100 ppm more than 310 ppm) most likely reflect the burning of fossil fuels. However, rising CO2 levels in this last century have substantially improved crop growth.

The new Pause lengthens: now 7 years 6 months

by C. Monckton of Brenchley, Apr 3, 2022, in WUWT


The new Pause has lengthened by another month. On the UAH satellite monthly global mean lower-troposphere temperature dataset, seven and a half years have passed since there was any trend in global warming at all. As always, if anyone has seen this surely not uninteresting fact mentioned in the Marxstream news media, let us know in comments. One of the best-kept secrets in what passes for “journalism” these days is that global temperature has not been rising steadily (or, since October 2014, at all). It has been rising in occasional spurts in response to natural events such as the great Pacific shift of 1976 and the subsequent strong el Niño events, rather than at the somewhat steadier rate that one might expect if our continuing – and continuous – sins of emission were the primary culprit.


UAH Global Temperature Update for March, 2022: +0.15 deg. C

by Dr R. Spencer, Apr 4, 2022 in WUWT


The Version 6.0 global average lower tropospheric temperature (LT) anomaly for March, 2022 was +0.15 deg. C, up from the February, 2022 value of -0.01 deg. C.

The linear warming trend since January, 1979 still stands at +0.13 C/decade (+0.12 C/decade over the global-averaged oceans, and +0.18 C/decade over global-averaged land).

Various regional LT departures from the 30-year (1991-2020) average for the last 15 months are:

YEAR MO GLOBE NHEM. SHEM. TROPIC USA48 ARCTIC AUST 
2021 01  0.12  0.34 -0.09 -0.08  0.36  0.49 -0.52
2021 02  0.20  0.32  0.08 -0.14 -0.66  0.07 -0.27
2021 03 -0.01  0.12 -0.14 -0.29  0.59 -0.78 -0.79
2021 04 -0.05  0.05 -0.15 -0.29 -0.02  0.02  0.29
2021 05  0.08  0.14  0.03  0.06 -0.41 -0.04  0.02
2021 06 -0.01  0.30 -0.32 -0.14  1.44  0.63 -0.76
2021 07  0.20  0.33  0.07  0.13  0.58  0.43  0.80
2021 08  0.17  0.26  0.08  0.07  0.32  0.83 -0.02
2021 09  0.25  0.18  0.33  0.09  0.67  0.02  0.37
2021 10  0.37  0.46  0.27  0.33  0.84  0.63  0.06
2021 11  0.08  0.11  0.06  0.14  0.50 -0.43 -0.29
2021 12  0.21  0.27  0.15  0.03  1.62  0.01 -0.06
2022 01  0.03  0.06  0.00 -0.24 -0.13  0.68  0.09
2022 02 -0.01  0.01 -0.02 -0.24 -0.05 -0.31 -0.50
2022 03  0.15  0.27  0.02 -0.08  0.21  0.74  0.02

The full UAH Global Temperature Report, along with the LT global gridpoint anomaly image for March, 2022 should be available within the next several days here.


Claims on the Antarctic Ice Breakup Suffer from Limited History

by A. Watts, Mar 30, 2022 in ClimateRealism


The media was full of disaster headlines this week over an observed breakup of a minor and little-known Antarctic ice shelf. Yahoo News and the New York Times, among others, lamented the “unprecedented” event. The problem is, we don’t really have any knowledge of previous events, making the present day claims false by omission.


During that period the Antarctic sea ice will in fact refreeze just like it does every year. You can be almost certain that if the Glenzer-Conger ice shelf forms again from the fragments and new ice, we won’t see MSM headlines about it because it goes against the “climate change” narrative.

A new volcanic province: an inventory of subglacial volcanoes in West Antarctica

by M. van Wyk et al., May 29, 2017 in LyellSpecPublications


(a) Location of the main components of the West Antarctic Rift System and confirmed volcanoes (red circles: after LeMasurier et al. 1990; Smellie & Edwards 2016). (b) Location of Holocene volcanoes (red circles) in the Ethiopia/Kenya branch of the East African Rift (red shaded area). The majority of this activity is aligned along the rift axis with occasional flank volcanism. Data from Siebert & Simkin (2002) and Global Volcanism Program (2013).

 Abstract

The West Antarctic Ice Sheet overlies the West Antarctic Rift System about which, due to the comprehensive ice cover, we have only limited and sporadic knowledge of volcanic activity and its extent. Improving our understanding of subglacial volcanic activity across the province is important both for helping to constrain how volcanism and rifting may have influenced ice-sheet growth and decay over previous glacial cycles, and in light of concerns over whether enhanced geothermal heat fluxes and subglacial melting may contribute to instability of the West Antarctic Ice Sheet. Here, we use ice-sheet bed-elevation data to locate individual conical edifices protruding upwards into the ice across West Antarctica, and we propose that these edifices represent subglacial volcanoes. We used aeromagnetic, aerogravity, satellite imagery and databases of confirmed volcanoes to support this interpretation. The overall result presented here constitutes a first inventory of West Antarctica’s subglacial volcanism. We identified 138 volcanoes, 91 of which have not previously been identified, and which are widely distributed throughout the deep basins of West Antarctica, but are especially concentrated and orientated along the >3000 km central axis of the West Antarctic Rift System.

Climate Past Far From Settled: 7 Major Temperature Reconstructions Find No Agreement

by P. Gosselin, Mar 29, 2022 in WUWT    


new paper published in open access publishing MDPI looks at seven prominent hemispheric and global temperature reconstructions for the past 2000 years (T2k).

The analysis conducted by the authors found that some reconstructions “differed from each other in some segments by more than 0.5 °C” whilst some show negligible pre-industrial climate variability (“hockey sticks”).

Those showing variability would suggest natural factors playing a greater role than those that claim climate had been rather constant over the past 2000 years.

Abstract: Global mean annual temperature has increased by more than 1 °C during the past 150 years, as documented by thermometer measurements. Such observational data are, unfortunately, not available for the pre-industrial period of the Common Era (CE), for which the climate development is reconstructed using various types of palaeoclimatological proxies. In this analysis, we compared seven prominent hemispheric and global temperature reconstructions for the past 2000 years (T2k) which differed from each other in some segments by more than 0.5 °C. Whilst some T2k show negligible pre-industrial climate variability (“hockey sticks”), others suggest significant temperature fluctuations. We discuss possible sources of error and highlight three criteria that need to be considered to increase the quality and stability of future T2k reconstructions. Temperature proxy series are to be thoroughly validated with regards to (1) reproducibility, (2) seasonal stability, and (3) areal representativeness. The T2k represents key calibration data for climate models. The models need to first reproduce the reconstructed pre-industrial climate history before being validated and cleared for climate projections of the future. Precise attribution of modern warming to anthropogenic and natural causes will not be possible until T2k composites stabilize and are truly representative for a well-defined region and season. The discrepancies between the different T2k reconstructions directly translate into a major challenge with regards to the political interpretation of the climate change risk profile. As a rule of thumb, the larger/smaller the pre-industrial temperature changes, the higher/lower the natural contribution to the current warm period (CWP) will likely be, thus, reducing/increasing the CO2 climate sensitivity and the expected warming until 2100.

Fossil Fuels v Renewable Energy

by P. Homewood, Mar 31, 2022 in NotaLotofPeopleKnowThat


solutions and products automatically come to the fore, without the need for subsidies, regulations and mandates.

If renewable energy is all that is promised, it will do the same.

There is of course no doubt that the cheap, abundant and reliable energy provided by fossil fuels has transformed society and made all of us better off than ever before in so many ways.

We get rid of them at our peril!

So far, our transition to renewable energy in the UK has been painfully slow and extremely expensive. Wind and solar power still supply only 3% of the UK’s total energy consumption after two decades of trying. Meanwhile, according to the Office for Budget Responsibility, subsidies for renewables were expected to cost £12 billion in 2021/22. This actually understates the reality because it does not include all of the indirect costs involved in grid balancing and so on, meaning the true cost is probably over £15 billion.

It is of course true that the recent rocketing of gas prices has reset the agenda. But it is important to note that the current price does not reflect the cost of extracting gas. It is the result of an imbalance in supply and demand. Such imbalances have occurred before, and a normally functioning market would quickly increase gas production, driving prices back down to historic levels.

But even before those price rises, it was being claimed that wind and solar power were cheaper than fossil fuel. However such claims fail to take into account the additional system costs imposed by their intermittency.

Moreover, claims that offshore wind costs are now down to around £40/MWh simply are not supported by the evidence. The claims are derived from the prices agreed for Contracts for Difference, the government subsidy mechanism. However, wind farms are under no legal obligation to actually take up these contracts; they are effectively only options.

34 Years of Flawed, Failed & Grossly Misrepresented Global Sea Level Rise Speculation

by L. Hamlin, Mar 30, 2022 in WUWT


For decades climate alarmists in the UK, EU and U.S. have been making flawed and failed exaggerated claims regarding accelerating global level sea level rise being caused by increasing man made CO2 emissions as one means of politically bullying the world’s nations into mandating immensely costly, bureaucratically onerous and completely ineffective global CO2 reductions from these nations.

The flawed CO2 reduction schemes in the EU and UK have created significant declines in energy availability and reliability because of these nations excessive reliance on unreliable, nondispatchable, backup power reliant and costly renewable energy. These politically contrived emissions and energy incompetent policies have resulted in greatly increasing energy costs for EU and UK nations that negatively impacted their economies while significantly increasing their dependence on energy from other nations.

This energy dependence includes greatly increased needs for natural gas, petroleum and coal supplies obtained through other nations and especially from Russia which (before sanctions) provided about 40% of the EU’s natural gas energy as well as being the EUs main supplier of crude oil (27%) and hard coal (49%). This data and other information concerning the EU and UK self-inflicted climate alarmist driven energy and economic debacle is addressed herehere and here.

The EUs efforts to build additional liquified natural gas terminals to wean itself off Russian gas is estimated to take at least three years with existing available import shipping facilities already maxed out. Renewables would take even longer. Any new LNG cargoes will have higher costs than the existing Russian pipelines. EU policy makers are stuck with politically damaging options including rationing energy and using more coal which means dumping climate goals. When push comes to shove emission reductions will take second place to economic survival with this huge energy and emissions policy turnaround already underway and being led by Germany.

A Brief Summary Of How ‘Global Warming’ Science Has Changed Since 1998

by K. Richard, Mar 31, 2022 in NoTricksZone


Two weeks before Dr. Michael E. Mann and colleagues published their 23 April 1998 “hockey stick” chart in Nature, a peer-reviewed journal published a paper asserting “an overwhelming majority of climate scientists” (50 out of 60) view catastrophic human-caused global warming – and even global warming itself – as an “unsupported assumption”.

At the time, satellite data indicated the lower troposphere had cooled by 0.13°C between 1979 and 1994. The Arctic had cooled by -0.88°C since the 1940s.

It was thought the IPCC had just (1995) perpetrated a “disturbing corruption of the peer-review process” in manipulating the conclusions of scientists to support favored government policies.

AR6 and Sea Level Rise, Part 1

by Andy May, Mar 19, 2022 in WUWT


This is the first of a three-part series on the IPCC’s discussion of sea level rise in their latest report, AR6 (IPCC, 2021). The report claims that the rate of sea level rise is accelerating. It is fair to ask why they think this, what evidence do they offer?

We find the following in the AR6 Summary for Policymakers:

“Global mean sea level increased by 0.20 [0.15 to 0.25] m between 1901 and 2018. The average rate of sea level rise was 1.3 [0.6 to 2.1] mm yr–1 between 1901 and 1971, increasing to 1.9 [0.8 to 2.9] mm yr–1 between 1971 and 2006, and further increasing to 3.7 [3.2 to 4.2] mm yr–1 between 2006 and 2018 (high confidence). Human influence was very likely the main driver of these increases since at least 1971.” [Bold added]

AR6 Summary for Policymakers, page SPM-6 (IPCC, 2021)

New Study: The CO2-Drives-Global-Warming ‘Concept’ Is ‘Obsolete And Incorrect’

by Lightfoot & Ratzer,  Mar 14, 2022 in NoTricksZone/JBasicApplSci


In analyzing UAH global temperature and Mauna Loa CO2 records from 1979 to 2021, climate researchers Lightfoot and Ratzer (2022) report there has been “little, if any” correlation between these two variables during this period.

They assert that between 91 and 98% of Earth’s greenhouse gas effect is from water vapor, as CO2 and other trace gases contribute less than 5% to greenhouse gas forcing.

A solar minimum has just began in the current solar cycle 25. The declining solar output is projected to eventually lead to a ~1 to 1.2°C cooling over the next 30 to 40 years. Solar minimum periods are also accompanied by crop failures due to frost and weather extremes delivering excessive heat.

The authors conclude by suggesting the popularized conceptualization of CO2 as a driver of global warming has proven to be “obsolete and incorrect”.

Al Gore’s 2009 Warning on Vanishing Polar Ice and the Perils of Censoring ‘Misinformation’

by J. Miltimore, Mar 17, 2022 in FEEStories


While speaking at a climate change summit in Denmark in 2009, former Vice President Al Gore made an alarming statement.

Citing research from Dr. Wieslaw Maslowski, a professor of oceanography at the Naval Postgraduate School in California, Mr. Gore said it was likely that the north polar ice caps would soon be completely melted.

“These figures are fresh,” Mr. Gore said. “Some of the models suggest to Dr. Maslowski that there is a 75 percent chance that the entire north polar ice cap, during the summer months, could be completely ice-free within five to seven years.”

New Analysis Of Greenland’s GISP2 Temperatures Expose Selection Bias In Paleo Reconstructions

by K. Richard, Mar 17, 2022 in NoTricksZone


Scientists admit that 3 different Greenland Summit (GISP2) temperature reconstruction “strategies” produce 3 different paleoclimate temperature results. The reconstructions chosen as the most “robust” are therefore the ones that align best with the authors’ presuppositions.

In a new study published in Quaternary Science Reviews scientists (Döring and Luenberger, 2022) report they reject a reconstruction of Greenland Summit temperatures that shows it has cooled ~4°C since Roman times (shown below as the red trend line, extended to 2000 C.E.).

Northern and Southern Hemisphere Warming

by A. May, Mar 18, 2022 in WUWT


As shown in Figure 1, the Hadley Climatic Research Unit HadCRUT5 temperature dataset suggests the Northern Hemisphere warmed 0.74°C (1.3° F) more than the Southern Hemisphere from 1979 through 2021. The UAH satellite temperature lower troposphere record is directionally similar but the difference between the hemispheres is much less, as shown in Figure 2. Both figures have identical vertical scales of 1.4°C. The UAH global satellite warming difference, from 1979 to 2021, between the hemispheres is about 0.2°C (0.4° F), less by more than a factor of 3.

Conclusions

The UAH and HadCRUT5 records both show the Northern Hemisphere warming more rapidly than the Southern, but the amount of extra warming in the HadCRUT5 record is anomalous. While the Southern Hemisphere satellite and surface rates are similar, the Northern Hemisphere rates are very different.

The global UAH lower troposphere and HadSST4 warming rates are both 0.14°C/decade from 1979 to 2020, the same to two decimals, as shown in my previous post. The oceans cover 70% of Earth’s surface and the HadSST4 dataset is used in combination with the CRUTEM5 land-surface temperature record to produce the curves in Figure 1. Given this, the large difference in Northern Hemisphere warming rates between Figures 1 and 2 is very hard to explain. Frankly, it suggests there is a problem with CRUTEM5. Figure 3 suggests the problem is getting worse in recent years, not better. This topic is discussed in more detail in my latest book: The Great Climate Change Debate: Karoly v Happer.

Ancient El Niños reveal limits to future climate projections

by University of Texas at Austin, Mar 15, 2022 in ScienceDaily


The climate pattern El Niño varies over time to such a degree that scientists will have difficulty detecting signs that it is getting stronger with global warming.

That’s the conclusion of a study led by scientists at The University of Texas at Austin that analyzed 9,000 years of Earth’s history. The scientists drew on climate data contained within ancient corals and used one of the world’s most powerful supercomputers to conduct their research.

The study of the past, which was recently published in Science Advances, was motivated by the need to get a clearer picture of how climate change may affect El Niño in the future.

El Niño is the warm phase of the El Niño Southern Oscillation, a climate phenomenon that sets the stage every few years for weather patterns worldwide. Strong El Niño events, such as the ones in 1997 and 2015 that brought wildfires to the rainforests of Borneo in Asia and caused widespread bleaching to the world’s coral reefs, happened about once a decade.

Computer models, however, are unclear about whether El Niño events will become weaker or stronger as the world warms due to climate change.