by Ron Clutz, September 17, 2018 in ScienceMatters
One week ago on day 252 MASIE reported the lowest daily extent of the year at 4.43M km2. One week later the image above shows how the ice edges have refrozen and extended. Note also the significant snowfall both in Canada and Russia
by J.C. Maurin, 16 septembre 2018, in Science,Climate,Energie
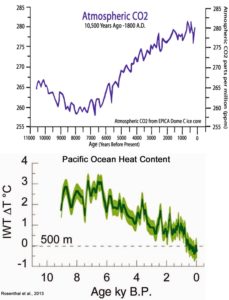
Dans les années 80, la découverte dans les archives glaciaires d’une corrélation entre température et taux de CO2 permit de soupçonner une influence anthropique sur le climat: les taux mesurés depuis 1958 étaient supérieurs aux taux des archives glaciaires.
L’IPPC (GIEC) fut créé en 1988 par 2 organismes: United Nations Environment Programme (UNEP) et World Meteorological Organization (WMO). Le GIEC attribue l’intégralité de la hausse du taux de CO2 depuis un siècle à l’influence humaine. Pour les dernières décennies, nous examinerons ici les mesures disponibles, les corrélations CO2 / température, enfin le modèle anthropique GIEC sera confronté à un modèle concurrent.
Even before Hurricane Florence made landfall somewhere near the border of North and South Carolina, predicted damage from potentially catastrophic flooding from the storm was already being blamed on global warming.
Writing for NBC News, Kristina Dahl contended, “With each new storm, we are forced to question whether this is our new, climate change-fueled reality, and to ask ourselves what we can do to minimize the toll from supercharged storms.”
The theory is that tropical cyclones have slowed down in their speed by about 10 percent over the past 70 years due to a retreat of the jet stream farther north, depriving storms of steering currents and making them stall and keep raining in one location. This is what happened with Hurricane Harvey in Houston last year.
But like most claims regarding global warming, the real effect is small, probably temporary, and most likely due to natural weather patterns …
There is no doubt that there is merit in the widely accepted Milankovitch theory that Ice Ages and their terminations are controlled by solar input to the NH in mid-summer. It is also clear that relying on the solar input to the NH alone, does not adequately account for the occurrence of terminations of Ice Ages. The variation of solar input to high latitudes is modulated by precession, which produces continual up-lobes and down-lobes in solar input with a ~ 22,000-year period. While every termination is accompanied by the 5,500-year rising portion of an up-lobe in the solar input to high latitudes, many strong up-lobes do not produce a termination….
The end of the Little Ice Age in the European Alps has long been a paradox to glaciology and climatology. Glaciers in the Alps began to retreat abruptly in the mid-19th century, but reconstructions of temperature and precipitation indicate that glaciers should have instead advanced into the 20th century. We observe that industrial black carbon in snow began to increase markedly in the mid-19th century and show with simulations that the associated increases in absorbed sunlight by black carbon in snow and snowmelt were of sufficient magnitude to cause this scale of glacier retreat. This hypothesis offers a physically based explanation for the glacier retreat that maintains consistency with the temperature and precipitation reconstructions.
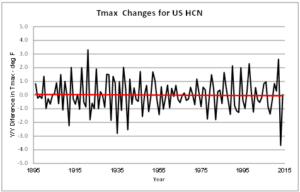
Given the impending global warming crisis declared by scientists, it should be easy to unambiguously demonstrate the crisis from the instrumental record. Unfortunately, when looking at the high temperature record for the US, it does not show any warming.
Figure 1 illustrates the incremental changes in surface air temperatures based on year to year differences in station average Tmax. The data is from all active stations in the US Historical Climatology Network (USHCN) from 1895 to 2014.
The classic heat equation defines changes in heat content as being proportional to changes in temperature (ΔQ = ƒ{ΔT} ).
Thus, Figure 1 amounts to a depiction of incremental changes in heat content, without scaling in energy units. The overall net temperature change is 0, which means the net change in heat content is also zero (ΔQ = ƒ{ΔT} = ƒ{0} = 0).
Figure 1 Year to Year Heat Changes (ΔT) for the USHCN
Black carbon refers to tiny carbon particles that form during incomplete combustion of carbon-based fuels. Black carbon particles absorb sunlight, so they are considered to contribute to global warming. However, the contribution of black carbon to the heating of the Earth’s atmosphere is currently uncertain. Models that can accurately assess the warming effect of black carbon on our atmosphere are needed so that we can understand the contribution of these tiny carbon particles to climate change. The mixing state of black carbon particles and their particle size strongly influence their ability to absorb sunlight, but current models have large uncertainties associated with both particle size and mixing state.
WUWT readers may recall that climate activists wanted the current epoch we live in to be named the “Anthropocene”, because they believe humans are the dominate force on the planet. The official organization that decides such things, The International Commission on Stratigraphy, would have none of it, and nixed the naming recently. Now, here’s a summary of the the Meghalayan.
Welcome to the new Meghalayan age – here’s how it fits with the rest of Earth’s geologic history
Steve Petsch
Associate Professor of Geosciences, University of Massachusetts Amherst
Jurassic, Pleistocene, Precambrian. The named times in Earth’s history might inspire mental images of dinosaurs, trilobites or other enigmatic animals unlike anything in our modern world.
Global tree canopy cover increased by 2.24 million square kilometers (865,000 square miles) between 1982 and 2016, reports a new study in Nature.
Researchers using satellite data tracked the changes in various land covers to find that gains in forest area in the temperate, subtropical, and boreal climatic zones are offsetting declines in the tropics. In addition, forest area is expanding even as areas of bare ground and short vegetation are shrinking. Furthermore, forests in montane regions are expanding as climate warming enables trees to grow higher up on mountain.
The question is how does the Intergovernmental Panel on Climate Change (IPCC) determine that an increase in atmospheric CO2 causes an increase in global temperature? The answer is they assumed it was the case and confirmed it by increasing CO2 levels in their computer climate models and the temperature went up. Science must overlook the fact that they wrote the computer code that told the computer to increase temperature with a CO2 increase. Science must ask if that sequence is confirmed by empirical evidence? Some scientists did that and found the empirical evidence showed it was not true. Why isn’t this central to all debate about anthropogenic global warming?
Even though CO2 concentrations hovered well below 300 ppm throughout most of the Holocene, newly published paleoclimate reconstructions affirm that today’s surface temperatures are only slightly warmer (if at all) than the coldest periods of the last 10,000 years. This contradicts the perspective that temperatures rise in concert with CO2 concentrations.
Lets all bow to the IPCC — a modern God that shalt not be questioned. The Holy Sacred Climate Cow!
The IPCC is an unaudited and unaccountable foreign committee. Not only are no scientists paid to check its findings, now the publicly mandated BBC is making sure none of their journalists will check its findings either.
In April, the UK regulator, Ofcom, found the BBC was guilty of not sufficiently challenging Lord Lawson, a skeptic. So in response the BBC now promises they will never sufficiently challenge the IPCC. That’s “false balance” for you.
by Ben Webster, September !, 2018 in TheSundayTimes
The BBC has told staff they no longer need to invite climate-change deniers on to its programmes, suggesting that allowing them to speak was like letting someone deny last week’s football scores.
It has also asked all editorial staff to take a course on how to report on climate change and said that its coverage of the topic “is wrong too often”.
Guest CNN-bashing by David Middleton (a geologist)
…
ran across this April 2018 article while looking for something else. I totally missed this episode of Trump Derangement Syndrome.
Secretary Zinke’s stance on climate change is one of several reasons the Climatariat News Network decided that he was being dishonest in describing himself as a geologist…
by P. Homewood, September 7, 2018 in NotaLotofPeopleKnowThat
Carbon Brief has obtained the internal four-page “crib sheet” sent yesterday to BBC journalists via an email from Fran Unsworth, the BBC’s director of news and current affairs. The crib sheet includes the BBC’s “editorial policy” and “position” on climate change.
All of the BBC’s editorial staff have also been invited to sign up for a one-hour “training course on reporting climate change”. Carbon Brief understands this is the first time that the BBC has issued formal reporting guidance to its staff on this topic.
From the University of Bristol and the “models before measurements” department comes this highly speculative claim that is entirely based entirely on climate models. There’s no actual measured data from any sort of paleo research. It’s science, but not as we know it.
A new study by scientists at the University of Bristol has shown that ancient global warming was associated with intense rainfall events that had a profound impact on the land and coastal seas.
The Palaeocene-Eocene Thermal Maximum (PETM), which occurred about 56 Million years ago, is of great interest to climate scientists because it represents a relatively rapid global warming event, with some similarities to the human-induced warming of today.
Although there have been many investigations of how much the Earth warmed at the PETM, there have been relatively few studies of how that changed the hydrological cycle.
by P. Homewood, September 5, 2018 in NotaLotofPeopleKnowThat
This article in something called Inside Climate News seems to be typical of many I have seen this year: Because we have had much attention in the media on heat waves this year, there must be an upward trend in heat waves and that is a warning signal that man-made global warming is destroying the planet. Typical of these articles are a couple of features
Declaration of a trend without any actual trend data, but just a single data point of events this year
Unstated implication that there must be a trend because the author can’t remember another year when heat wave stories were so prevalent in the media
Unproven link to man-made global warming, because I guess both involve warmth.
by P. Homewood, September 6, 2018 in NotaLotofPeopleKnowThat
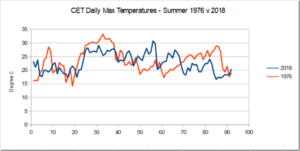
A lot of people have said they remember the summer of 1976 being hotter than this year. And they would be right.
According to CET data, at their peak temperatures went much higher and for longer than they did this summer. The only factor that kept the two summer remotely close was that in 1976 temperatures fell away during the middle of July to below average for a while.
These ‘Conferences of the Parties’, or COPs as they are usually termed, involve all of the members of the United Nations Framework Convention on Climate Change and take place towards the end of the year. This year will see the 24th COP take place in Katowice, Poland.
Over the years the COPs have developed a style all of their own. Indeed, some observers have even gone as far as to suggest that each year sees less and less by way of meaningful activity, and more and more liturgy and ritual.
In Part A of the Great Debate series (see here) we discussed Dr. David Karoly’s and Dr. William Happer’s arguments regarding how unusual recent global warming is and how we know the recent observed increase in CO2 is due to human activities. In Part B we examined their thoughts on the amount of warming caused by greenhouse gas emissions and the accuracy of the calculation. In Part C we discussed the dangers of global warming, the calculation of the vital value of ECS (the equilibrium climate sensitivity to a doubling of CO2), and discuss the need to do something about climate change. In this final part of the series I will summarize the debate and provide my thoughts.
In Part A of the Great Debate series (see here) we discussed Dr. David Karoly’s and Dr. William Happer’s arguments regarding how unusual recent global warming is and how we know the recent observed increase in CO2 is due to human activities. In Part B we examined their thoughts on questions three and four. Number 3 is “How do we know that the increase in CO2 and other greenhouse gases in the atmosphere have caused most of the recent global warming?” Number 4 is “Climate models have been used to compute the amount of warming caused by human activities, how accurate are they?”
For an introduction to the debate and links to the original documents see Part A. In Part C we will examine the predictions that global warming and more CO2 are dangerous and that we (as a global society) need to do something about it.
In Part A of the Great Debate series (see here) we discussed Dr. David Karoly’s and Dr. William Happer’s arguments regarding how unusual the recent global warming is and how we know the recent observed increase in CO2 is due to human activities. In Part B we will examine their thoughts on questions three and four.
3. How do we know that the increase in CO2 and other greenhouse gases in the atmosphere have caused most of the recent global warming?
4. Climate models have been used to compute the amount of warming caused by human activities, how accurate are they?
For an introduction to the debate and links to the original documents see Part A.
…
La géologie, une science plus que passionnante … et diverse