by Cap Allon, oct 5, 2020 in Electroverse
Much of the below analysis is courtesy of Kenneth Richard.
The combined Hadley Centre and Climatic Research Unit (HadCRUT) data set –which is featured in IPCC reports– underwent a revision from version 3 to version 4 in March of 2012, about a year before the next IPCC report was due.
At the time (early 2012), the HadCRUT3 was showing a slight global cooling trend between 1998 and 2012, visible in the graph below which uses HadCRUT3 and HadCRUT4 raw data. In conjunction with changing versions, the slight cooling trend had convenientlychanged to a slight warming trend:
…
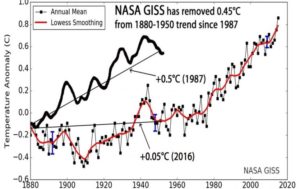
As recently as 1990, it was widely accepted that the global temperature trend showed a “0.5°C rise between 1880 and 1950”, as reported by NASA (Hansen and Lebedeff, 1987). This rise (as well as the 0.6C rise between 1880 and 1940) can clearly be seen in the NASA GISS graph from 1987:
…