Archives par mot-clé : CO2 Emissions

Paris Won’t Cut Emissions–Bob Watson

by P. Homewood, November 10, 2019 in NotaLotofPeople KnowThat


It’s apparently taken ex IPCC Chair Bob Watson four years to work out that the Paris Agreement did nothing to reduce emissions.

It’s a pity he did not read this blog, because I was saying the same thing when it was signed!

Steve Milloy reports:


The truth behind the Paris Agreement climate pledges

Almost 75% of 184 Paris Agreement pledges were judged insufficient to slow climate change; Only 28 European Union nations and 7 others will reduce emissions by at least 40% by 2030

UNIVERSAL ECOLOGICAL FUND

  • Only 28 European Union nations & 7 others will reduce emissions by at least 40 percent by 2030
  • China & India, top emitters, will reduce emissions intensity, but their emissions will increase
  • U.S., second top emitter, has reversed key national policies to combat climate change
  • Almost 70 percent of the pledges rely on funding from wealthy nations for their implementation

Almost three-quarters of the 184 climate pledges made under the Paris Agreement aimed at curbing greenhouse gas emissions are inadequate to slow climate change, and some of the world’s largest emitters will continue to increase emissions, according to a panel of world-class climate scientists. It is these increasing greenhouse emissions that are driving climate change.

The Truth Behind the Climate Pledges, a new report published by the Universal Ecological Fund, examines in great detail the 184 voluntary pledges under the Paris Agreement, the first collective global effort to address climate change.

Paris Climate Accord — A Blank Check For CO2 Emissions By China And India

by Dr. Benny Peiser, Nov. 5, 2019 in ClimateChangeDispatch


The Paris Climate Agreement, far from securing a reduction in global CO2 emissions, is fundamentally a blank cheque that allows China and India to increase their emissions as they see fit in pursuit of economic growth.

This is the conclusion of a new paper by Law Professor David Campbell (Lancaster University Law School) and published today by the Global Warming Policy Foundation.

For the last 25 years, international climate change law has failed to agree on a program of global emissions reductions.

Indeed this law grants permission to major emitters such as China and India to emit as much as they see fit. Global emissions reductions, therefore, have always been impossible and since 1992 global emissions have enormously increased.

Indeed, the Paris Agreement contains a categorical statement that countries such as China and India will not be obliged to undertake any reductions.

The UK Government proposes to continue with decarbonization even though Britain’s unilateral decarbonization is utterly pointless and thus wholly irrational.

Read the full paper here (PDF)

Russia Scraps Plans to Set Climate-Change Goals for Businesses

by Natasha Doff, November 7, 2019 in Bloomberg


Bloomberg) — Russia has ditched plans to set greenhouse-gas emissions targets for companies as a sign of its commitment to fighting climate change, following lobbying from big businesses that risked fines if they didn’t comply.

The measure was part of a bill intended to accompany Russia’s ratification of the 2015 Paris Agreement on climate change in September. Instead, the world’s fourth-largest carbon polluter scrapped the proposal after the Russian Union of Industrialists and Entrepreneurs (RSPP) warned it would raise costs for companies and delay investment.

“After consultations with the government, it was decided to abandon the specific regulatory requirements,” the press department of the Economy Ministry, which is drafting the bill, said by email. “The government will have the right to decide after Jan. 1, 2024 what measures to introduce if Russia is forecast to miss its emissions targets.”

Paris Climate Accord — A Blank Check For CO2 Emissions By China And India

by Dr. B. Peiser, No. 5, 2018 in ClimateChangeDispatch


The Paris Climate Agreement, far from securing a reduction in global CO2 emissions, is fundamentally a blank cheque that allows China and India to increase their emissions as they see fit in pursuit of economic growth.

This is the conclusion of a new paper by Law Professor David Campbell (Lancaster University Law School) and published today by the Global Warming Policy Foundation.

For the last 25 years, international climate change law has failed to agree on a program of global emissions reductions.

Indeed this law grants permission to major emitters such as China and India to emit as much as they see fit. Global emissions reductions, therefore, have always been impossible and since 1992 global emissions have enormously increased.

Indeed, the Paris Agreement contains a categorical statement that countries such as China and India will not be obliged to undertake any reductions.

The UK Government proposes to continue with decarbonization even though Britain’s unilateral decarbonization is utterly pointless and thus wholly irrational.

Read the full paper here (PDF)

Solar activity drives CO2 levels

by R. Mac, August 10, 2014  in TheHockeySchtick


Hypothesis: Increasing accumulated solar activity [sunspot time-integral] since the Maunder Minimum 1645-1715 AD has warmed the oceans and land, warming of the oceans has increased ocean outgassing of CO2 [Henry’s Law] and has been the primary cause of increased atmospheric CO2 levels. Ocean temperatures driven by solar activity control atmospheric CO2 levels on short, intermediate, and long-term timescales.

Also note if increased solar activity warms the oceans, the solubility of CO2 in the oceans decreases due to Henry’s Law, thus preventing “acidification” of the oceans. If the oceans are warming due to any cause, Henry’s Law says solubility of CO2 decreases and outgassing increases, preventing “acidification” from man-made and natural sources of CO2. Warnings about ocean acidification are misleading and overblown:

Net-Zero Carbon Dioxide Emissions By 2050 Requires A New Nuclear Power Plant Every Day

by Roger Pielke, Sep. 30, 2019 in WUWT


I research and write about science, policy and politics.

More than a decade ago, Gwyn Prins and Steve Rayner characterized climate policy as an “auction of promises” in which politicians “vied to outbid each other with proposed emissions targets that were simply not achievable.” For instance, among Democrats competing for the presidency in 2020, several, including Joe Biden, have committed to achieving net-zero carbon dioxide emissions by 2050. Candidate Andrew Yang bid 2049, and Cory Booker topped that by offering 2045. Bernie Sanders has offered a 71% reduction by 2030.

One reason that we see this “auction of promises” is that the targets and timetables for emissions reductions are easy to state but difficult to comprehend. Here I’ll present what net-zero carbon dioxide emissions for 2050 actually means in terms of the rate of deployment of carbon-free energy and the coincident decommissioning of fossil fuel infrastructure.

To conduct this analysis I use the BP Statistical Review of World Energy, which presents data on global and national fossil fuel consumption in units called “million tons of oil equivalent” or mtoe. In 2018 the world consumed 11,743 mtoe in the form of coal, natural gas and petroleum. The combustion of these fossil fuels resulted in 33.7 billion tonnes of carbon dioxide emissions. In order for those emissions to reach net-zero, we will have to replace about 12,000 mtoe of energy consumption expected for 2019. (I ignore so-called negative emissions technologies, which do not presently exist at scale.)

Another useful number to know is that there are 11,051 days left until January 1, 2050. To achieve net-zero carbon dioxide emissions globally by 2050 thus requires the deployment of >1 mtoe of carbon-free energy consumption (~12,000 mtoe/11,051 days) every day, starting tomorrow and continuing for the next 30+ years. Achieving net-zero also requires the corresponding equivalent decommissioning of more than 1 mtoe of energy consumption from fossil fuels every single day.

Another important number to consider is the expected increase in energy consumption in coming decades. The International Energy Agency currently projects that global energy consumption will increase by about 1.25% per year to 2040. That rate of increase in energy consumption would mean that the world will require another ~5,800 mtoe of energy consumption by 2050, or about another 0.5 of an mtoe per day to 2050. That brings the total needed deployment level to achieve net-zero emissions to about 1.6 mtoe per day to 2050.


The scale of the challenge to achieve net-zero carbon dioxide emissions in 2050. Roger Pielke Jr., BP 2018

Global decarbonisation efforts ‘stall’, pushing climate goals out of reach

by Matt  Mace, Sep. 19, 2019 in Euractiv


Global decarbonisation efforts will need to be seven times greater if the world is to stand a fair chance of limiting global warming to 1.5C, according to a new PwC report which found decarbonisation has slowed to its lowest level since 2011. EURACTIV’s media partner edie.net reports.

PwC UK’s latest Low Carbon Economy Index (LCEI), published today (19 September), found that reaching the Paris Agreement’s 2C limit for global warming would require the global economy to reduce its carbon intensity by 7.5% every year up to 2100. The report notes that this is five times faster than the current decarbonisation rate of 1.6% – less than half the decarbonisation rate witnessed in 2015 (of 3.3%), when the Paris Agreement was introduced.

In order to meet the more ambitious target of the Paris Agreement – limiting global warming to 1.5C which has been requested by the Intergovernmental Panel on Climate Change (IPCC’s) special report – decarbonisation rates must reach 11.3% annually. That is seven times greater than the current rate, which has slowed to its lowest level since 2011.

FORGET PARIS: CHINA’S NEW COAL BOOM

by Reuters, August 6, 2019 in GWPF


SHANGHAI/BEIJING (Reuters) – Approvals for new coal mine construction in China have surged in 2019, government documents showed, with Beijing expecting consumption of the commodity to rise in the coming years even as it steps up its fight against smog and greenhouse gas emissions.


Long-term cuts in coal consumption are a key part of China’s energy, environment and climate goals, but the fivefold increase in new mine approvals in the first-half of 2019 suggests China’s targets still provide ample room for shorter-term growth.

China’s energy regulator gave the go-ahead to build 141 million tonnes of new annual coal production capacity from January to June, compared to 25 million tonnes over the whole of last year, Reuters analysis of approval documents showed.

The projects included new mines in the regions of Inner Mongolia, Xinjiang, Shanxi and Shaanxi that are part of a national strategy to consolidate output at dedicated coal production “bases”, as well as expansions of existing collieries, the National Energy Administration (NEA) documents showed. […] Chinese coal output rose 2.6% in the first-half of 2019 to 1.76 billion tonnes.

MORE TO COME?

Industry groups still expect coal-fired power capacity to increase over the next few years, with investments in nuclear and renewables still insufficient to cover rising energy demand.

The research unit of the China State Grid Corporation last month forecast that total coal-fired capacity would peak at 1,230-1,350 gigawatts (GW), which would mean an increase of about 200-300 GW.

A study published earlier this year also suggested China’s targets would allow the construction of another 290 GW of coal-fired capacity in the coming years.

Full story


Developing nations latest decade of energy & emissions growth torpedoes alarmist global emissions control scam

by Larry Hamlin, July 23, 2019 in WUWT


The UN has been pursuing global emissions policy for decades that are intended to provide for the establishment of global government schemes allowing it to control world emissions.

No fewer than 24 United Nations Climate Change Conferences have been held at various global locations since 1995 under its Conference of the Parties (COP) legal framework.

COP 21 which occurred in November and December 2015 in Paris resulted in the creation of the Paris Agreement that supposedly established global agreement to reduce greenhouse gas emissions and limit future global temperatures that the UN based upon projections from climate models that grossly exaggerate the impact of greenhouse gases on world temperatures.

The UN IPCC acknowledged in its AR3 climate report in 2001 that it is not possible to develop computer models that are capable of predicting future global climate and yet the Paris Agreement based its emissions targets intended for the future using these flawed computer models.

Three additional UN climate conferences have occurred since the Paris Agreement with the last conference being in 2018 in Poland. No success has been achieved in these three conferences in devising specific commitments for emissions reductions targets for the world’s developing nations.

Additionally the U.S. under President Trump wisely withdrew from the Paris Agreement in June of 2017.

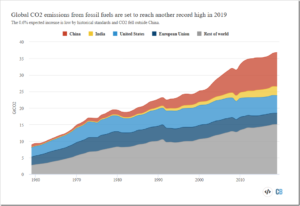
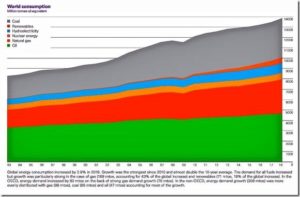
Global energy and emissions detailed information for 2018 is now available which includes data encompassing the latest decade of 2008 to 2018. The world energy consumption data from the report is summarized in the graph below.

This latest decade energy and emissions data clearly demonstrates that the developing nations completely dominate global energy and emissions. This includes both present levels as well as future growth. These results also show that the developed nations play a minority role in these measures both presently and in the future.

The results for the last decade show that global energy use grew by 18.5% during the last decade with 98.5% of that energy growth accounted for by the developing nations.

Capture et stockage du CO2 : une situation étrange…

by Claude Mandril, 13 mai 2019 in ConnaissanceDesEnergies


La capture et le stockage de CO2 (CCS(1)) est indispensable…

Les accords de Paris ont donné l’objectif : un réchauffement climatique « well below 2°C » d’ici 2100 par rapport aux températures de l’ère préindustrielle.

Le dernier rapport du GIEC montre par ailleurs qu’on serait « beaucoup mieux » à + 1,5°C, et que tout dixième de degré compte : + 1,7°C vaut mieux que + 1,8°C. Il faut donc, ajoute le GIEC, atteindre la neutralité carbone autour de 2050.

Or il est complètement exclu d’arrêter toutes les émissions de gaz à effet de serre, et de loin ! :

  • l’AIE estime dans son scénario Sustainable Development (le plus contraignant)(2) que les énergies fossiles représenteront encore 60% de la fourniture mondiale d’énergie en 2040. Même si on juge l’AIE timorée, on est clairement hors limite ! ;

  • la capacité d’extraction charbonnière en Chine a augmenté de 6% en 2018 (selon la National Energy Administration en Chine) ;

  •  et surtout, n’oublions pas les émissions « de procédé » (ciment, sidérurgie, chimie, agroalimentaire).

Donc il faudra des « puits » de carbone. En premier lieu, les forêts mais à condition qu’elles soient exploitées et que les produits de cette exploitation donnent un stockage permanent. L’incendie de Notre-Dame de Paris montre que ce n’est pas garanti… L’usage du bois en chaudière réduit les émissions en remplaçant des émissions de carbone fossile, mais ce n’est pas un puits (sauf avec CCS !).

Reste donc la CCS, qui est indispensable. D’ailleurs, sur les 4 scénarios du GIEC, 3 comportent le déploiement de la CCS, le 4e étant un repoussoir.

Et pourtant la CCS est complètement ignorée voire vilipendée, sauf dans une dizaine de pays.

Examinons les critiques ou les objections :


What Humans Contribute to Atmospheric CO2: Comparison of Carbon Cycle Models with Observations

by Herman Harde, April 3, 2019 in Earth Sciences


Abstract: The Intergovernmental Panel on Climate Change assumes that the inclining atmospheric CO2 concentration over

recent years was almost exclusively determined by anthropogenic emissions, and this increase is made responsible for the rising

temperature over the Industrial Era. Due to the far reaching consequences of this assertion, in this contribution we critically

scrutinize different carbon cycle models and compare them with observations. We further contrast them with an alternative

concept, which also includes temperature dependent natural emission and absorption with an uptake rate scaling proportional

with the CO2 concentration. We show that this approach is in agreement with all observations, and under this premise not really

human activities are responsible for the observed CO2 increase and the expected temperature rise in the atmosphere, but just

opposite the temperature itself dominantly controls the CO2 increase. Therefore, not CO2 but primarily native impacts are

responsible for any observed climate changes.

Keywords: Carbon Cycle, Atmospheric CO2 Concentration, CO2 Residence Time, Anthropogenic Emissions,

Fossil Fuel Combustion, Land Use Change, Climate Change


Human CO2 Emissions Have Little Effect on Atmospheric CO2

by Edwin X Berry , June, 2019 in JAtmOceanSciences


Abstract
The United Nations Intergovernmental Panel on Climate Change (IPCC) agrees human CO2 is only 5 percent and natural CO2 is 95 percent of the CO2 inflow into the atmosphere. The ratio of human to natural CO2 in the atmosphere must equal the ratio of the inflows. Yet IPCC claims human CO2 has caused all the rise in atmospheric CO2 above 280 ppm, which is now 130 ppm or 32 percent of today’s atmospheric CO2. To cause the human 5 percent to become 32 percent in the atmosphere, the IPCC model treats human and natural CO2 differently, which is impossible because the molecules are identical. IPCC’s Bern model artificially traps human CO2 in the atmosphere while it lets natural CO2 flow freely out of the atmosphere. By contrast, a simple Physics Model treats all CO2 molecules the same, as it should, and shows how CO2 flows through the atmosphere and produces a balance level where outflow equals inflow. Thereafter, if inflow is constant, level remains constant. The Physics Model has only one hypothesis, that outflow is proportional to level. The Physics Model exactly replicates the 14C data from 1970 to 2014 with only two physical parameters: balance level and e-time. The 14C data trace how CO2 flows out of the atmosphere. The Physics Model shows the 14 CO2 e-time is a constant 16.5 years. Other data show e-time for 12CO2 is about 4 to 5 years. IPCC claims human CO2 reduces ocean buffer capacity. But that would increase e-time. The constant e-time proves IPCC’s claim is false. IPCC argues that the human-caused reduction of 14C and 13C in the atmosphere prove human CO2 causes all the increase in atmospheric CO2. However, numbers show these isotope data support the Physics Model and reject the IPCC model. The Physics Model shows how inflows of human and natural CO2 into the atmosphere set balance levels proportional to their inflows. Each balance level remains constant if its inflow remains constant. Continued constant CO2 emissions do not add more CO2 to the atmosphere. No CO2 accumulates in the atmosphere. Present human CO2 inflow produces a balance level of about 18 ppm. Present natural CO2inflow produces a balance level of about 392 ppm. Human CO2 is insignificant to the increase of CO2 in the atmosphere. Increased natural CO2 inflow has increased the level of CO2 in the atmosphere.

THE FUTILITY OF WESTERN DE-CARBONISATION

by Ed. Hoskins, June 18, 2019  in GWPF


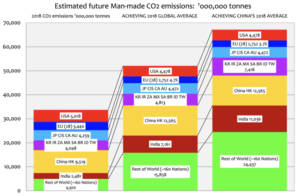
It is clear that CO2 emissions are continuing to grow incrementally in the Developing World.  This should be anticipated to continue indefinitely.

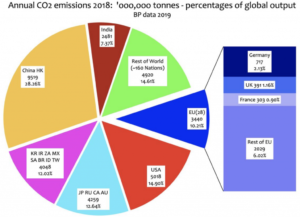
2018 Global CO2 emissions

The following calculations and graphics are based on information on worldwide CO2 emissions published by BP in June 2019 for the period from 1965 up until the end of 2018.

The pie diagram above shows the proportion of CO2 emissions as of the end of 2018.

The previous post for the end of 2017 is available here

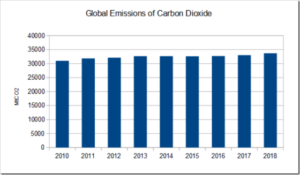
The data showing the progress of CO2 emissions by 2018 in the Developed and Developing worlds can be summarised as follows:

Statistical Review of World Energy

by BP, June 15, 2019


Global primary energy consumption grew rapidly in 2018, led by natural gas and renewables. Nevertheless, carbon emissions rose at their highest rate for seven years

Energy developments

  • Primary energy consumption grew at a rate of 2.9% last year, almost double its 10-year average of 1.5% per year, and the fastest since 2010.
  • By fuel, energy consumption growth was driven by natural gas, which contributed more than 40% of the increase. All fuels grew faster than their 10-year averages, apart from renewables, although renewables still accounted for the second largest increment to energy growth.
  • China, the US and India together accounted for more than two thirds of the global increase in energy demand, with US consumption expanding at its fastest rate for 30 years.


Carbon emissions

  • Carbon emissions grew by 2.0%, the fastest growth for seven years.

The major emitters that are meeting their Paris Agreement pledges

by Axios, June 1, 2019


Of top 10 global carbon emitters, not a single one is hitting its climate goals as outlined under the Paris Agreement, per data from the Climate Action Tracker.

Why it matters: Even if every country that’s adopted the Paris Agreement were to meet their pledges, it would not avert the worst effects of climate change.

Driving the news: June 1 marks the 2-year anniversary of President Trump’s announcement that the U.S. would withdraw from the deal. Per the Climate Action Tracker, the U.S., the second-largest world emitter of greenhouse gasses (but top historical emitter), falls under “critically insufficient,” the worst category, in meeting its Paris pledge.

The backdrop: The Paris Agreement’s main goal is to keep global temperature rise this century to “well below 2ºC,” above pre-industrial levels, and pursue efforts to limit the temperature increase to 1.5ºC.

  • Each country determined what it would be willing to do under the agreement. Such commitments are known as intended nationally determined contributions (INDCs).
  • After ratifying the agreement, the INDC would become the country’s first nationally determined contribution.

So far, 185 countries have ratified or adopted the Paris Agreement. All of the NDCs are available here.

Small increase in EU’s total greenhouse gas emissions in 2017, with transport emissions up for the fourth consecutive year

by European Environment Agency, May 29, 2019


Total greenhouse gas emissions in the European Union (EU) increased by 0.7 % in 2017, according to latest official data published today by the European Environment Agency (EEA). Less coal was used to produce heat and electricity but this was offset by higher industrial and transport emissions, the latter increasing for the fourth consecutive year.

According to the EEA’s Annual European Union greenhouse gas inventory 1990-2017 and inventory report 2019, total greenhouse gas emissions (including international aviation) rose by 0.7 % in 2017 compared with 2016. These official data confirm the preliminary estimates published by the EEA in October 2018. From 1990 to 2017, the EU reduced its net greenhouse gas emissions by 21.7 %. The EU is therefore still exceeding its 20 % reduction target set for 2020.

Les pays du G20 ont augmenté leur consommation énergétique et leurs émissions de CO2 en 2018

by Eva Gomez, 28 mai 2018 in EnvironnementMagazine


Ce mardi 28 mai, le bureau d’études Enerdata publie son bilan énergétique mondial pour l’année 2018. Celui-ci fait part d’une hausse et de nouveaux records de consommation d’énergie et d’émissions de CO2.

En 2018, les pays du G20 ont vu leur consommation d’énergie augmenter de 2,1% et leurs émissions de CO21 de 1,7%, conclut Enerdata ce mardi 28 mai. Dans son nouveau bilan énergétique mondial, le bureau d’étude souligne que la croissance économique reste stable (+3,8%) dans les pays du G20, qui affichent néanmoins un niveau record de consommation énergétique. Dans l’Union européenne, les consommations d’énergie ont un peu diminué, mais cette baisse est compensée par une hausse de celles des Etats-Unis et des pays non membres de l’OCDE. « La consommation énergétique des USA a fortement augmenté, ce qui peut s’expliquer par les conditions climatiques extrêmes auxquelles ils ont été soumis, dont l’hiver très froid qui a demandé beaucoup de chauffage », explique le président d’Enerdata, Pascal Charriau. Par ailleurs, il semblerait que « le développement économique se fasse de façon énergivore : même si on observe un léger gain d’intensité énergétique, l’efficacité énergétique n’est pas améliorée », souligne-t-il.

Solutions au réchauffement climatique : des universitaires de Cambridge tentent de trouver un moyen de re-geler l’Arctique

by F. Gervais, 15 mai 2018, in Atlantico


Atlantico : Quelles solutions envisagées par la communauté scientifique sont aujourd’hui les plus plausibles pour infléchir réellement le réchauffement climatique ? Pour l’inverser ?

François Gervais : La température moyenne de la Planète a augmenté de l’ordre de 1°C depuis le début du siècle dernier. Mais selon les données du Hadley Center britannique (HADCRUT4), 60 % de cette hausse s’est produite de 1910 à 1945 alors que les émissions de CO2 étaient 6 à 10 fois inférieures à ce qu’elles sont de nos jours, plaidant pour une cause principalement naturelle. Durant les 74 années suivantes, la température n’a augmenté que de 0,4°C en dépit de l’accélération des émissions à partir de 1945. Ce ne sont donc pas les observations qui sont inquiétantes mais les projections des modèles de climat repris par le GIEC. Leur problème est toutefois qu’ils ne sont pas d’accord entre eux, prévoyant des hausses avec une incertitude dans un rapport de 1 à 3, incertitude qui ne s’est pas réduite en 40 ans d’études en dépit de moyens considérables. Un corpus de 3000 publications dans des revues internationales conclut en revanche à une prééminence de la variabilité naturelle du climat sur la contribution anthropique. Cela dit, réduire notre addiction au carbone est sans doute sage car les ressources ne sont pas inépuisables. Mais jouer aux apprentis sorciers avec la géo-ingénierie est plus discutable. Et à quoi bon puisque des astronomes prévoient une moindre activité solaire dans les années à venir. Les recherches visant à retransformer le CO2 en carburant à partir de la photosynthèse de micro-algues sont intéressantes, surtout si le prix du baril devait considérablement augmenter à l’avenir. Toutefois, le supplément de CO2dans l’atmosphère a enrichi la biomasse végétale de l’ordre de 20 % comme le vérifie le verdissement de la Planète observé par satellite. Serait-il raisonnable d’en contrarier le bénéfice en particulier pour les plantes nutritives ?

Le CO2 belge : que représente-il vraiment ?

by Jean N., 17 avril 2019 in Science-Climat-Energie


Cet article s’inscrit dans le cadre de l’activité actuelle médiatique tout azimut en Belgique, notamment relayée par les marches hebdomadaires des étudiants pour le climat. Comme vous le savez peut-être si vous êtes un lecteur fidèle de SCE, nous avons démontré dans plusieurs articles que l’hypothèse de l’effet de serre radiatif ne tient pas la route (ici, ici et ici) et n’explique pas le léger réchauffement actuel de la basse atmosphère. Les fins connaisseurs savent également qu’il existe de nombreuses publications scientifiques remettant en cause l’hypothèse de l’effet de serre radiatif (plus de 500 publications rien que pour 2018), toutes écrites par des physiciens, des chimistes, des géologues ou des climatologues. Si cette somme d’évidences vous a convaincu, le GIEC aurait alors tort sur toute la ligne et le CO2 d’origine anthropique n’aurait aucun rôle majeur déterminant la température de la basse troposphère. Cependant, admettons un instant que vous ne soyez pas convaincu et admettons donc que le GIEC ait raison. Tout ce qui est écrit dans son dernier rapport spécial devrait alors être vrai… Quelle serait alors la part de la Belgique dans le réchauffement? Asseyez-vous pour ne pas tomber, vous allez être surpris.

Figure 1. Extrait de la Figure SPM.1 du résumé pour décideurs (SPM) du rapport spécial publié par le GIEC fin 2018. Cette figure se trouve en page 8 du rapport du GIEC.

Global Energy & CO2 Status Report

by IEA, March 2019 (.pdf)


Key Findings 2018

Global energy consumption in 2018 increased at nearly twice the average rate of growth since 2010, driven by a robust global economy and higher heating and cooling needs in some parts of the world. Demand for all fuels increased, led by natural gas, even as solar and wind posted double-digit growth. Higher electricity demand was responsible for over half of the growth in energy needs. Energy efficiency saw lacklustre improvement.

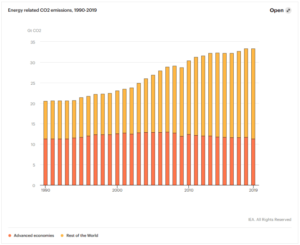
Energy-related CO2 emissions rose 1.7% to a historic high of 33.1 Gt CO2. While emissions from all fossil fuels increased, the power sector accounted for nearly two-thirds of emissions growth. Coal use in power alone surpassed 10 Gt CO2, mostly in Asia. China, India, and the United States accounted for 85% of the net increase in emissions, while emissions declined for Germany, Japan, Mexico, France and the United Kingdom.

Oil demand rose by 1.3% in 2018, led by strong growth in the United States. The start-up of large petrochemical projects drove product demand, which partially offset a slowdown in growth in gasoline demand. The United States and China showed the largest overall growth, while demand fell in Japan and Korea and was stagnant in Europe.

Natural gas consumption grew by an estimated 4.6%, its largest increase since 2010 when gas demand bounced back from the global financial crisis. This second consecutive year of strong growth, following a 3% rise in 2017, was driven by growing energy demand and substitution from coal. The switch from coal to gas accounted for over one-fifth of the rise in gas demand. The United States led the growth followed by China.

Coal demand grew for a second year, but its role in the global mix continued to decline. Last year’s 0.7% increase was significantly slower than the 4.5% annual growth rate seen in the period 2000- 10. But while the share of coal in primary energy demand and in electricity generation slowly continues to decrease, it still remains the largest source of electricity and the second-largest source of primary energy.

Higher energy demand drove up global CO2 emissions in 2018

by IEA, April 7, 2019


Higher energy demand drove up global CO2 emissions in 2018
We released our second annual report on global energy trends last week, highlighting that energy demand worldwide grew by 2.3% in 2018, its fastest pace this decade, thanks to a strong global economy and higher demand for heating and cooling.
Natural gas emerged as the fuel of choice, posting the biggest gains and accounting for 45% of the rise in energy consumption. Solar and wind generation grew at double-digit pace, with solar alone increasing by 31%. Still, that was not fast enough to meet higher electricity demand around the world that also drove up coal use.

As a result, global energy-related CO2 emissions rose by 1.7% to 33 Gigatonnes (Gt) with coal use in power generation alone surpassing 10 Gt and accounting for a third of total emissions. The majority of that was from coal-fired generation capacity in Asia, with a fleet of young power plants that are decades short of average lifetimes of around 50 years.

CO2 Emissions Up As Europeans Switch From Diesel To Gasoline Cars

by K. Oroschakoff, April 6, 2019 in WUWT


The aftermath of the Dieselgate scandal is pushing drivers to switch from diesel to gasoline cars, undermining efforts to cut carbon dioxide emissions from road transport.

Average CO2 emissions from new cars rose in 2017 for the first time since 2010 — largely due to the fuel change, according to final data released by the European Environment Agency (EEA) on Thursday.

That’s bad news for the EU’s efforts to cut emissions by at least 40 percent by 2030. Cars are responsible for around 12 percent of total EU CO2 emissions, according to the European Commission.

The EEA said that average CO2 emissions from new cars sold in 2017 increased by 0.4 grams of CO2 per kilometer to 118.5 grams, up from 118.1 grams in 2016. Under EU rules, carmakers need to meet a fleet-wide target of 95 grams by 2021.

Since 2010, emissions from new cars have fallen by 15.5 percent, or almost 22 grams of CO2 per kilometer; but emission reductions slowed between 2015 and 2016.

The rise in car pollution in 2017 is “stark confirmation that car makers need to achieve further and faster improvements in manufacturing and promoting more efficient cars,” the EEA said.

EU consumption results in high carbon emissions from tropical deforestation, studies show

by Charles the moderator, March 29, 2019 in WUWT


Chalmers University of Technology

A sixth of all emissions resulting from the typical diet of an EU citizen can be directly linked to deforestation of tropical forests. Two new studies, from Chalmers University of Technology, Sweden, shed new light on this impact, by combining satellite imagery of the rainforest, global land use statistics and data of international trade patterns.

“In effect, you could say that the EU imports large amounts of deforestation every year. If the EU really wants to achieve its climate goals, it must set harder environmental demands on those who export food to the EU,” says Martin Persson from Chalmers, one of the researchers behind the studies.

The link between production of certain foods and deforestation has been known before. But what Martin Persson and Chalmers colleague Florence Pendrill have now investigated is the extent to which deforestation in the tropics is linked to food production, and then where those foods are eventually consumed. In the first study, they focused on how the expansion of cropland, pastures, and forestry plantations has taken place at the expense of the rainforest.

196595_web

Emissions sources for deforestation-related carbon dioxide emissions are diverse and vary by region. Emissions embodied in production are shown for each commodity group within each region. A region’s width on the x-axis corresponds to the embodied emissions produced in that region, while the y-axis shows the share of emission attributed to each commodity group within each region, implying that the rectangles within the plot are scaled according to the emissions embodied in each region-commodity combination. The percentages within the rectangles indicate the share of the total embodied emissions; 2.6?gigatonnes of carbon dioxide due to tropical deforestation during the period 2010-2014.
Credit: Florence Pendrill, Chalmers University of Technology


INFO-SCE: 5% d’augmentation de production d’électricité en Chine : cela fait quoi?

by Science,  Climat et Energie, 27 mars 2019


Selon le dernier rapport de l’IEA, la consommation d’énergie mondiale a augmenté de 2,3% en 2018 ce qui représente la plus forte augmentation des dix dernières années. Le gaz naturel fut le plus consommé et représente 45% de l’augmentation de la consommation totale d’énergie.

Suite à cette augmentation de consommation d’énergie les émissions de CO2 se sont accrues de 1,7% pour atteindre 33,1 Gt en 2018. Près d’un tiers de ces émissions provient des centrales de charbon, surtout celles de la Chine.

Il faut noter que les émissions de CO2 en Chine ont augmenté de 2,5%, ou 230 Mt, pour atteindre 9,5 Gt. Un bond de plus de 5% de la production d’électricité à partir de centrales au charbon a entraîné une augmentation des émissions de 250 Mt, ce qui a plus que compensé l’impact de la baisse de l’utilisation du charbon en dehors du secteur de l’énergie.

Pour comparer…la Belgique émet 115 Mt de CO2.

DONC…l’augmentation des émissions en Chine dues au charbon en 2018 représente plus du double de toutes les émissions de CO2 de la Belgique.