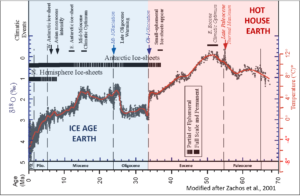
Note how the PETM (55 Ma) is about as far from a CO2 analog to modern times as it possibly could be… unless the PETM stomata data are correct, in which case AGW is even more insignificant than previously thought.
Regarding temperatures, the PETM is also about as far from being an analog to modern times as it possibly could be.
Figure 2. High latitude SST (°C) From benthic foram δ18O. Funny how the PETM is often cited as a nightmarish version of a real-world RCP8.5… While the warmer EECO is a climatic optimum. (Zachos et al., 2001). Note: Older is to the right.
Recently, CO2 Science brought up a paper in Nature Communications.
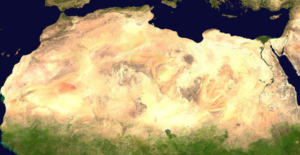
Using satellite images, Venter et al. 2018 found an eight percent increase in woody vegetation in sub-Saharan Africa over the last three decades, underscoring the global “greening trend”.
…
According to Wikipedia, the Sahara covers a vast area of some 9.2 million square kilometers. Eight percent of that translates into more than 700,000 square kilometers. That’s an area that’s almost as big as Germany and France combined! This is profound.
In other words, it’s well over 10,000 Manhattans!
Recent study by Venter et al finds that the Sahara has shrunk by 8% over the past three decades. NASA image, public domain.
by Dr. Jean N., 16 janvier 2019 in ScienceClimatEnergie
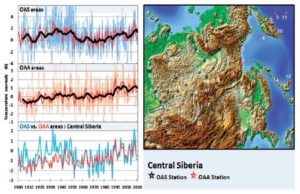
La théorie radiative de l’effet de serre prédit que la température de la basse atmosphère augmente lorsque le taux de CO2 croît. Si l’on prend par exemple une très vaste région, comme la Chine centrale ou le Midwest américain, qui couvrent tous deux des centaines de milliers de km2, on devrait donc observer un accroissement des températures moyennes de la basse atmosphère en fonction du temps. Effectivement, dans ces régions, et comme pour tout l’hémisphère Nord, le taux de CO2 n’a fait qu’augmenter depuis le début des mesures par spectrométrie infra-rouge en 1959. Cependant, une étude récente vient de montrer que la température moyenne n’aurait pas augmenté dans ces vastes régions, et ce malgré l’augmentation du taux de CO2 atmosphérique. L’étude en question a été publiée dans Energy & Environment en 2018 par deux chercheurs danois de la Danish Technical University, Frank Lansner et Jens Pedersen. Il faut rester prudent, mais si cette étude est confirmée, il s’agirait d’un sérieux problème pour la théorie radiative de l’effet de serre.
…
Figure 1. Anomalie de température pour la Sibérie centrale entre 1900 et 2010 (voir article)
Study suggests that in the last 60 years up to half the observed warming and associated sea level rise in low- and mid- latitudes of the Atlantic Ocean is due to changes in ocean circulation.
Over the past century, increased greenhouse gas emissions have given rise to an excess of energy in the Earth system. More than 90% of this excess energy has been absorbed by the ocean, leading to increased ocean temperatures and associated sea level rise, while moderating surface warming.
The multi-disciplinary team of scientists have published estimates in PNAS, that global warming of the oceans of 436 x 1021 Joules has occurred from 1871 to present (roughly 1000 times annual worldwide human primary energy consumption) and that comparable warming happened over the periods 1920-1945 and 1990-2015.
Climate models postulate that increasing CO2 concentrations will intensify the Earth’s water cycle. This intensification is believed to eventually result in dangerous (3°C and up) global warming. Observational evidence has thus far falsified these IPCC-endorsed claims.
Comme tout le monde le sait, pour expliquer la légère hausse des températures de l’atmosphère observée au 20e siècle, le GIEC invoque un seul responsable : le taux de CO2 atmosphérique, et donc l’activité humaine. Les médias, bien entendu, suivent le GIEC et le monde entier diabolise le CO2. Cependant, n’existe-t-il pas d’autres hypothèses? Les lecteurs attentifs de ce site (SCE) savent que l’hypothèse du GIEC est mise à mal par toute une série d’observations (voir par exemple ici, ici et ici) et que certains problèmes théoriques existent dans la théorie même de l’effet de serre (voir ici et ici). Quelle est donc l’explication pour le réchauffement si ce n’est pas le taux de CO2? Bien qu’il y ait probablement des causes multiples, nous allons voir qu’une équipe de chercheurs du CERN propose une hypothèse alternative en se basant sur les résultats du projet CLOUD. Une vidéo récente (octobre 2018) présentant les résultats de cette expérience sera d’ailleurs présentée en fin d’article. Avant de regarder cette vidéo, faisons d’abord le point.
Figure 1. Formation de nuages en présence de noyaux de condensation (CCN : Cloud Condensation Nuclei).
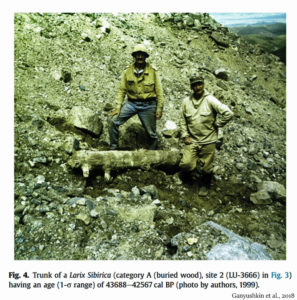
Between 60 and 40 thousand years ago, during the middle of the last glacial, atmospheric CO2 levels hovered around 200 ppm – half of today’s concentration.
Tree remains dated to this period have been discovered 600-700 meters atop the modern treeline in the Russian Altai mountains. This suggests surface air temperatures were between 2°C and 3°C warmer than today during this glacial period.
Tree trunks dating to the Early Holocene (between 10.6 and 6.2 thousand years ago) have been found about 350 meters higher than the modern treeline edge. This suggests summer temperatures were between 2°C and 2.5°C warmer than today during the Early Holocene, when CO2 concentrations ranged between about 250 and 270 ppm.
None of this paleoclimate treeline or temperature evidence correlates with a CO2-driven climate.
More people are finally beginning to realize that supplying the world with sufficient, stable energy solely from sun and wind power will be impossible.
Germany took on that challenge, to show the world how to build a society based entirely on “green, renewable” energy. It has now hit a brick wall. Despite huge investments in wind, solar and biofuel energy production capacity, Germany has not reduced CO2 emissions over the last ten years. However, during the same period, its electricity prices have risen dramatically, significantly impacting factories, employment and poor families.
Germany has installed solar and wind power to such an extent that it should theoretically be able to satisfy the power requirement on any day that provides sufficient sunshine and wind. However, since sun and wind are often lacking – in Germany even more so than in other countries like Italy or Greece – the country only manages to produce around 27% of its annual electric power needs from these sources.
Jochem Marotzke, director of Germany’s Max Planck Institute for Meteorology (MPIM), wondered whether CO2 savings could really have a direct influence on the temperature in the near future. In a new paper (Marotzke 2018), the Hamburg-based climate researcher simulates the temperature profile of the 2030s predicted by climate models and uses once again a conventional emission profile (Scenario RCP 4.5), and once a politically reduced emission scenario.
Conclusion: Most likely, there would probably be no difference as natural climate variability prevails over these time scales. The paper was published in WIRE’s Climate Change and can be downloaded free of charge as a pdf:
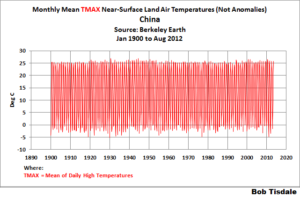
I was preparing a post using Berkeley Earth Near-Surface Land Air Temperature data that included the highest-annual TMAX temperatures (not anomalies) for China…you know, the country with the highest population here on our wonder-filled planet Earth. The graph was for the period of 1900 to 2012 (FYI, 2012 is the last full year of the local TMAX and TMIN data from Berkeley Earth). Berkeley Earth’s China data can be found here, with the China TMAX data here. For a more-detailed explanation, referring to Figure 1, I was extracting the highest peak values for every year of the TMAX Data for China, but I hadn’t yet plotted the graph in Figure 1, so I had no idea what I was about to see.
Figure 1 The results are presented in Figure 2, and they were a little surprising, to say the least.
“The results of this review point to the extreme value of CO2 to all life forms, but no role of CO2 in any significant change of the Earth’s climate. … Many believe and/or support the notion that the Earth’s atmosphere is a ‘greenhouse’ with CO2 as the primary “greenhouse” gas warming Earth. That this concept seems acceptable is understandable—the modern heating of the Earth’s atmosphere began at the end of the Little Ice Age in 1850. The industrial revolution took hold about the same time. It would be natural to believe that these two events could be the reason for the rise in temperature. There is now a much clearer picture of an alternative reason for why the Earth’s surface temperature has risen since 1850.”
“There is no correlation of CO2 with temperature in any historical data set that was reviewed”.
The polar regions of the Earth have long been depicted as canary-in-the-coal-mine sentinels of climate change, given that climate models project that CO2-induced global warming will manifest itself here, first and foremost, compared to other planetary latitudes. Consequently, researchers are frequently examining the Arctic and Antarctic for evidence of recent climate change.
…
Clearly, as demonstrated here and in other studies (see, for example, The Antarctic Peninsula: No Longer the Canary in the Coal Mine for Climate Alarmists and the references therein) there is a canary in the Antarctic alright, but it is alive and well. And these counter-observations do not bode well for climate models and their projections of CO2-induced global warming.
Figure 1. Surface mass-balance records for glaciers around the northern Antarctic Peninsula. Source: Engel et al. (2018).
by J.C. Maurin, 2 décembre 2018 in ScienceClimatEnergie
Au XVIe siècle, dans une ultime tentative pour sauver le système de Ptolémée, on se résigna enfin à admettre la rotation des planètes autour du Soleil mais on conserva le dogme de la position centrale de la Terre par rapport au Soleil. Le dernier pas vers l’héliocentrisme dut finalement être franchi, à regret. Au XXIesiècle, Le GIEC adapte discrètement son Almageste : on lit dans la version de novembre 2018 du Résumé à l’intention des décideurs dès la première page, 1er encadré de l’introduction → “L’augmentation mondiale de la concentration en dioxyde de carbone est essentiellement due à l’utilisation des combustibles fossiles et aux changements d’affectation des terres”. Fin de cette première page → « La source principale de l’augmentation de la concentration du dioxyde de carbone dans l’atmosphère depuis l’époque préindustrielle provient de l’utilisation des combustibles fossiles ». La certitude absolue, naguère affichée, d’une origine 100% anthropique dans la hausse du CO2atmosphérique disparaît donc. Un modèle mixte est désormais implicitement admis. A cinq siècles de distance, le dernier pas reste toujours difficile à franchir. Le présent article aide à trouver le chemin de Damas.
Figure 1. Rappels des observations (1/4) et corrélations (2/4)
Here, we reconstructed Phanerozoic PCO2 from a single proxy: the stable carbon isotopic fractionation associated with photosynthesis (Ɛp) that increases as PCO2 increases. This concept has been widely applied to alkenones, but here, we expand this concept both spatially and temporally by applying it to all marine phytoplankton via a diagenetic product of chlorophyll, phytane. We obtained data from 306 marine sediments and oils, which showed that Ɛp ranges from 11 to 24‰, agreeing with the observed range of maximum fractionation of Rubisco (i.e., 25 to 28‰). The observed secular PCO2 trend derived from phytane-based Ɛp mirrors the available compilations of PCO2over the past 420 Ma, except for two periods in which our higher estimates agree with the warm climate during those time periods. Our record currently provides the longest secular trend in PCO2 based on a single marine proxy, covering the past 500 Ma of Earth history
…
Fig. 2Ɛp calculated from phytane in Witkowski et al., 2018
by H. Schreuder, November 28, 2018 in ClimateChangeDipsatch
After decades of alarm calls over the impact of human emissions of carbon dioxide (CO2) on global temperatures and climate change, a glaring lack of factually demonstrated and scientifically proven evidence remains.
The evidence presented has been based on computer modeling of temperatures from global weather stations, a larger percentage of which are sited in towns and cities and no data, numerous studies show.
For the 70% of oceans, seas, and lakes, satellite measurements are routinely adjusted to take account of anomalies and sea level rise alarm, expressed in measurements of millimeters per century, does not quantify in that tidal gauges are subjected to landmass upheavals and/or subsidence, none of which can be taken to represent empirical evidence.See Also: New study shows coastlines gaining land despite sea level alarmism) …
La raison d’être de la taxe carbone qui pèse sur les carburants est qu’en augmentant le prix des carburants en France, cette taxe va diminuer la consommation de carburant, et les rejets de CO2 qui vont avec. Le raisonnement est solide. Mais la question est : de combien ? C’est l’enjeu. L’augmentation de cette taxe met le pays à feu et à sang. C’est la chandelle. Le jeu en vaut-il bien la chandelle ?
Pour y répondre il faut connaître la sensibilité de la consommation au prix, ce qu’on appelle l’élasticité-prix. C’est le rapport de l’effet, la variation de consommation (mesurée en %) sur la cause, la hausse de prix (également mesurée en %). Si une hausse des prix de 10% entraîne une diminution de consommation de 8%, l’élasticité est de -0,8.
New research disputes a long-held view that our earliest tool-bearing ancestors contributed to the demise of large mammals in Africa over the last several million years. Instead, the researchers argue that long-term environmental change drove the extinctions, mainly in the form of grassland expansion likely caused by falling atmospheric carbon dioxide (CO2) levels.
The study is published today in the journal Science.
“Despite decades of literature asserting that early hominins impacted ancient African faunas, there have been few attempts to actually test this scenario or to explore alternatives,” Faith says. “We think our study is a major step towards understanding the depth of anthropogenic impacts on large mammal communities, and provides a convincing counter-argument to these long-held views about our early ancestors.”
To test for ancient hominin impacts, the researchers compiled a seven-million-year record of herbivore extinctions in eastern Africa, focusing on the very largest species, the so-called ‘megaherbivores’ (species over 2,000 lbs.) Though only five megaherbivores exist in Africa today, there was a much greater diversity in the past. For example, three-million-year-old ‘Lucy’ (Australopithecus afarensis) shared her woodland landscape with three giraffes, two rhinos, a hippo, and four elephant-like species at Hadar, Ethiopia.
by Paul Berth, 22 novembre 2018, in ScienceClimatEnergie
Les microbulles de gaz emprisonnées dans les carottes de glace sont fréquemment utilisées pour estimer le taux de CO2 de l’atmosphère du passé. Il s’agit de méthodes de mesure indirectes. Par exemple la carotte de glace EPICA Dome C en Antarctique nous suggère que le CO2 de l’atmosphère a varié entre 180 et 300 ppmv pendant les derniers 650 000 ans (Brook 2005). Cependant, le taux de CO2 observé dans ces carottes de glace représente-il vraiment l’atmosphère du passé? Nous allons montrer ici qu’un paramètre est souvent négligé par les glaciologues, et que ce paramètre pourrait avoir un effet considérable sur le résultat des analyses : il s’agit de la présence de micro-organismes dans la glace et les microbulles.
In the climate alarmists’ worldwide crusade against carbon dioxide gas, only the most delusional still believe that wind and solar power add anything to their arsenal.
As we have said repeatedly, nuclear power is the only stand-alone power generation source which is capable of delivering power on demand, without CO2 emissions being generated in the process.
Perversely, notwithstanding that Australia is in the top three uranium exporters, it’s the only G20 country with a legislated prohibition on nuclear power generation…
by J.C. Maurin, 12 novembre 2018 in ScienceClimatEnergie
L’IPCC (GIEC en français) fut créé en 1988 par l’UNEP (United Nations Environment Programme) et le WMO (World Meteorological Organization). Dans les principes régissant les travaux du GIEC (1) on lit : Le GIEC a pour mission d’évaluer … les risques liés au changement climatique d’origine humaine.Le GIEC respecte son propre principe fondateur : il attribue l’intégralité de la hausse du taux de CO2 depuis 1958 à une cause anthropique. Nous examinerons ici le modèle anthropique du GIEC et nous le confronterons aux mesures contemporaines, puis à un modèle mixte. Cet article fait suite aux deux précédents publiés sur le site SCE au cours des mois de septembre (1/4) et octobre 2018 (2/4).
C. Modèle anthropique GIEC
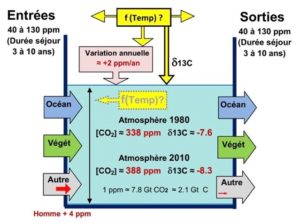
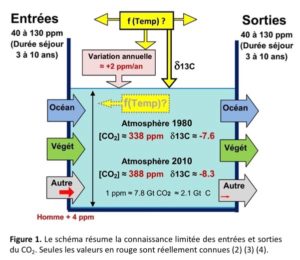
C.1 Les contraintes des modèles (Fig. 1)
Le paragraphe A (article 1/4) a montré qu’en 1980 le taux de CO2 atmosphérique était de 338 ppm et le δ13C de -7.6 ‰. En 2010 le taux de CO2 atmosphérique était de 388 ppm et leδ13C de -8.3 ‰. Il existe une modulation annuelle de ce taux, très marquée dans l’hémisphère Nord.
Des modèles, cela fait 40 ans que j’en fais », précise d’emblée Henri Masson. Ingénieur chimiste de formation (Université Libre de Bruxelles), docteur en sciences appliquées, professeur émérite à l’Université d’Anvers, expert globe-trotter (notamment pour la Banque Mondiale et l’ONU), l’homme est, de surcroît, doté d’un sérieux sens de la vulgarisation. Lorsque Contrepoints lui propose d’analyser les modèles prédictifs du GIEC, le Belge est catégorique : « Si mes étudiants me présentaient de tels modèles, je n’hésiterais pas à les recaler ! »
Contrepoints : Quelle confiance peut-on accorder aux modèles du GIEC, qui prévoient, parmi d’autres choses, un réchauffement planétaire dû aux émissions humaines de CO2 ?
by J.C. Maurin, 12 novembre 2018 in ScienceClimatEnergie
L’IPCC (GIEC en français) fut créé en 1988 par l’UNEP (United Nations Environment Programme) et le WMO (World Meteorological Organization). Dans les principes régissant les travaux du GIEC (1) on lit : Le GIEC a pour mission d’évaluer … les risques liés au changement climatique d’origine humaine.Le GIEC respecte son propre principe fondateur : il attribue l’intégralité de la hausse du taux de CO2 depuis 1958 à une cause anthropique. Nous examinerons ici le modèle anthropique du GIEC et nous le confronterons aux mesures contemporaines, puis à un modèle mixte. Cet article fait suite aux deux précédents publiés sur le site SCE au cours des mois de septembre (1/4) et octobre 2018 (2/4).
…
C.4. Conclusions
Un modèle qui décrit un monde fixe, en équilibre, un modèle où l’homme est central, un modèle qui parvient à reproduire certaines observations mais pas toutes, un modèle unanimement soutenu par les autorités politiques ou morales, enfin un modèle qui pose a priori un principe intangible… est le type même de modèle qui fut développé par Ptolémée (6) pour le système solaire. Ce modèle fut jadis l’objet d’un consensus à > 97%.
L’atmosphère actuelle comporte environ 20 ppm de CO2 anthropique correspondant à 20/400 soit ≈ 5% du CO2 atmosphérique. En un siècle les hommes ont donc modifié la composition de l’atmosphère de 20 ppm soit 0,002% : sur ce sujet également, il semble que nous ne soyons pas au centre du monde.
Les évolutions récentes du CO2 atmosphérique ne peuvent pas avoir une cause uniquement anthropique: les observations du δ13C l’interdisent. Les causes sont anthropiques et naturelles. Le modèle purement anthropique du GIEC est donc à rejeter.
La géologie, une science plus que passionnante … et diverse