The authors evaluate the United Nations Intergovernmental Panel on Climate Change (IPCC) consensus that the increase of carbon dioxide in the Earth’s atmosphere is of anthropogenic origin and is causing dangerous global warming, climate change and climate disruption. The totality of the data available on which that theory is based is evaluated. The data include: (a) Vostok ice-core measurements; (b) accumulation of CO2 in the atmosphere; (c) studies of temperature changes that precede CO2 changes; (d) global temperature trends; (e) current ratio of carbon isotopes in the atmosphere; (f) satellite data for the geographic distribution of atmospheric CO2; (g) effect of solar activity on cosmic rays and cloud cover. Nothing in the data supports the supposition that atmospheric CO2 is a driver of weather or climate, or that human emissions control atmos- pheric CO2.
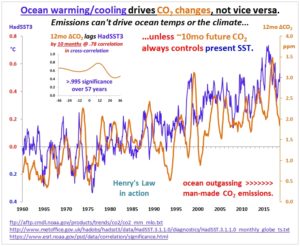
► Changes in global atmospheric CO2 are lagging 11–12 months behind changes in global sea surface temperature. ► Changes in global atmospheric CO2 are lagging 9.5–10 months behind changes in global air surface temperature. ► Changes in global atmospheric CO2 are lagging about 9 months behind changes in global lower troposphere temperature. ► Changes in ocean temperatures explain a substantial part of the observed changes in atmospheric CO2 since January 1980. ► Changes in atmospheric CO2 are not tracking changes in human emissions.
by K. Richard, November 1, 2018 in NoTricksZone/PNAS
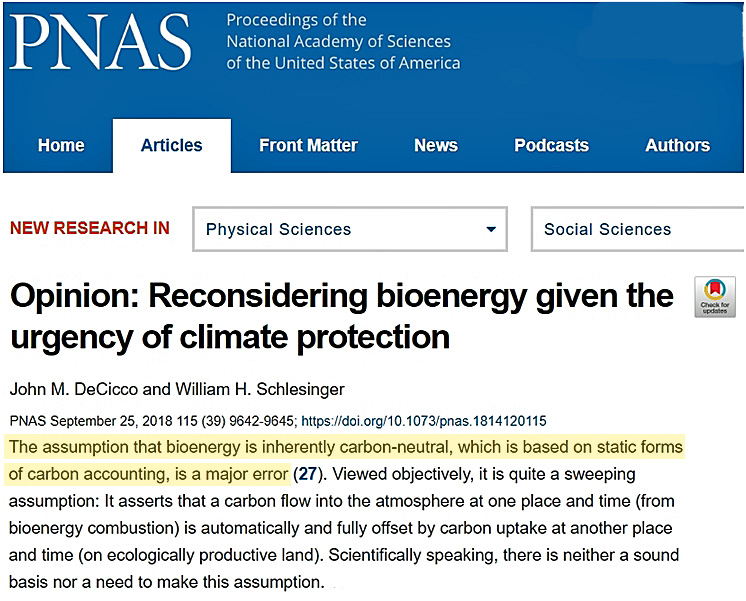
Governments vociferously promote bioenergy as renewable, sustainable, and carbon-neutral. But scientists are increasingly characterizing this “belief” as a “major error”, as bioenergy generates more CO2 emissions per kWh than burning coal does, and the projected rapid growth in bioenergy will serve to ‘increase atmospheric CO2 for at least a century’ as well as clear forests and destroy natural ecosystems.
Davis, W.J. 2017. The relationship between atmospheric carbon dioxide concentration and global temperature for the last 425 million years. Climate5: 76; doi: 10.3390/cli5040076.
Writing by way of introduction to his work, Davis (2017) notes that “a central question for contemporary climate policy is how much of the observed global warming is attributable to the accumulation of atmospheric CO2 and other trace greenhouse gases emitted by human activities.” If you talk to a climate alarmist, the answer you receive from such an inquiry will likely be “almost all.” A climate skeptic, on the other hand, will likely respond that the answer is “likely none.”
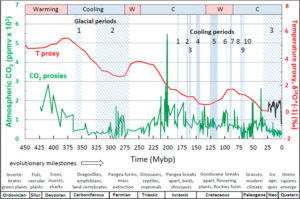
Hoping to provide some crucial information on this topic, Davis analyzed the relationship between historic temperature and atmospheric CO2 using the most comprehensive assemblage of empirical databases of these two variables available for the Phanerozoic period (522 to 0 million years before present; Mybp). In all, 6680 proxy temperature and 831 proxy CO2 measurements were utilized, enabling what Davis described as “the most accurate quantitative empirical evaluation to date of the relationship between atmospheric CO2concentration and temperature.” Multiple statistical procedures and analyses were applied to the proxy records and the resultant relationship is depicted in the figure below.
by A. Bright-Paul, October 22, 2018 in ClimateChageDispatch
As the Earth rotates on its own axis, one-half of the Earth is cooling while the other half is warming up.
So the Earth is warming and cooling daily and the temperature is changing 3,600 times every hour in every location all over the world, as there are 3,600 seconds in every hour.
As the Earth is traveling around the Sun in an ellipse at 66,000 miles per hour and is tilted and wobbling as it spins, so the Earth has seasons, as the angle to the Sun varies.
So the temperatures in the spring and summer are usually warmer than in the autumn and winter when temperatures decline.
So there is a massive number of different temperatures over the whole Earth, constantly changing and always in flux.
The recently released IPCC SR15 reports (at A1) that global warming is likely to reach 1.5°C between 2032 and 2050 and (at B) will probably bring species extinction, weather extremes and risks to food supply, health and economic growth. If we are to avoid this, net CO2 emissions will need to decline by about 45% from 2010 levels by 2030, reaching net zero by 2050 (C1), followed by extensive removals (C5). The required energy investment alone will be $2.4 trillion per year.
Is this possible?
As at 2015, which was not materially different from 2010, more than half the planet’s total CO2 emissions (36Gt) were sourced from just three countries:
by JC Maurin, 4 octobre 2018 in Science,Climat,Energie
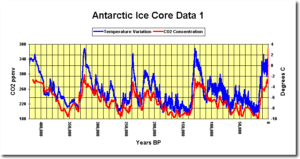
Pour les derniers millénaires, les proxies archives glaciaires montrent une corrélation entre rapport isotopique (« température ») et taux de CO2 subsistant dans les microbulles. Toutefois les valeurs numériques de taux de CO2 doivent être prises avec précaution: l’enregistrement comporte à minima un biais « passe bas » qui efface les extremums. Si la corrélation est bien réelle, en revanche des affirmations telles que « les taux de CO2 des derniers millénaires sont toujours inférieurs aux taux après 1958 », ou bien « une variation de 1°C entraîne une variation de 12 ppm » ne sont pas démontrées.
Le CO2 ne précède jamais l’augmentation de la température, et cela depuis au moins le Pléistocène (240 000 ans) où la démonstration a bien été établie (cf. Fig. 8). Le CO2 n’est donc pas le ‘bouton’ contrôlant l’évolution de la température.
Les concentrations anciennes de CO2 atmosphérique sont sous-estimées et les données de Vostok non seulement donnent un ‘ background’ plus faible que les données fournies par l’analyse des stomates (Fig.10,) mais ne voient pas les pics de concentrations plus élevés de CO2. Ainsi affirmer que les teneurs actuelles en CO2n’ont jamais été aussi élevées, même à une échelle géologique très restreinte (telle que Quaternaire) est trompeur.
Pour les dernières décennies, les mesures contemporaines montrent une corrélation entre température de surface des océans sous les tropiques et variation annuelle du taux de CO2. La variation annuelle c’est aussi la différence entre entrées et sorties. Les mesures contemporaines montrent également une corrélation entre température des océans sous les tropiques et variation annuelle du δ13C. Ces 2 corrélations sont nettes lors des forts épisodes El Niño de 1998 et 2016.
Nous exploiterons ces corrélations dans la troisième partie qui montrera que le modèle anthropique du GIEC n’est pas en accord avec les mesures du δ13C et ne peut rendre compte des évolutions récentes du CO2 .
Extreme weather events, mostly drought are considered, but floods as well, correspond to solar minima in more than 75% (18 out of 24 of the cases known).
Current concentrations of carbon dioxide cannot be invoked for extreme weather in the historical past.
The sun controls the climate of the Earth.
During summer it is inevitable that lightning storms ignite fires and produce heavy rain. The intensity of what we have come to call extreme weather is magnified by standing Rossby waves.
Sunspot research tends to emphasize sunspot peaks and sunspot numbers; more may be gained by evaluating trough events and peak and trough frequencies.
One final gem from Davis’ work is a pronouncement that follows a discussion on the lack of correlation between CO2 and temperature across the historical record, where he aptly reminds us that “correlation does not imply causality, but the absence of correlation proves conclusively the absence of causality.” Consequently, there should be no more doubt regarding the ineffectiveness of atmospheric CO2 to control or drive climate change. It is simply nothing more than a bit player, whose influence has been continually overestimated by climate alarmists. The big question now is whether or not 500 million years of these data will convince them otherwise!
by P. Gosselin, September 19, 2018 in ClimateChangeDispatch
The German ADAC association, the equivalent of America’s AAA, carried a CO2 comparison for a variety e-autos and combustion engine cars. The results were very surprising, says German magazine Autobild here.
Today’s electric cars are being pushed as a clean and environmentally friendly alternative, while diesel and gasoline burning engines are being villainized as polluters and climate killer …
by J.C. Maurin, 16 septembre 2018, in Science,Climate,Energie
Dans les années 80, la découverte dans les archives glaciaires d’une corrélation entre température et taux de CO2 permit de soupçonner une influence anthropique sur le climat: les taux mesurés depuis 1958 étaient supérieurs aux taux des archives glaciaires.
L’IPPC (GIEC) fut créé en 1988 par 2 organismes: United Nations Environment Programme (UNEP) et World Meteorological Organization (WMO). Le GIEC attribue l’intégralité de la hausse du taux de CO2 depuis un siècle à l’influence humaine. Pour les dernières décennies, nous examinerons ici les mesures disponibles, les corrélations CO2 / température, enfin le modèle anthropique GIEC sera confronté à un modèle concurrent.
The question is how does the Intergovernmental Panel on Climate Change (IPCC) determine that an increase in atmospheric CO2 causes an increase in global temperature? The answer is they assumed it was the case and confirmed it by increasing CO2 levels in their computer climate models and the temperature went up. Science must overlook the fact that they wrote the computer code that told the computer to increase temperature with a CO2 increase. Science must ask if that sequence is confirmed by empirical evidence? Some scientists did that and found the empirical evidence showed it was not true. Why isn’t this central to all debate about anthropogenic global warming?
by Claire Stam, 31 août 2018 in Euratciv/LaTribuneGenève
Alors qu’elle avoue la part de responsabilité de l’Allemagne dans le changement climatique, et carrément au passage, l’échec de la transition énergétique dans son pays, Angela Merkel s’est pourtant exprimée à la télé pour s’opposer aux objectifs climatiques plus ambitieux proposés par l’Union européenne qui cherche à trouver une solution face à un changement climatique de plus en plus rapide. Un article de notre partenaire Euractiv.
Why do ice ages occur? Surprisingly, even after many decades of paleoclimatic research we simply do not know for sure. Most scientists will agree that ice age cycles have something to do with precession: the slow wobble of the axis of the Earth. The ancient Egyptians and Greeks knew of precession and called it the Great Year, because it gives warm and cool seasons over its approximate 23,000-year cycle. But there is a problem with invoking the Great Year as the regulator of ice ages, because we should really get an interglacial warming every 23,000 years or so. And we don’t – they only happen every fourth or fifth Great Year.
But why should the global climate give a selective response to orbital warming and cooling? (Called ‘forcing’ in the climate trade.) This is one of the great unknowns of modern science.
The findings highlight the extent to which humans are impacting one of the world’s major ecosystems — the Miombo woodlands, which cover 2.5 million square kilometres, across countries including Angola, Zambia, Tanzania and Mozambique.
At the same time, however, the growing number of trees in remote parts of these woodlands is helping to offset the emissions, researchers say.
The study is the first to provide an in-depth analysis of areas gaining carbon while also losing it through degradation — a process where some, but not all, trees are removed, usually as a result of logging and fire.
Climate scientists acknowledge that CO2 follows rather than leads temperature, but they insist that feedback loops drive the transitions from glacial to interglacial conditions.
by Chris Money, September 2, 2015 in TheWashingtonPost
In a blockbuster study released Wednesday in Nature, a team of 38 scientists finds that the planet is home to 3.04 trillion trees, blowing away the previously estimate of 400 billion. That means, the researchers say, that there are 422 trees for every person on Earth.
However, in no way do the researchers consider this good news. The study also finds that there are 46 percent fewer trees on Earth than there were before humans started the lengthy, but recently accelerating, process of deforestation.
“We can now say that there’s less trees than at any point in human civilization,” says Thomas Crowther, a postdoctoral researcher at the Yale School of Forestry and Environmental Studies who is the lead author on the research. “Since the spread of human influence, we’ve reduced the number almost by half, which is an astronomical thing.”
Over the years there has been a sustained effort to portray human exposure to very high levels of CO2 as toxic. A new study undercuts these claims, as the decision-making performances of controlled-experiment participants were not impaired when exposed to CO2 concentrations as high as 15,000 ppm.
Comments to the July 2018 global surface air temperature overview Temperature quality class 1: Lower troposphere temperature from satellites Temperature quality class 2: HadCRUT global surface air temperature Temperature quality class 3: GISS and NCDC global surface air temperature Comparing global surface air temperature and satellite-based temperatures Global air temperature linear trends
Global temperatures: All in one, Quality Class 1, 2 and 3
Global sea surface temperature
Ocean temperature in uppermost 100 m
North Atlantic heat content uppermost 700 m
North Atlantic temperatures 0-800 m depth along 59N, 30-0W
Global ocean temperature 0-1900 m depth summary
Global ocean net temperature change since 2004 at different depths
La Niña and El Niño episodes
Troposphere and stratosphere temperatures from satellites
Zonal lower troposphere temperatures from satellites
Arctic and Antarctic lower troposphere temperatures from satellites Temperature over land versus over oceans
Arctic and Antarctic surface air temperatures
Arctic and Antarctic sea ice
Sea level in general
Global sea level from satellite altimetry
Global sea level from tide gauges
Northern Hemisphere weekly and seasonal snow cover
Atmospheric specific humidity
Atmospheric CO2
The phase relation between atmospheric CO2 and global temperature
Global air temperature and atmospheric CO2
Latest 20-year QC1 global monthly air temperature change
Sunspot activity and QC1 average satellite global air temperature
Climate and history: 1728: Vitus Bering and the non-discovery of Bering Strait
It’s well known that climate models show increasing sensitivity over time: for a given forcing, the true long-term temperature increase (ECS) is higher than what you’d estimate if you simply extrapolated from the past (ECS_hist). In other words, the ECS-to-ECS_hist ratio is above 1. This article tries to work out why climate models behave like that; that is to say, the variable I’m trying to explain is the ECS-to-ECS_hist ratio.
Now, there’s probably too many hyphens and underscores in the text. So it will be more readable if I clarify that, every time I talk simply about ‘correlation’, I mean the correlation of thing X with the ECS-to-ECS_hist ratio. If other kind of correlation is mentioned, I’ll say so explicitly.
Wood density of European trees decreasing continuously since 1870
Trees are growing more rapidly due to climate change. This sounds like good news. After all, this means that trees are storing more carbon dioxide from the atmosphere in their wood and hence taking away the key ingredient in global warming. But is it that simple? A team analyzed wood samples from the oldest existing experimental areas spanning a period of 150 years — and reached a surprising conclusion.
…
But the most important finding for practical and political aspects is that the current climate-relevant carbon sequestration of the forests is being overestimated as long as it is calculated with established but outdated wood densities. “The accelerated growth is still resulting in surplus carbon sequestration,” says Pretzsch. “But scaling up for the forests of central Europe, the traditional estimate would be to high by about ten million metric tons of carbon per year.”
Somebody said economists try to predict the tide by measuring one wave. This puts them in the same league as climate scientists trying to predict the climate by measuring one variable, CO2. It is no surprise that an amalgam of the two, climate and economics, produces even worse results, but that is what happened early in the anthropogenic global warming (AGW) deception.
Silica is needed by a group of marine algae (the microscopic plants of the oceans) called diatoms, who use it to build their glassy cell walls (known as frustules).
These plankton take up globally significant amounts of carbon — they remove carbon dioxide from the atmosphere via photosynthesis, and act as a natural carbon sink when they die and fall to the bottom of the ocean — and form the base of the marine food chain.
…
The researchers are also planning to use more complex and realistic computer models to delve deeper into the potential changes in the global silica cycle since the last glacial maximum. These might include more accurate representations of ocean currents, recycling of silica in the water column, and potential changes to the marine algal community.
De tous temps les hommes se sont intéressés au climat et ont tenté de prévoir son évolution. Dès l’Antiquité il était connu que des caractéristiques géographiques comme la latitude mais aussi l’altitude ou le voisinage de vastes étendues d’eau avaient une grande influence sur le climat. Sur cette base les climatologues ont été amenés à distinguer différents types de climats tels que tropical, désertique, tempéré, polaire, etc. Ensuite, il est progressivement apparu que le climat est un système extrêmement complexe qui dépend de l’activité solaire ainsi que de la distance et de l’orientation de la Terre par rapport au Soleil, facteurs qui varient à des échelles de temps très différentes.
…
La géologie, une science plus que passionnante … et diverse