by Jime Steele, July 12, 2021 in WUWT
For those who truly want to be guided by science, put aside the climate crisis hysteria. We can explain the natural dynamics of all heat waves by simply knowing 1) how heat is transported along the earth’s surface; 2) how heat is transported vertically; 3) how solar heating changes; and 4) how the greenhouse effect varies.
Below is a map of global temperature anomalies for the year 2014 that illustrates natural climate dynamics. There is no uniform warming that might be expected from a global blanket of greenhouse gases. Across the globe, surface temperatures alternate between regions of above average warmth (red) with regions of below average (blue). (Gray regions lack sufficient data). Indeed, the observed cooler eastern USA is dubbed a “warming hole” by climate scientists because its cooling trend contradicts global warming theory. It requires a natural climate dynamic explanation.
…
…
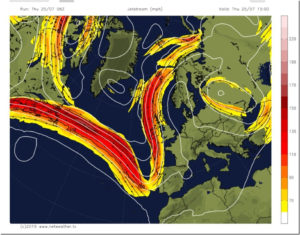
The temperature pattern is associated with regions where warmer air from the south more frequently intruded northward, while simultaneously, cold air from the north intruded southward. This pattern is due to a naturally wavy jet stream and associated pressure systems. The warm red regions indicate regions where high‑pressure systems dominate. In the northern hemisphere, high pressure systems cause clockwise atmospheric circulation that pulls warm air northward on its western side, and cold air southward on its eastern side. Low pressure systems circulate counter-clockwise, conversely pulling cold air southward on its western side. These combined circulation patterns partly explain both the extreme cold that dropped Texas temperatures as much as 50° F below average in February 2021, as well as extreme heating that raised USA’s northwest temperatures 30°- 40° F above normal the following June. Similarly in 2019, northward transport of heated air from the Sahara desert caused heat waves over Europe and Greenland. Such natural heat transport can also cause coastal Alaska to be warmer than Florida.
…
…