Archives par mot-clé : History

The Insignificance of Greenland’s Ice Mass Loss in Five Easy Charts…

by David Middleton, February 5, 2020 in WUWT


This is a sort of a spin-off of Rutgers University Global Snow Lab and “the Snows of Yesteryear” and A Geological Perspective of the Greenland Ice Sheet. And, yes, there are a lot more than five charts in this post… And, none of them were all that easy.

Introduction

There is a general scientific consensus that the Greenland Ice Sheet (GrIS) has been losing ice mass since the Little Ice Age (LIA). This should come as no surprise, since the LIA was quite likely the coldest climatic episode of the Holocene Epoch. Although it does appear that the GrIS may have gained ice mass during the mid-20th century global cooling crisis.

According to Mouginot et al, 2019, the GrIS was gaining an average of +47 ± 21 Gt/y from 1972–1980, then began to lose ice mass after 1980:

  • -51 ± 17 Gt/y from 1980–1990

  • -41 ± 17 Gt/y from 1990–2000

  • -187 ± 17 Gt/y from 2000–2010

  • -286 ± 20 Gt/y from 2010–2018


Figure 4. Central Greenland temperature reconstruction (Alley, 2000).

Longest-Ever S. Hemisphere Tree-Ring Reconstruction Finds The 1700s-1800s Were Warmer Than Today

by  K. Richard, February 3, 2020  in NoTricksZone


A new 5680-year tree-ring temperature reconstruction for southern South America (Lara et al., 2020) reveals (a) no clear warming trend in recent decades, and (b) the 18th and 19th centuries (and many centennial-scale periods from the last 5680 years) had much warmer temperatures than today.

In addition to finding modern temperature changes in southern South America fall well within the range of natural variability in the context of the last 5680 years, Lara et al. (2020) assess solar forcing to have contributed to climate variations for this region of the Southern Hemisphere.

Another New Study Finds The Canadian Arctic Was About 1-2°C Warmer During Medieval Times

by K. Richard, December 16, 2019 in NoTricksZone


Four reconstructions from the central and western High Arctic reveal July temperatures were about 1-2°C warmer than today during most of the 1st millennium and Medieval period (Tamo and Gajewski, 2019).

A few years ago, a chironomid reconstruction of Boothia Peninsula in the Canadian Arctic (Fortin and Gajewski, 2016) revealed not only were today’s temperatures the coldest of the last 7000 years, but the last 150 years “do not indicate a warming during this time.”


Cartology Affirms Relative Sea Levels Were Similar To Or HIGHER Than Now During The Little Ice Age

by K. Richard, December 5, 2019 in NoTricksZone


Surprisingly accurate nautical maps created the 17th to 19th centuries strongly suggest coastal land area in both hemispheres were quite similar to today’s. There is even evidence relative sea levels were higher than now back then.

Image Source: Etsy.com

Globally, coasts have grown since the 1980s

Between 1985 and 2015, satellite observations indicate the world’s coasts gained 13,565 km²  more land area than they had lost to the seas (Donchyts et al., 2016).

This means more coastal land area is above sea level today than in the 1980s.

This surprises scientists, as they “expected the coast would start to retreat due to sea level rise,” but instead they observed “coasts are growing all over the world.”

New Paper Presents Photo Evidence Affirming Equatorial Region Sea Levels Have FALLEN Since The 1600s

by K. Richard, November 29, 2019 in NoTricksZone


In a new paper (Mörner, 2019, expanding upon Mörner, 2017), photo evidence confirms sea levels in 5 studied equatorial regions have fallen by about 60 cm since the 17th century…and remained stable since the 1970s.

Another new study (Haryono et al., 2019) of sea level change in equatorial Indonesia also supplies photos of marine terrace biomarker evidence affirming sea levels were about 5 meters higher than they are today between 5000 to 3000 years before present, suggesting “it means it was warmer than the present day” back then.

Raw Data Bombshell: no change in Very Hot Days in Australia since World War I

by JoNova, November 20, 2019


After we were shocked at the latest ACORN changes to our Very Hot Days data, I asked Chris Gillham if we could see the effect of Bureau of Meteorology changes to the original raw data – and he replied it would be too time-consuming writing the code to calculate 40C+ days among the millions of daily temperatures from 112 weather stations across Australia since 1910. Then he did it anyway.

Wow. In 2011, the BoM’s ACORN 1 adjustments wiped out some of the “very hot days” recorded at weather stations in the early 1900s. These were records that had stood for a whole century. Then, quietly six years later, the ACORN 2 readjustments turned the statistical air conditioner on again and cooled people from 100 years in the future.

It’s all especially miraculous given that even the old World War I  data was recorded in official BoM-approved Stevenson screens. The BoM won’t consider pre 1910 data because it wasn’t standardized, but even when it is, they still have to “fix” it. And in the intervening years after 1910, the Urban Heat Islands have grown and electronic equipment that can record one-second-records have been introduced across the nation. With the old equipment, 40C+ extremes were harder to get than with today’s micro-minute spikes caused by gusts of hot air rolling off carparks and tarmacs.

What we see in the 60 longest running ACORN sites, all open in 1910, is that the raw temperature data had just as many “very hot days” in the World War I era as it does now. Oh boy.

No wonder the BOM was keen to move the “Very Hot Days” graphics and data and tuck them away in a remote page on their website.


170 Years of Earth Surface Temperature Data Show No Evidence of Significant Warming

by T. Bjorklund, October 16, 2019 in WUWT


Key Points

1. From 1850 to the present, the noise-corrected, average warming of the surface of the earth is less than 0.07 degrees C per decade.

2. The rate of warming of the surface of the earth does not correlate with the rate of increase of fossil fuel emissions of CO2 into the atmosphere.

3. Recent increases in surface temperatures reflect 40 years of increasing intensities of the El Nino Southern Oscillation climate pattern.

Abstract

This study investigates the relationships between surface temperatures from 1850 to the present and reported long-range temperature predictions of global warming. A crucial component of this analysis is the calculation of an estimate of the warming curve of the surface of the earth. The calculation removes errors in temperature measurements and fluctuations due to short-duration weather events from the recorded data. The results show the average rate of warming of the surface of earth for the past 170 years is less than 0.07 degrees C per decade. The rate of warming of the surface of the earth does not correlate with the rate of increase of CO2 in the atmosphere. The perceived threat of excessive future global temperatures may stem from misinterpretation of 40 years of increasing intensities of the El Nino Southern Oscillation (ENSO) climate pattern in the eastern Pacific Ocean. ENSO activity culminated in 2016 with the highest surface temperature anomaly ever recorded. The rate of warming of the earth’s surface has dropped 41 percent since 2006.

Solar-Climate Theory Sheds New Light On History Of Chinese Civilization

by S. Chen, Sep; 24, 2019 in ClimateChangeDispatch


Scientists say they have found evidence beneath a lake in northeastern China that ties climate change and 500-year sun cycles to ups and downs in the 8,000 years of Chinese civilization.

According to the study by a team at the Institute of Geology and Geophysics in Beijing published in the science journal Nature Communications this month, whenever the climate warmed, Chinese civilization prospered and when it cooled, it declined.

While historians have used various social and economic factors to explain changes over the millennia, Dr. Xu Deke, lead author of the paper, and his colleagues said that while people played their part, their study indicated that cycles in solar activity influenced human activity.

“We just point out there is a natural constraint on human efforts,” Xu said.

Previous research linking Chinese history to climate relied on written records, but ancient texts contained only subjective descriptions of the weather and social development. The records also go back only so far – writing in China was not invented until 3,600 years ago.

For this latest study, the team and its leader, Chinese Academy of Sciences professor Lu Houyuan, took plant and lake bed sediment samples to track climate change over the centuries and compared them with written records.


Mann, Hayhoe Try To Erase To The Pesky Medieval Warm Period

by J. Taylor, October 3, 2019 in ClimateChangeDispatch


Climate alarmists Michael Mann and Katharine Hayhoe have been caught using dubious, revisionist temperature data in their attempt, as one Climategate email author put it,  to “deal a mortal blow” to the extensively documented Medieval Warm Period.

Before climate change became a political issue, it was scientifically well-established that a significant global warming event occurred between approximately 900 AD and 1200 AD.

For example, the United Nations Intergovernmental Panel on Climate Change (IPCC) First Assessment Report presented a temperature history and visual graph documenting that the Medieval Warm Period existed and that it brought temperatures at least as warm as today (at pg. 7).

Multiple peer-reviewed studies provided additional confirmation of the Medieval Warm Period.

The warming climate of the Medieval Warm Period spurred abundant crop production, fewer extreme droughts and floods, a growing human population, and improving living standards.

The Little Ice Age terminated the Medieval Warm Period and brought devastating weather extremes, widespread crop failures, famines, plagues like the Black Death, and a contracting human population.

For a good summary of the extensive benefits of the Medieval Warm Period and the devastating harms of the Little Ice Age, see the excellent book, “In the Wake of the Plague: The Black Death and the World It Created.”

Emmanuel Le Roy Ladurie A (re)lire absolument…

by Alain Préat,  3 octobre 2019 inScienceClimatEnergie


S’il est un livre, et un des premiers, à s’être penché de manière aussi détaillée sur l’évolution (récente) du climat, c’est celui d’Emmanuel Le Roy Ladurie ‘Histoire du climat depuis l’an mil’, publié en 1967.

Rappelons cependant le livre précurseur de Joseph-Jean-Nicolas Fuster publié en 1845 et récemment analysé ici même à SCE (et toujours disponible, voir ici).


1/ Introduction

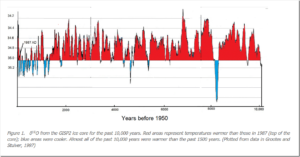
A lire ou relire ce livre de 366 pages (Figure 1), on ne peut qu’être stupéfié par l’analyse rigoureuse qui met en évidence la variabilité naturelle du climat aux échelles pluriséculaire et décennale, qui décortique et privilégie  avec finesse le caractère local du climat par rapport à un climat global et fournit à partir d’indicateurs fiables des fourchettes de températures pour les variations climatiques observées à l’échelle pluriséculaire.

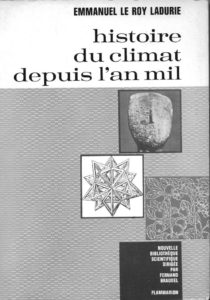
 Figure 1. Histoire du climat depuis l’an mil, Flammarion, publié en 1967

Avant d’aborder ce sujet en détail, il semble qu’aucun modèle sorti des ‘computers’ (GIEC) n’ait été jusqu’à présent capable de rendre compte des évolutions rapportées dans le livre d’ Emmanuel Le Roy Ladurie, ces modèles se prétendent ‘globaux’, contrairement à la conclusion du livre en question qui insiste particulièrement sur le caractère local des climats. Enfin il s’agit d’un livre de 366 pages bien illustré (photographies, cartes et graphiques) dans lequel il n’est pas mentionné une seule fois ‘le poison’ des temps modernes, à savoir le CO2. L’auteur, en 1967 (faut-il le rappeler …), propose ou explore quand  même des pistes pour rendre compte de la succession d’épisodes ‘froids’ et ‘chauds’, tout au long de ces 1000 années d’histoire, qui en fait  débutent il y a 3500 ans (mais pour ces temps historiques plus reculés, les données fiables sont moins nombreuses).


2/ Alors que dit Emmanuel Le Roy Ladurie ?

New Attempts To Erase The MWP & LIA

by P. Homewood, July 29, 2019 in NotaLotofPeopleKnowThat


There have been many attempts to get rid of the Medieval Warming Period and Little Ice Age, and here’s another one:

The science teams reconstructed the climate conditions that existed over the past 2,000 years using 700 proxy records of temperature changes, including tree rings, corals and lake sediments. They determined that none of these climate events occurred on a global scale.

https://www.bbc.co.uk/news/science-environment-49086783

As with the other failed attempts, this latest one claims that the MWP and LIA were only localised phenomena. But nothing could be further from the truth.

These three new studies rely on proxies, but time and again hockey stick studies based on proxies are proven to be fake, based on cherry picked proxies and dodgy statistics.

In fact, we have no need to rely on proxies, because the actual evidence of warm and cold periods is very real and substantial across the world.

We are all familiar with the evidence from Greenland ice cores, which clearly show both the MWP and LIA:

http://www.kaltesonne.de/temperatures-over-the-past-10000-years/


Anti science L. A. Times hypes propaganda denying global wide Medieval Warm Period and Little Ice Age

by Larry Hamlin, July 28, 2019 in WUWT


The Los Angeles Times is at it again hyping anti science climate alarmist propaganda trying to conceal the global wide Medieval Warm Period and the Little Ice Age that are supported and justified by hundreds of scientific studies.

This climate alarmist propaganda Times article cites a new “study” that ridiculously attempts to deny these clearly established warm and cool periods in our past.

This alarmist hyped new “study” is addressed in a superb article at the JoNova website demonstrating the complete lack of scientific veracity of this studies claims.

There is nothing I can add to show how politically contrived and inane the claims are from this new “study” beyond the excellent presentation in the JoNova article.

Provided below are excerpts from this excellent article which demonstrate the lack of scientific credibility of the new “study” as well as the politically driven anti science climate alarmism bias of the Times.


1970s: Earth Warmed 0.6°C From 1880-1940 And Cooled -0.3°C From 1940-1970. Now It’s 0.1°C And -0.05°C.

by K. Richard, July 25, 2019 in NoTricksZone


About 45 years ago, the “consensus” in climate science (as summarized by Williamson, 1975) was quite different than today’s version.

1. The Medieval Warm Period was about 1°C warmer than present overall while the “largely ice-free” Arctic was 4°C warmer, allowing the Vikings to navigate through open waters because there was “no or very little ice” at that time.
2. The island of Spitsbergen, 1237 km from the North Pole and home to over 2000 people, “benefited” because it warmed by 8°C between 1900 and 1940, resulting in 7 months of sea-ice free regional waters. This was up from just 3 months in the 1800s.
3. Central England temperatures dropped -0.5°C between the 1930s to the 1950s.
4. Pack-ice off northern and eastern iceland returned to its 1880s extent between 1958 and 1975.
5. In the 1960s, polar bears were able to walk across the sea (ice) from Greenland to Iceland for the first time since the early 1900s. (They had somehow survived the 7 months per year of sea-ice-free waters during the 1920s-1940s).


Image Source: National Academy of Sciences,  Understanding Climatic Change

Medieval Climate Anomaly Now Confirmed In Southern Hemisphere On All Four Continents

by Lüning et al., July  6, 2019 in NoTricksZone


For a long time it has been said that the Medieval Warm Period was a purely North Atlantic phenomenon. This has proved to be wrong.

On 29 June 2019, a paper by Lüning et al. 2019 on the Medieval Warm Period in Antarctica appeared in the trade journal Palaeogeography, Palaeoclimatology, Palaeoecology. Here is the abstract:

With the publication of this paper, the Medieval Climate Anomaly (MCA) has now been confirmed on all four continents of the southern hemisphere.

While the largest part of the southern hemisphere apparently experienced a warm phase during the MCA, there were also isolated areas that cooled down. To the latter regions belong, for example, coasts, where cold water from the depth rose increasingly. In other areas so-called climate seesaws or dipoles were active, as we know them from today’s climate. One end of the “seesaw” heats up, the other end cools down.

Another result of the studies is that the medieval climate history of huge areas in the southern hemisphere is simply unknown. A task force urgently needs to be set up to fill in this climatic “empty space” with information on pre-industrial temperature development. This information is urgently needed to calibrate the climate models on the basis of which far-reaching socio-political planning is currently taking place.

What follows are publications on the Medieval Period climate of the southern hemisphere as an overview:

Lüning, S., M. Gałka, F. Vahrenholt (2019): The Medieval Climate Anomaly in Antarctica. Palaeogeogr., Palaeoclimatol., Palaeoecol., doi: 10.1016/j.palaeo.2019.109251

Planet-Sized Experiments – we’ve already done the 2°C test

by Willis Eschenbach, March 17, 2019 inWUWT


People often say that we’re heading into the unknown with regards to CO2 and the planet. They say we can’t know, for example, what a 2°C warming will do because we can’t do the experiment. This is seen as important because for unknown reasons, people have battened on to “2°C” as being the scary temperature rise that we’re told we have to avoid at all costs.

But actually, as it turns out, we have already done the experiment. Below I show the Berkeley Earth average surface temperature record for Europe. Europe is a good location to analyze, because some of the longest continuous temperature records are from Europe. In addition, there are a lot of stations in Europe that have been taking record for a long time. This gives us lots of good data.

So without further ado, here’s the record of the average European temperature.

A 119-Year Temperature Reconstruction for the South China Sea

by Y, S., Zheng et al., 2018, Marine Micropaleontology, in CO2Science


According to Yuan et al. (2018), “studies examining sea surface temperature variability over the past one century and their influence on climate change in China are seriously lacking.” And therefore, in an effort to remedy this information void, the team of eight Chinese scientists developed “the first tree-ring-based dendroclimatic sea surface temperature (SST) reconstruction for the South China Sea.”

In accomplishing their objective Yuan et al. cored 22 Pinus massoniana trees in the Changting Region of the Fujian Province, China. Analysis of the cores revealed a statistically significant relationship between the tree-ring series and gridded March SSTs (1°C resolution) of the South China Sea (16-20°N, 112-116°E). Ultimately, this relationship enabled them to produce a proxy temperature reconstruction over the period 1893-2011, which reconstruction is shown below.

Study shows that Vikings enjoyed a warmer Greenland

by Charles the moderator, February 7, 2019 in WUWT


Study shows that Vikings enjoyed a warmer Greenland

Chemistry of bugs trapped in ancient lake sediment shows a warm climate at a key time in Greenland’s history

Although TV and movies paint Vikings as robust souls, braving subzero temperatures in fur pelts and iron helmets, new evidence indicates they might have been basking in 50-degree summer weather when they settled in Greenland.

After reconstructing southern Greenland’s climate record over the past 3,000 years, a Northwestern University team found that it was relatively warm when the Norse lived there between 985 and 1450 C.E., compared to the previous and following centuries.

German Scientists Back Findings By Gebbie et al 2019, Believe Climate CO2 Sensitivity Even “Likely To Be Lower” Than 1.3°C

by P. Gosselin, January 29, 2019 in NoTricksZone


A paper very worth reading from the USA from January 2019 in Science (Geoffrey Gebbie of the Woods Hole Oceanographic Institution/Peter Huybers of Harvard University, hereinafter GH19) is titled “The Little Ice Age and 20th-century deep Pacific cooling”.

It shows fascinating science.

The authors evaluated temperature measurements made in the deep sea by the famous expedition of the “HMS Challenger” in the 1870s. The ship sailed the Atlantic and Pacific, and probably provided the first data on the oceans down to depths of over 2000 meters. The recalibration of the old data alone is a work of art! What the paper found: The Pacific down in depths has cooled from 1870 to today, the Atlantic not.

Concord and discord among Northern Hemisphere paleotemperature reconstructions from tree rings

by Scott St. George Jan Esper, December 19, 2018 in WUWT


Highlights

  • Tree rings are the backbone of most last millennium temperature reconstructions.

  • Maximum density is a superior temperature proxy than ring-width but is less available.

  • The newest tree-ring reconstructions agree better with instrumental temperatures.

  • They also fit the memory structure of instrumental temperatures more closely.

  • It is imperative to develop new, long and up-to-date maximum density chronologies.

  •   

2 More New Climate Reconstructions Indicate Rapid COOLING In The Last 100+ Years

by K. Richard, November 22, 2018 in NoTricksZone


The evidence that “global” warming has not been global in scale continues to accumulate.  Two more new reconstructions from the Western Pacific (He et al., 2018) and subpolar North Atlantic (Orme et al., 2018)  indicate that modern temperatures have continued to decline since the onset of the Little Ice Age.

These add to the nearly 300 graphs published in the scientific literature since 2017 showing that there is nothing unusual, unprecedented, or remarkable about the temperatures changes in the last 150 years.

Scientists” Determine That the Worst Year in Human History Was… 536 AD.

by David Middleton, November 17, 2018 in WUWT


Why 536 was ‘the worst year to be alive’

By Ann Gibbons Nov. 15, 2018


Ask medieval historian Michael McCormick what year was the worst to be alive, and he’s got an answer: “536.” Not 1349, when the Black Death wiped out half of Europe. Not 1918, when the flu killed 50 million to 100 million people, mostly young adults. But 536. In Europe, “It was the beginning of one of the worst periods to be alive, if not the worst year,” says McCormick, a historian and archaeologist who chairs the Harvard University Initiative for the Science of the Human Past.

A mysterious fog plunged Europe, the Middle East, and parts of Asia into darkness, day and night—for 18 months. “For the sun gave forth its light without brightness, like the moon, during the whole year,” wrote Byzantine historian Procopius. Temperatures in the summer of 536 fell 1.5°C to 2.5°C, initiating the coldest decade in the past 2300 years. Snow fell that summer in China; crops failed; people starved. The Irish chronicles record “a failure of bread from the years 536–539.” Then, in 541, bubonic plague struck the Roman port of Pelusium, in Egypt. What came to be called the Plague of Justinian spread rapidly, wiping out one-third to one-half of the population of the eastern Roman Empire and hastening its collapse, McCormick says.

Extreme weather is the most likely and severe threat facing humanity!

by P. Homewood, November 8, 2018 in NotaLotofPeopleKnowThat


My very first foray into climate blogging was an analysis of extreme weather events in 1971. (I wrote it in 2011, so it was not a cherrypicked year, merely a nice round 40 years before.)

I won’t bore you with it again, as it was basically just a very long list. You can see it here though.

But here is a summary, which goes to show that extreme weather is the norm, not the exception:


Climate Book By Japanese Physics Professor: “The Globe Isn’t Warming Anymore”…IPCC “Scientifically Immoral”

by Kirye, October 23, 2048 in NoTricksZone


Dr. Fukai also points out that global vegetation coverage increased by 11% in 29 years, from 1982 to 2010, as increasing CO2 has helped the greening of the Sahel and Sahara Desert. He contradicts the often heard media claims that drought is spreading globally, writing: “The media spread the word that desertification is progressing globally, but practically the desert is greening through CO2.” […] “Everyone should be aware that increasing CO2 concentrations in atmosphere is not in itself harmful, but it’s a good thing.”

No correlation

Dr. Fukai also shows that the earth’s temperature change is not simple and does not correlate at all with CO2. He shows graphs from D. M. Etheridge et al., Mauna Loa Observatory and the temperature data from Moberg et al. (2005).

Chart: ftp://ftp.ncdc.noaa.gov/pub/data/paleo/contributions_by_author/moberg2005/nhtemp-moberg2005.txt 

The retired Japanese professor writes that at around 1000 A.D. — the Medieval Warm Period — there were no signs showing CO2 concentration was higher. A temperature graph using data from Moberg et al. (2005) shows the Medieval Warm Period appears clearly and that CO2 was in fact around 280 ppm at that time.